|
Sunday, November 5, 2017, 2230ET
Market Timing Charts, Analysis & Commentary for Issue #216
Timer Charts of S&P-500 Cash Index (SPX) + NASDAQ-100 Cash Index (NDX)
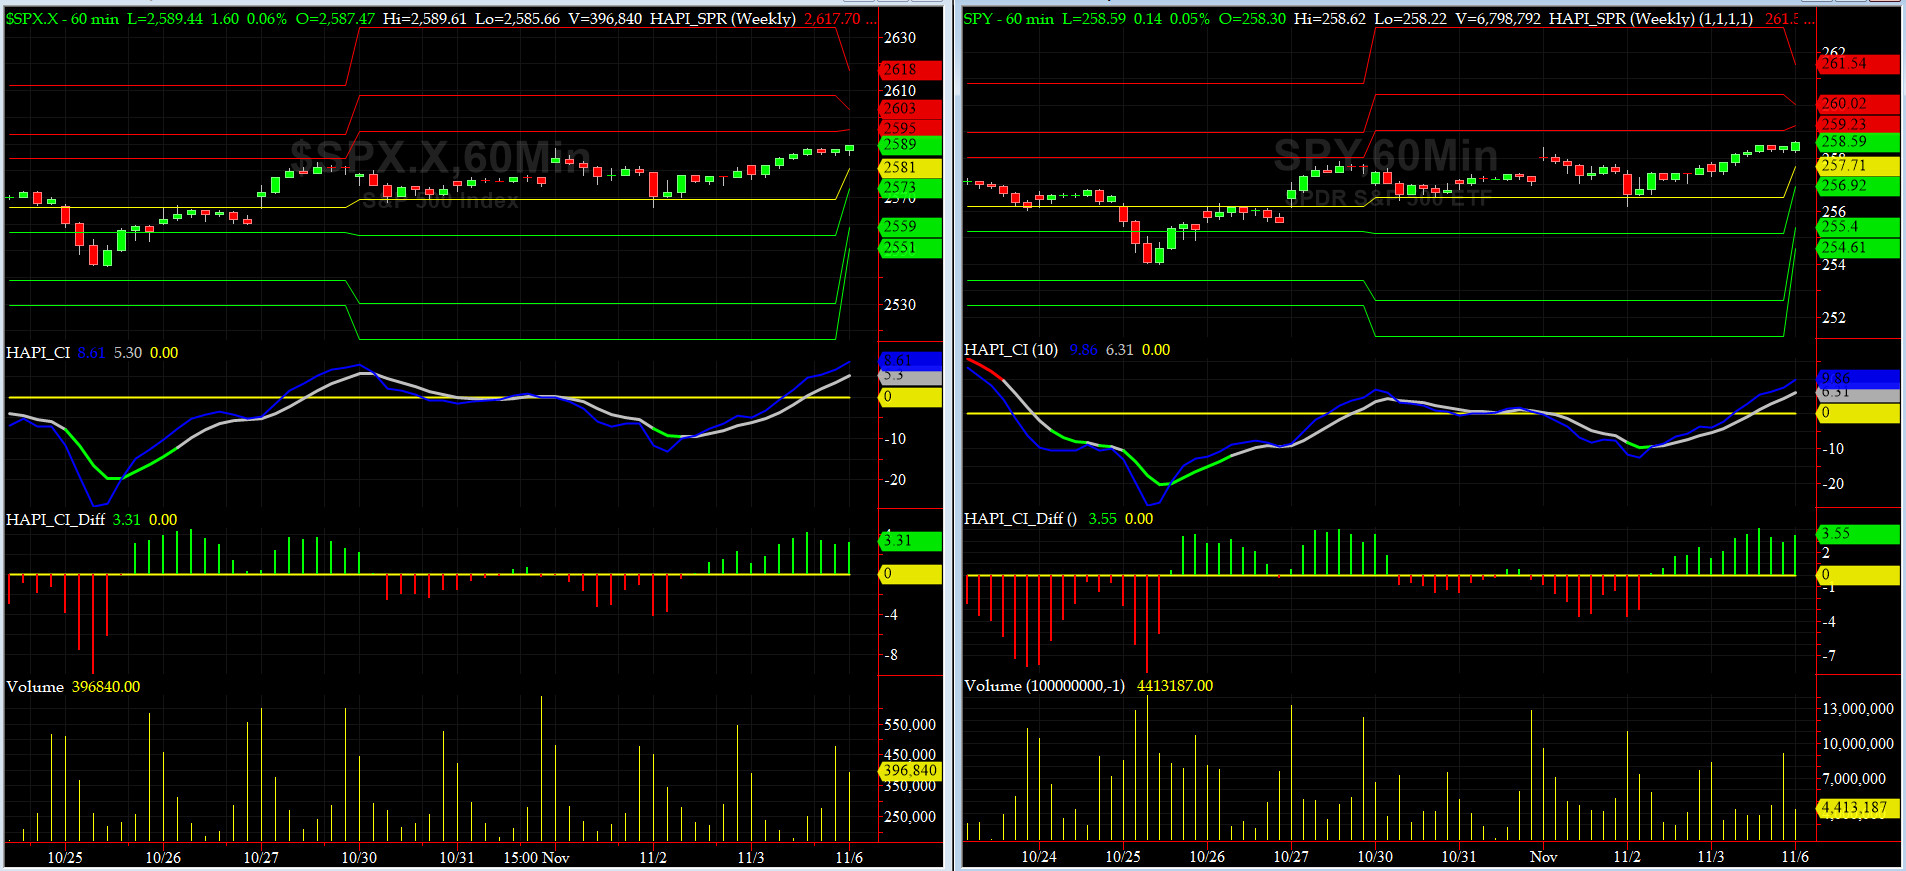
Most recent S&P-500 Cash Index (SPX): 2587.84 up +6.77 (up +0.26%) for the week ending on Friday, November 3, 2017, which closed at its +2 sigma.
SPX ALL TIME INTRADAY HIGH = 2588.42 (reached on Friday, Nov 3, 2017)
SPX ALL TIME CLOSING HIGH = 2587.84 (reached on Friday, Nov 3, 2017)
Current DAILY +2 Sigma SPX = 2588 with WEEKLY +2 Sigma = 2596
Current DAILY 0 Sigma (20 day MA) SPX = 2565 with WEEKLY 0 Sigma = 2489
Current DAILY -2 Sigma SPX = 2542 with WEEKLY -2 Sigma = 2383
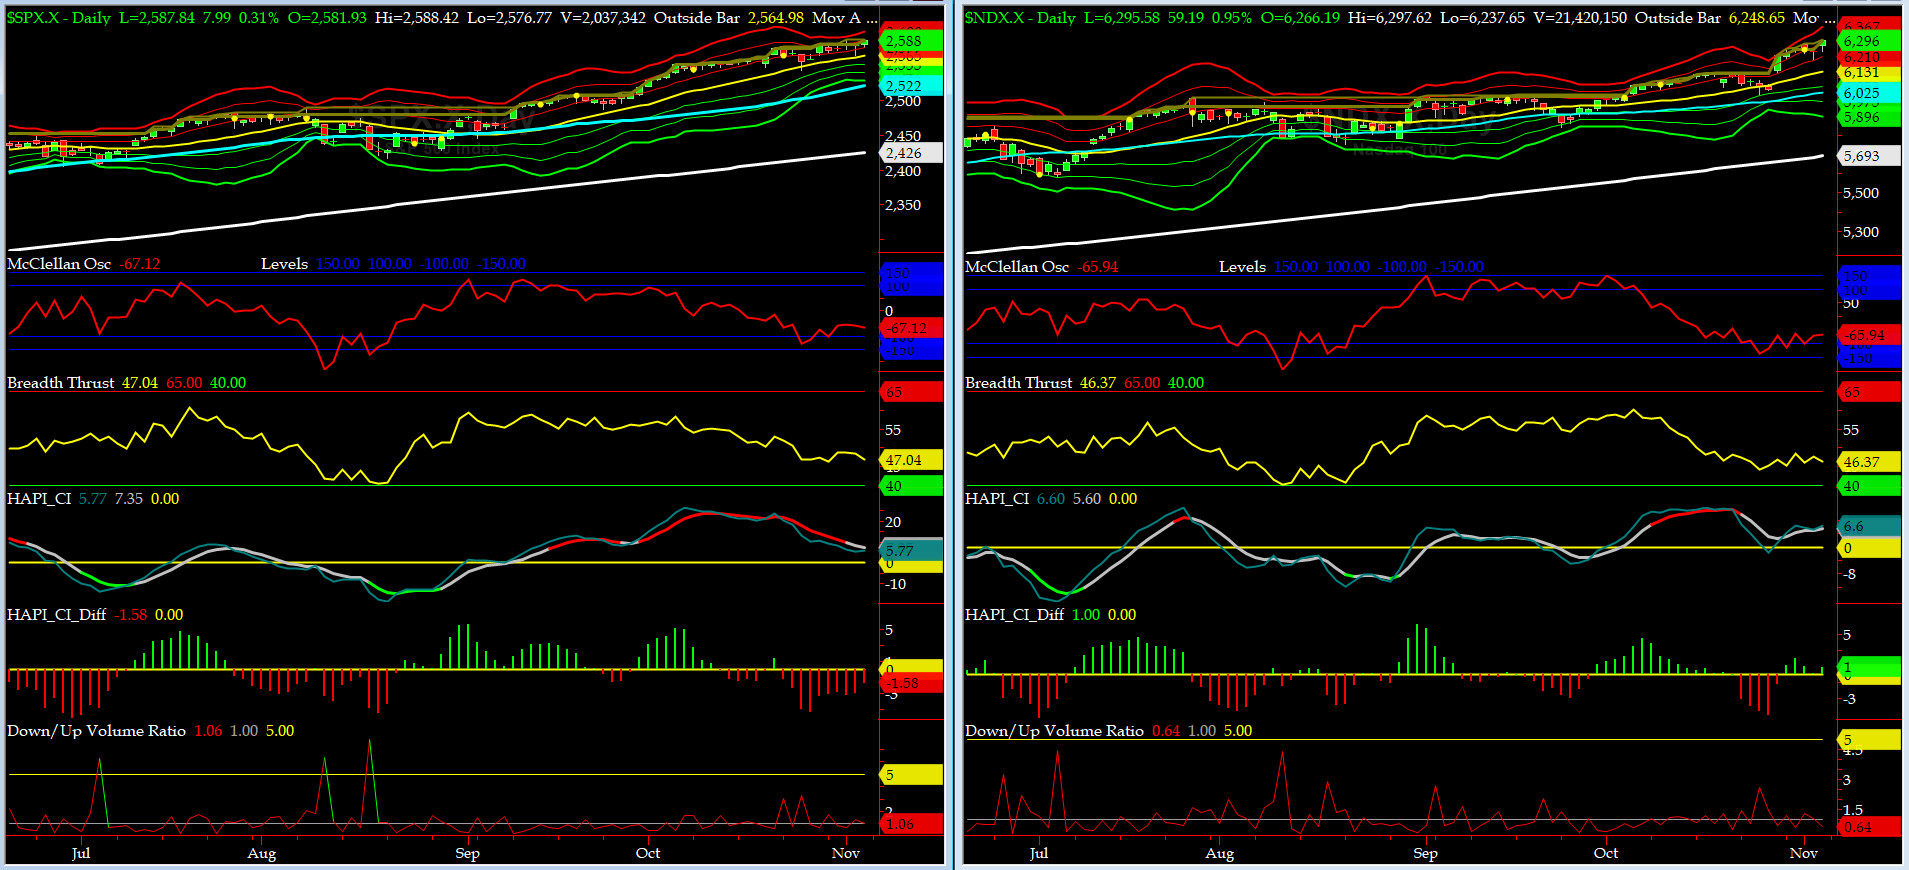
NYSE McClellan Oscillator = -67 (-150 is start of the O/S area; around -275 to -300 area or lower, we go into the �launch-pad� mode, over +150, we are in O/B area)
NYSE Breadth Thrust = 47 (40 is considered as oversold and 65 as overbought)
Both DJ TRAN and RUT failed to confirm new highs in SPX, NDX & DJIA. We view this as a tad troublesome.

Canaries [in the Coal Mine] Chart for DJ TRAN & RUT Indices
200-Day MA DJ TRAN = 9371 or 4.1% above DJ TRAN (max observed in last 7 yrs = 20.2%, min = -20.3%)
200-Day MA RUT = 1409 or 6% above RUT (max observed in last 7 yrs = 21.3%, min = -22.6%)
DJ Transportation Index (proxy for economic conditions 6 to 9 months hence) continues to diverge from SPX. This does not bode well for over all market sentiment.
Russell 2000 Small Caps Index (proxy for Risk ON/OFF) moved bi-directionally every single trading day of last week and ending the week in negative territory but RISK is still ON, for now.
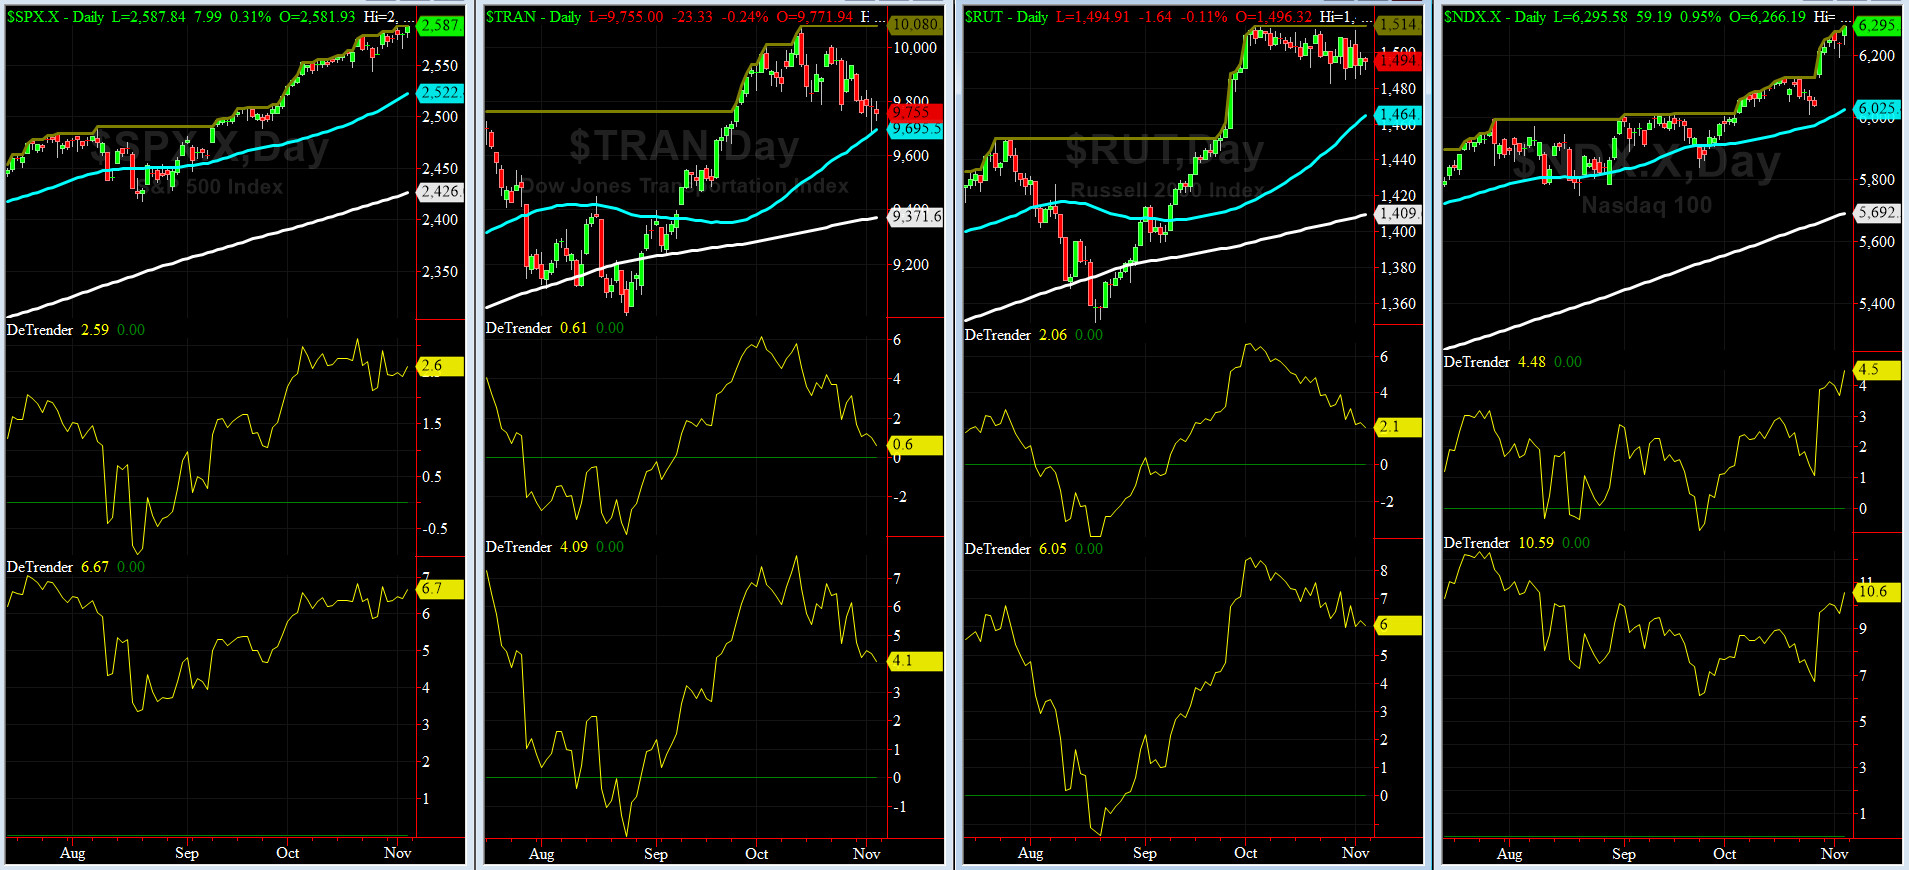
DeTrenders Charts for SPX, NDX, TRAN & RUT Indices
50-Day MA SPX = 2522 or 2.6% below SPX (max observed in last 7 yrs = +8.6%, min = -9.3%)
200-Day MA SPX = 2426 or 6.7% below SPX (max observed in last 7 yrs = 15.2%, min = -14%)
Again, all of our EIGHT DeTrenders are continue to remain POSITIVE while the DeTrenders for DJ Tran & RUT will continue to be harbingers of future price behavior in broad indices.
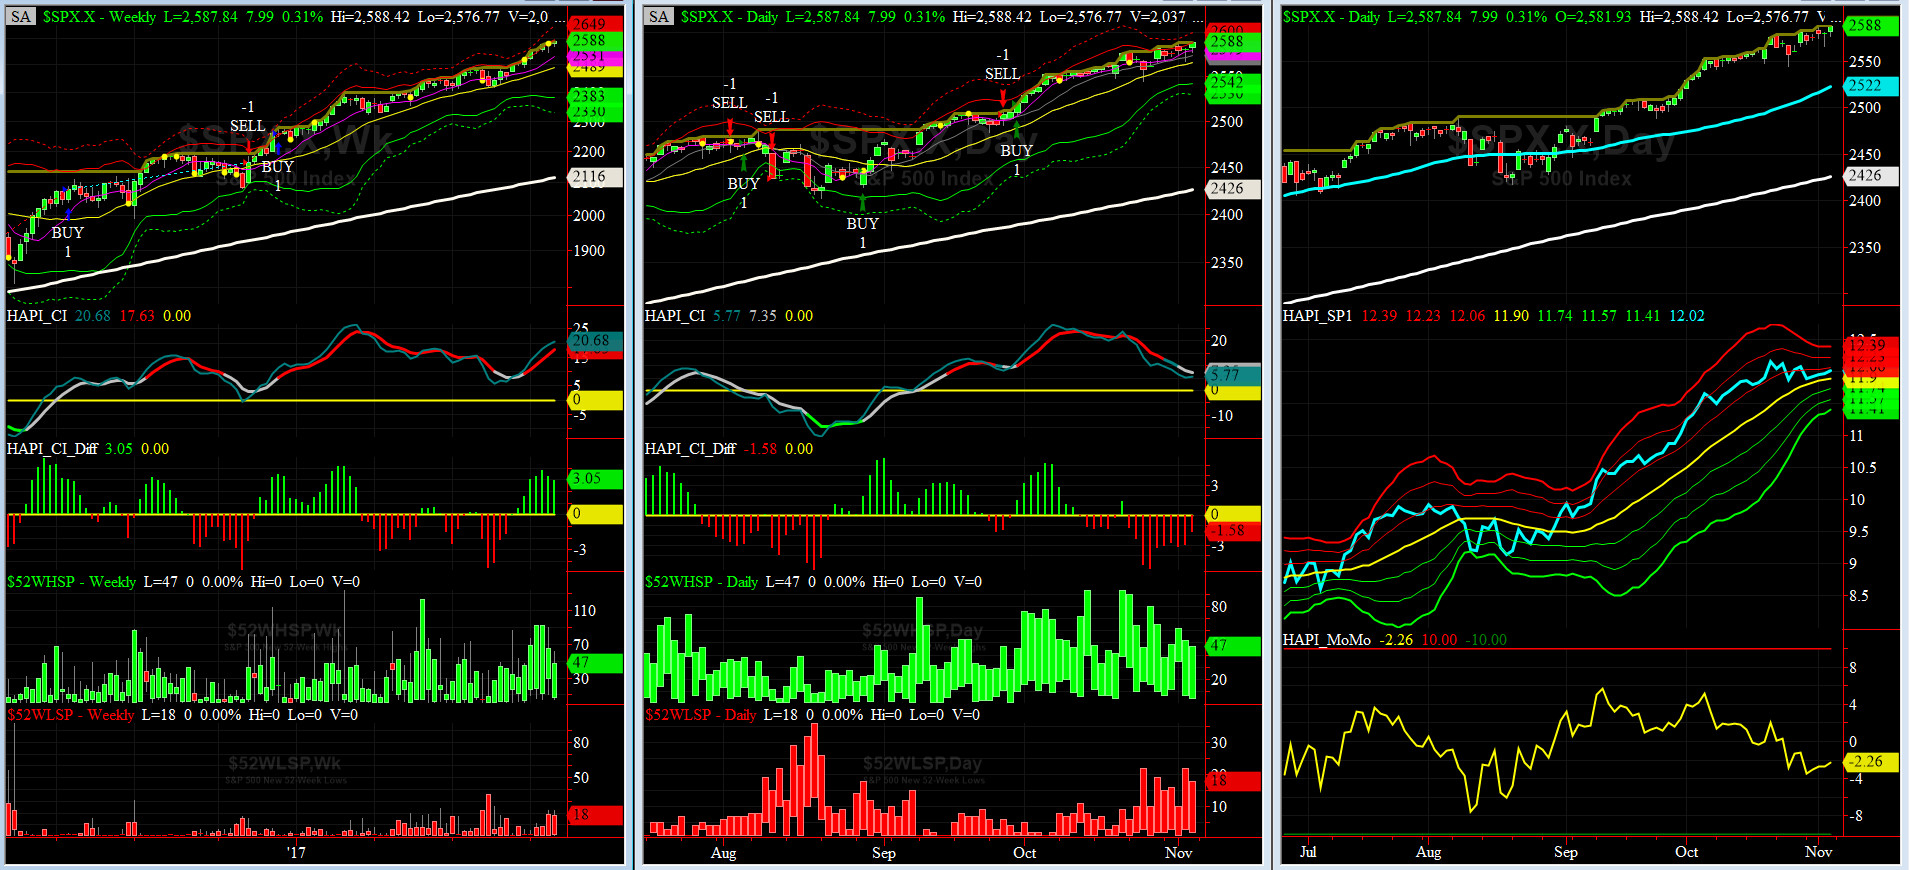
HA_SP1_Momo Chart
WEEKLY Timing Model = on a BUY Signal since Friday 12/16/16 CLOSE at 2258
DAILY Timing Model = on a BUY Signal since Friday 9/29/17 CLOSE at 2519
Max SPX 52wk-highs reading last week = 62 (over 120-140, the local maxima is in)
Max SPX 52wk-Lows reading last week = 22 (over 40-60, the local minima is in)
HA_SP1 closed near its +0.5 sigma channels
HA_Momo = -2.3 (reversals most likely occur above +10 or below -10)
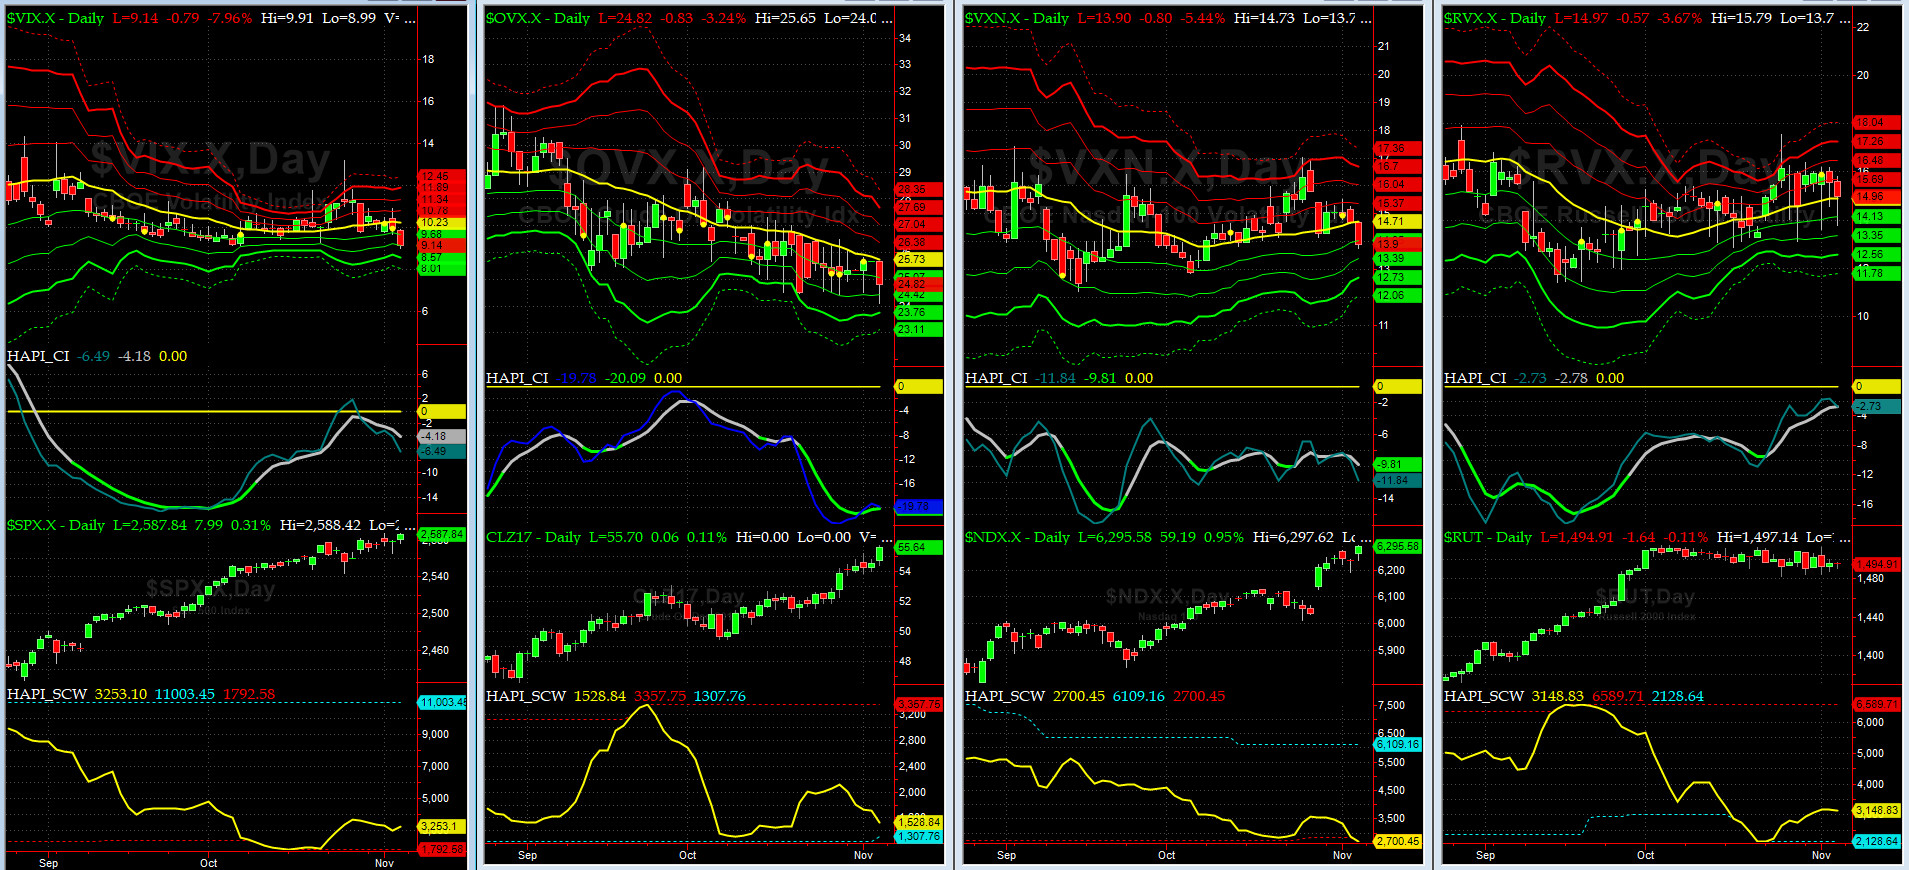
Vol of the Vols Chart
VIX currently stands at 9.14, at about its -2 sigma (remember it's the VIX volatility pattern ( its sigma channels) that matters, and not the level of VIX itself (this is per Dr. Robert Whaley, a great mentor and inventor of original VIX, now called VXO ). VIX usually peaks around a test of its +4 sigma).
Last week, VIX sold off about 4 sigma levels. This shall not stand. We should expect a spike soon.
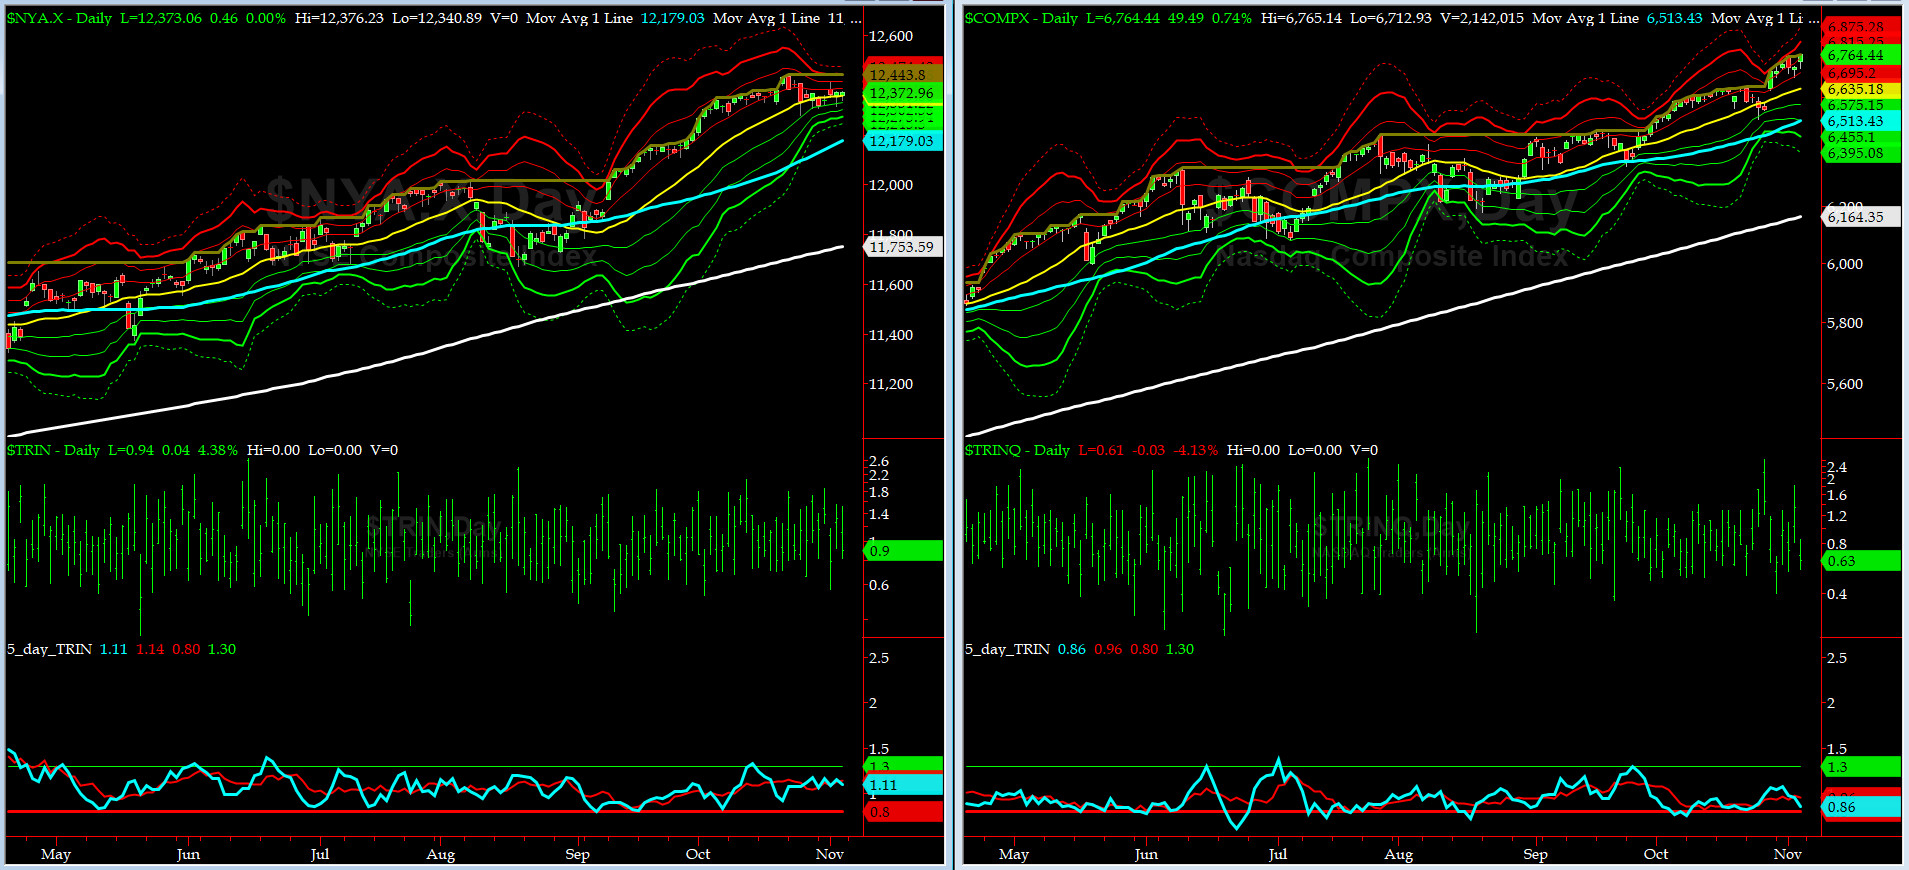
5-day TRIN & TRINQ Charts
NASDAQ 5-day TRIN is nearing the SELL Zone.
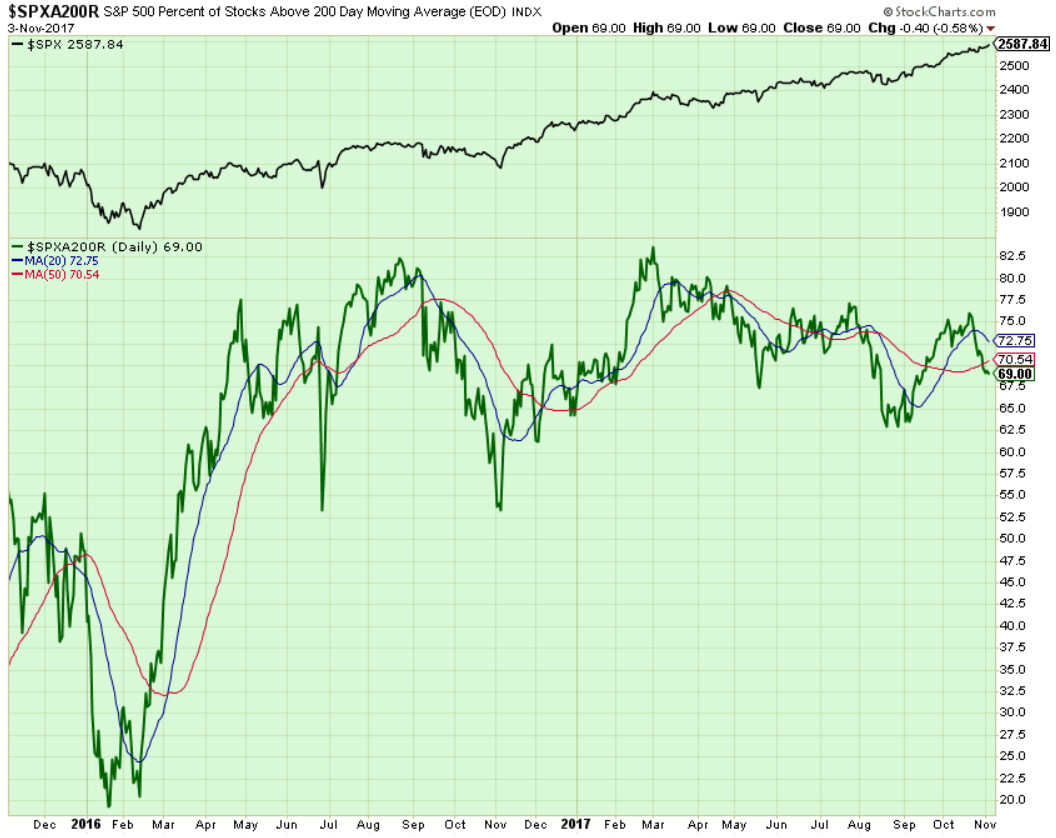
Components of SPX above their respective 200day MA Chart
This scoring indicator continues to put in divergence with SPX, dropping below 70% while SPX and NDX ran up to ATHs. As mentioned here before, this continues to concern us.
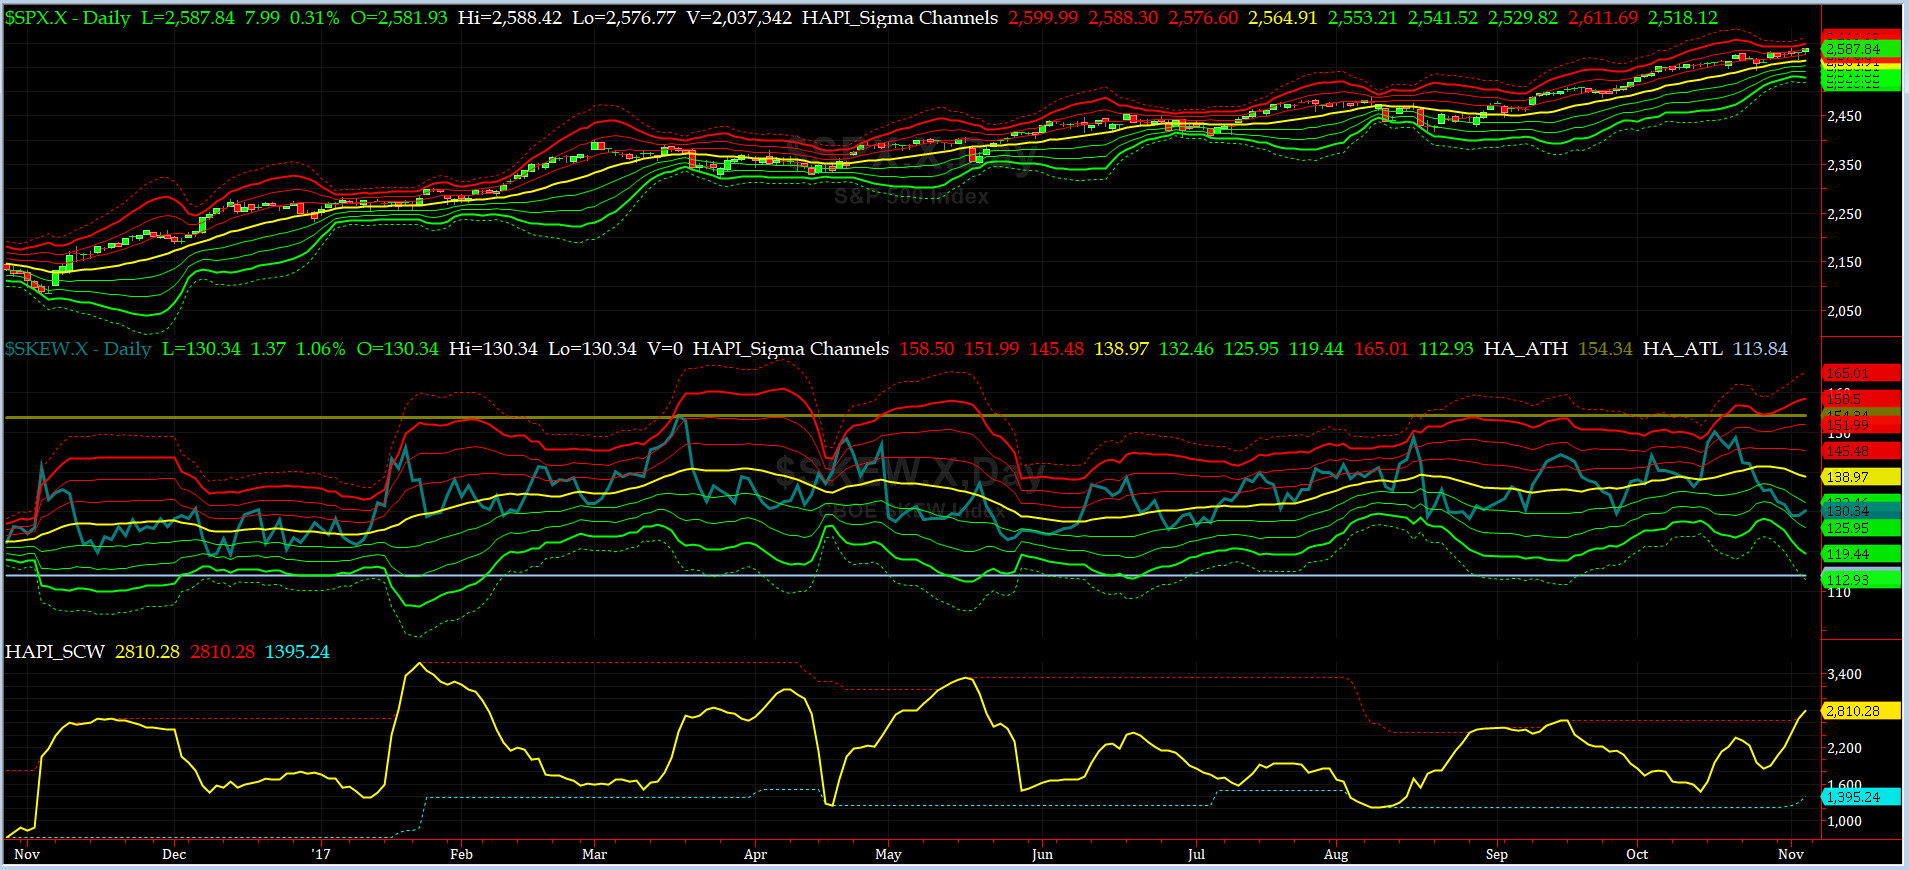
SPX SKEW (Tail Risk) Chart
Last week SPX SKEW (Tail Risk) closed at 130.3, or about its -0.5 sigma (normal = 120-125, range 100-150).
Is all quiet on the Eastern & Mid-Western Fronts? Smart Money thinks YES.
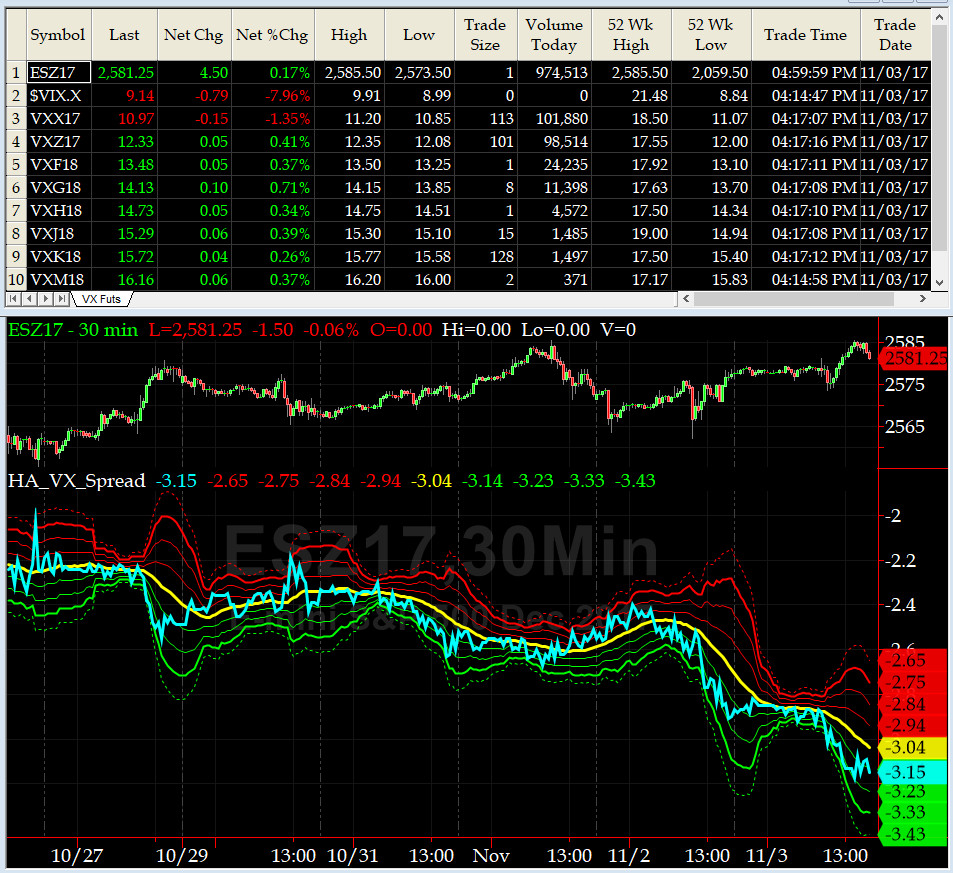
3-month VIX Futures Spread(VX) Chart
Our Long NOV17, Short FEB18 Spread trended lower to close at -3.15. Equity markets remain in overbought zone.
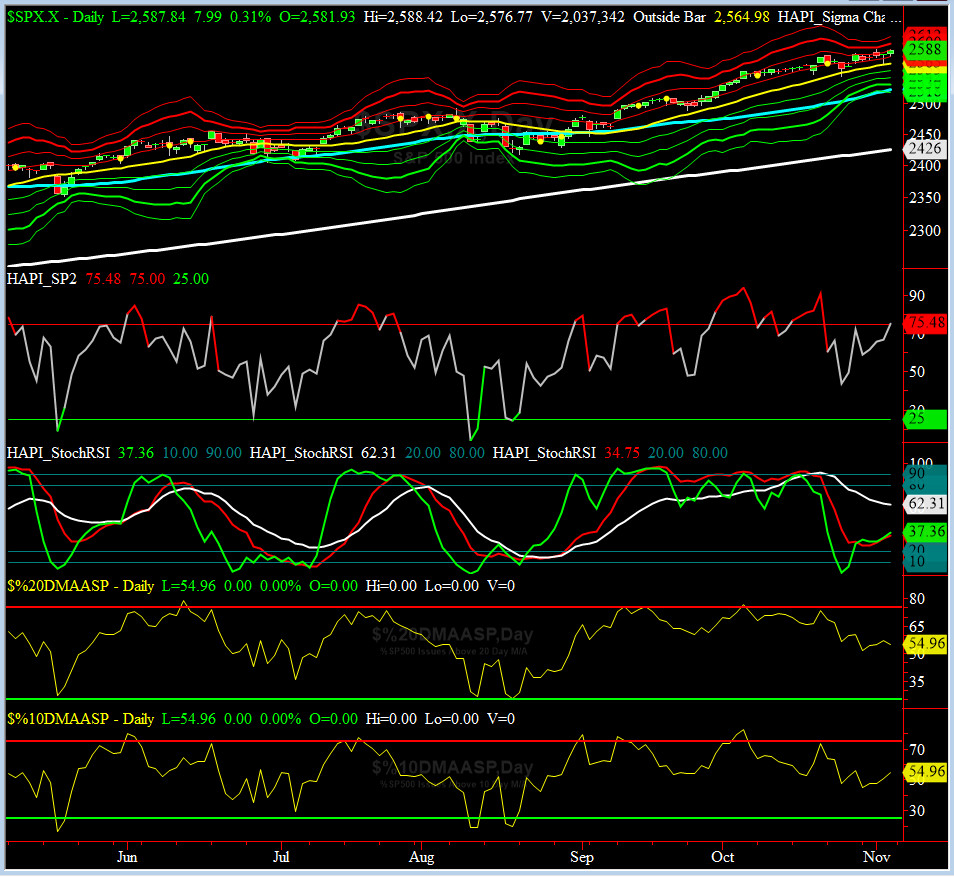
HA_SP2 Chart
HA_SP2 = 75.48 (Buy signal <= 25, Sell Signal >= 75)
Our favorite prop indicator back to overbought zone. Note the levels we observed for SP2 since Oct 1st vs SPX (seeing another big divergence here).
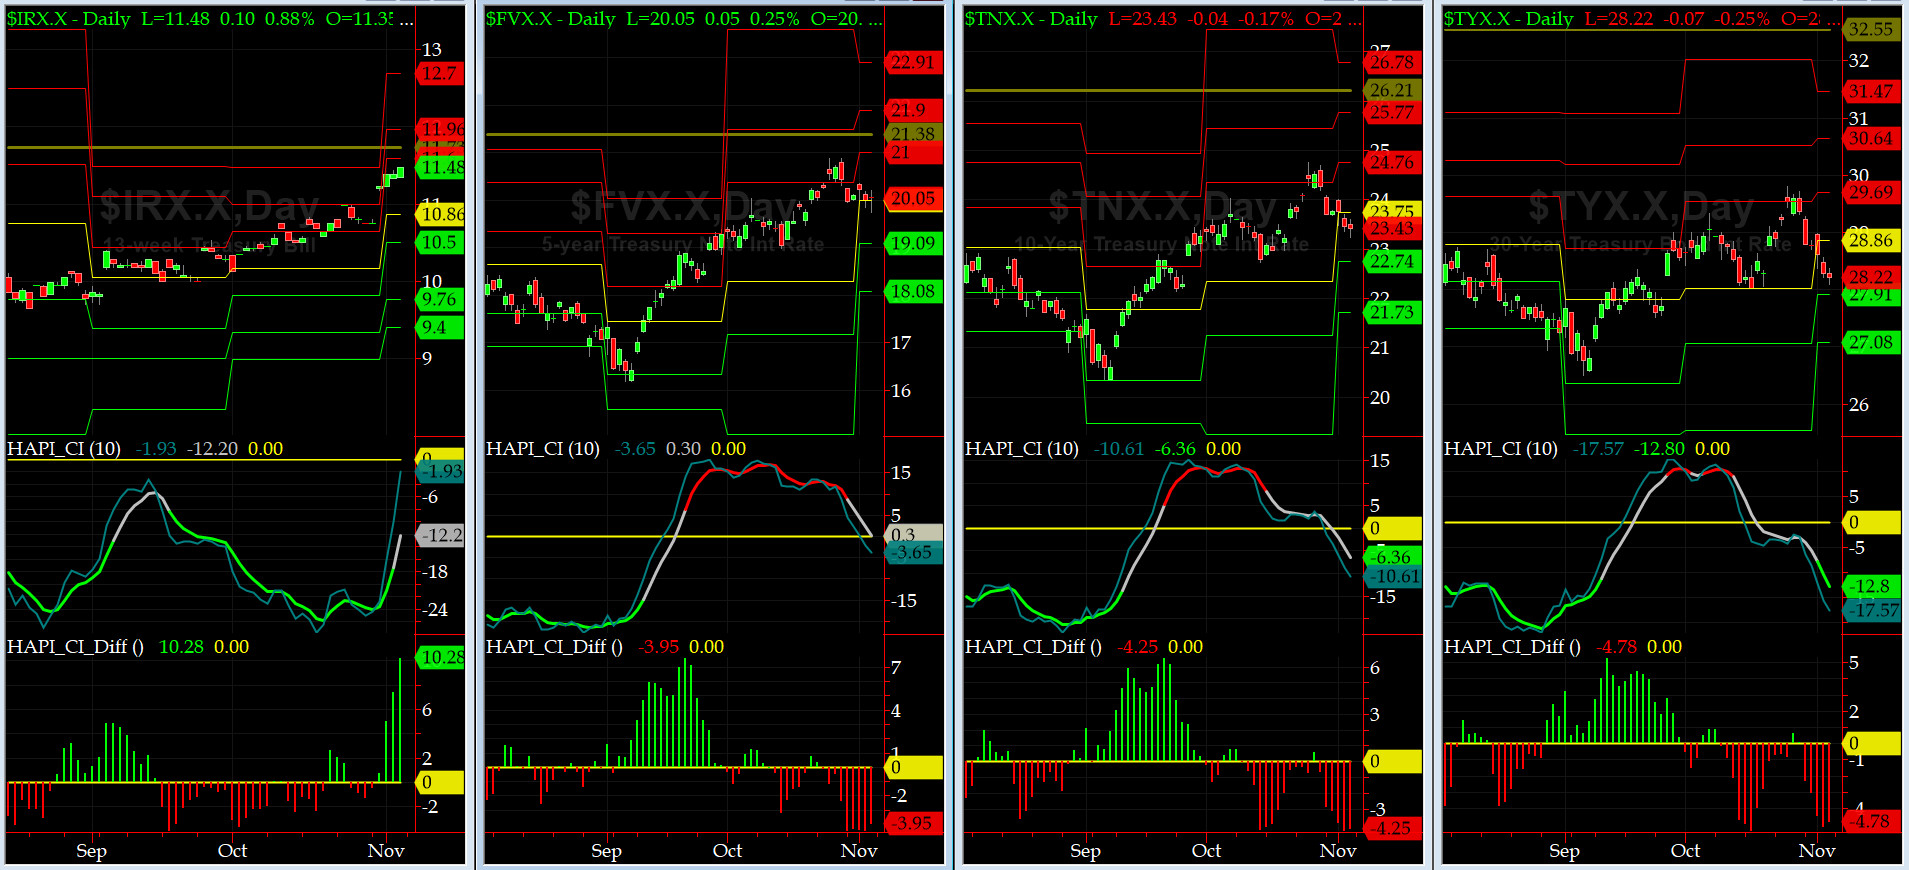
US Treasury T-Notes & T-Bonds Yields Chart
Our Treasury Market rallied further and slowly pushed the YTMs lower for T-Notes and T-Bonds. But the front end of the Yield Curve had another up-tick.
Fari Hamzei
|


 Proactive Market Timing