|
Sunday, November 12, 2017, 1400ET
Market Timing Charts, Analysis & Commentary for Issue #217
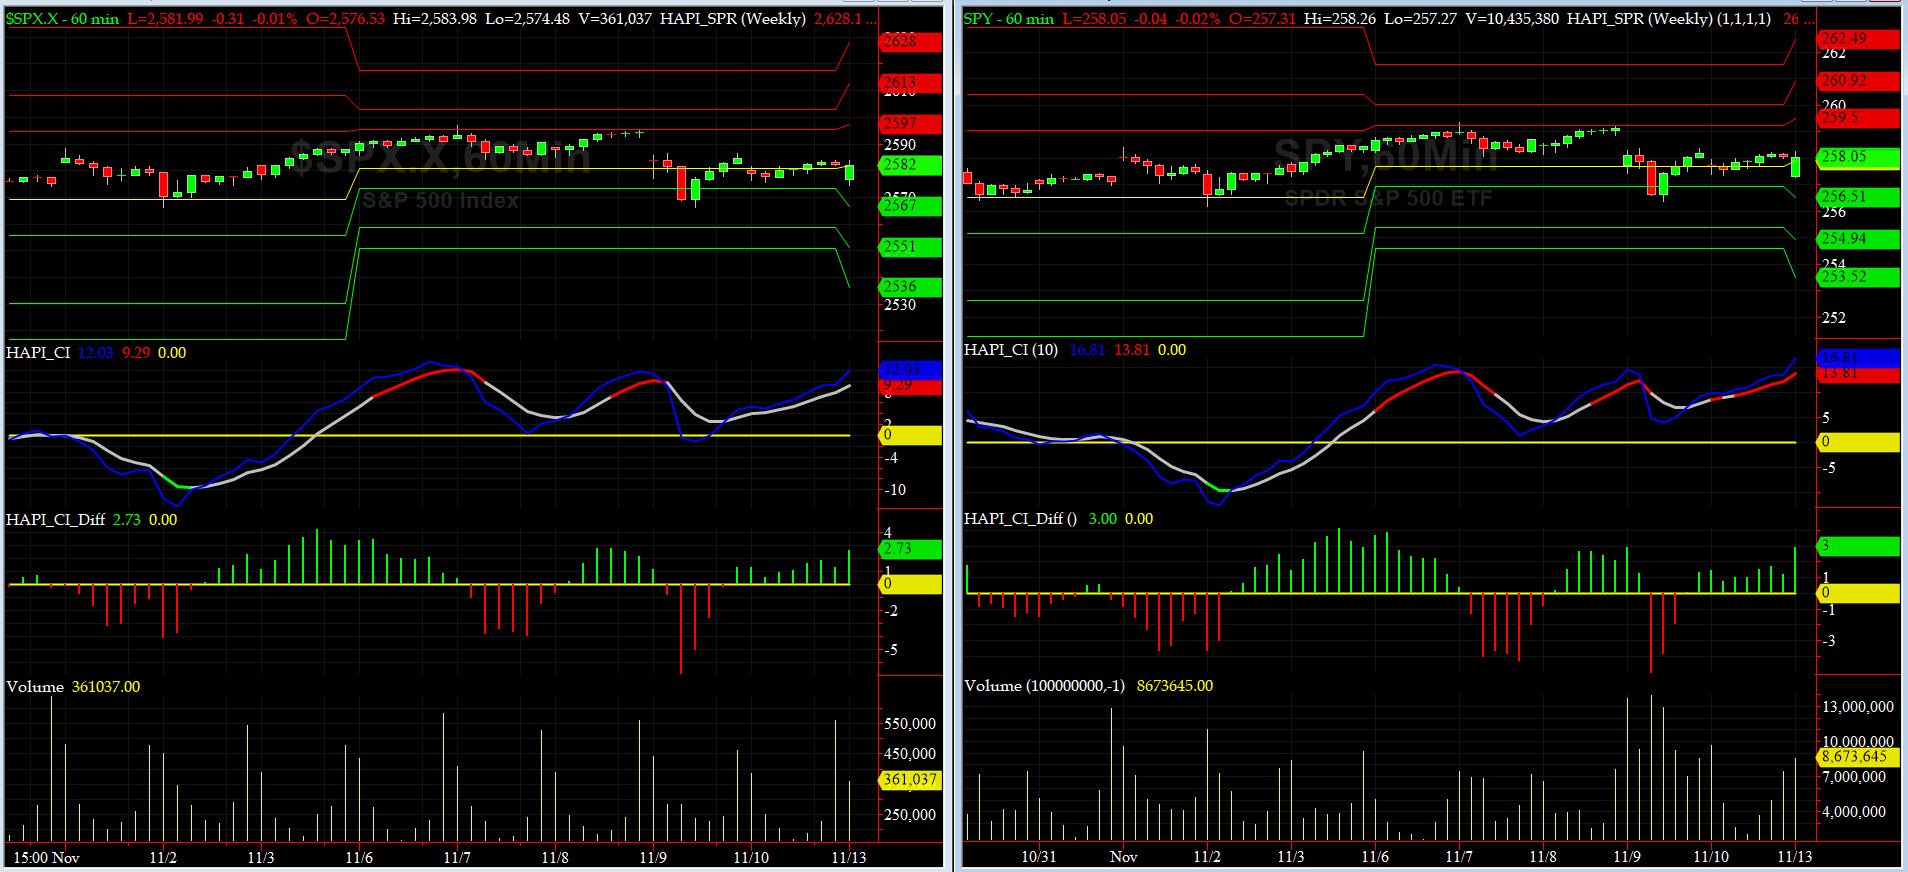
Timer Charts of S&P-500 Cash Index (SPX) + NASDAQ-100 Cash Index (NDX)
Most recent S&P-500 Cash Index (SPX): 2582.30 down -5.54 (down 0.21%) for the week ending on Friday, November 10, 2017, which closed at its +0.5 sigma.
SPX ALL TIME INTRADAY HIGH = 2588.42 (reached on Friday, Nov 3, 2017)
SPX ALL TIME CLOSING HIGH = 2587.84 (reached on Friday, Nov 3, 2017)
Current DAILY +2 Sigma SPX = 2598 with WEEKLY +2 Sigma = 2607
Current DAILY 0 Sigma (20 day MA) SPX = 2574 with WEEKLY 0 Sigma = 2496
Current DAILY -2 Sigma SPX = 2551 with WEEKLY -2 Sigma = 2385
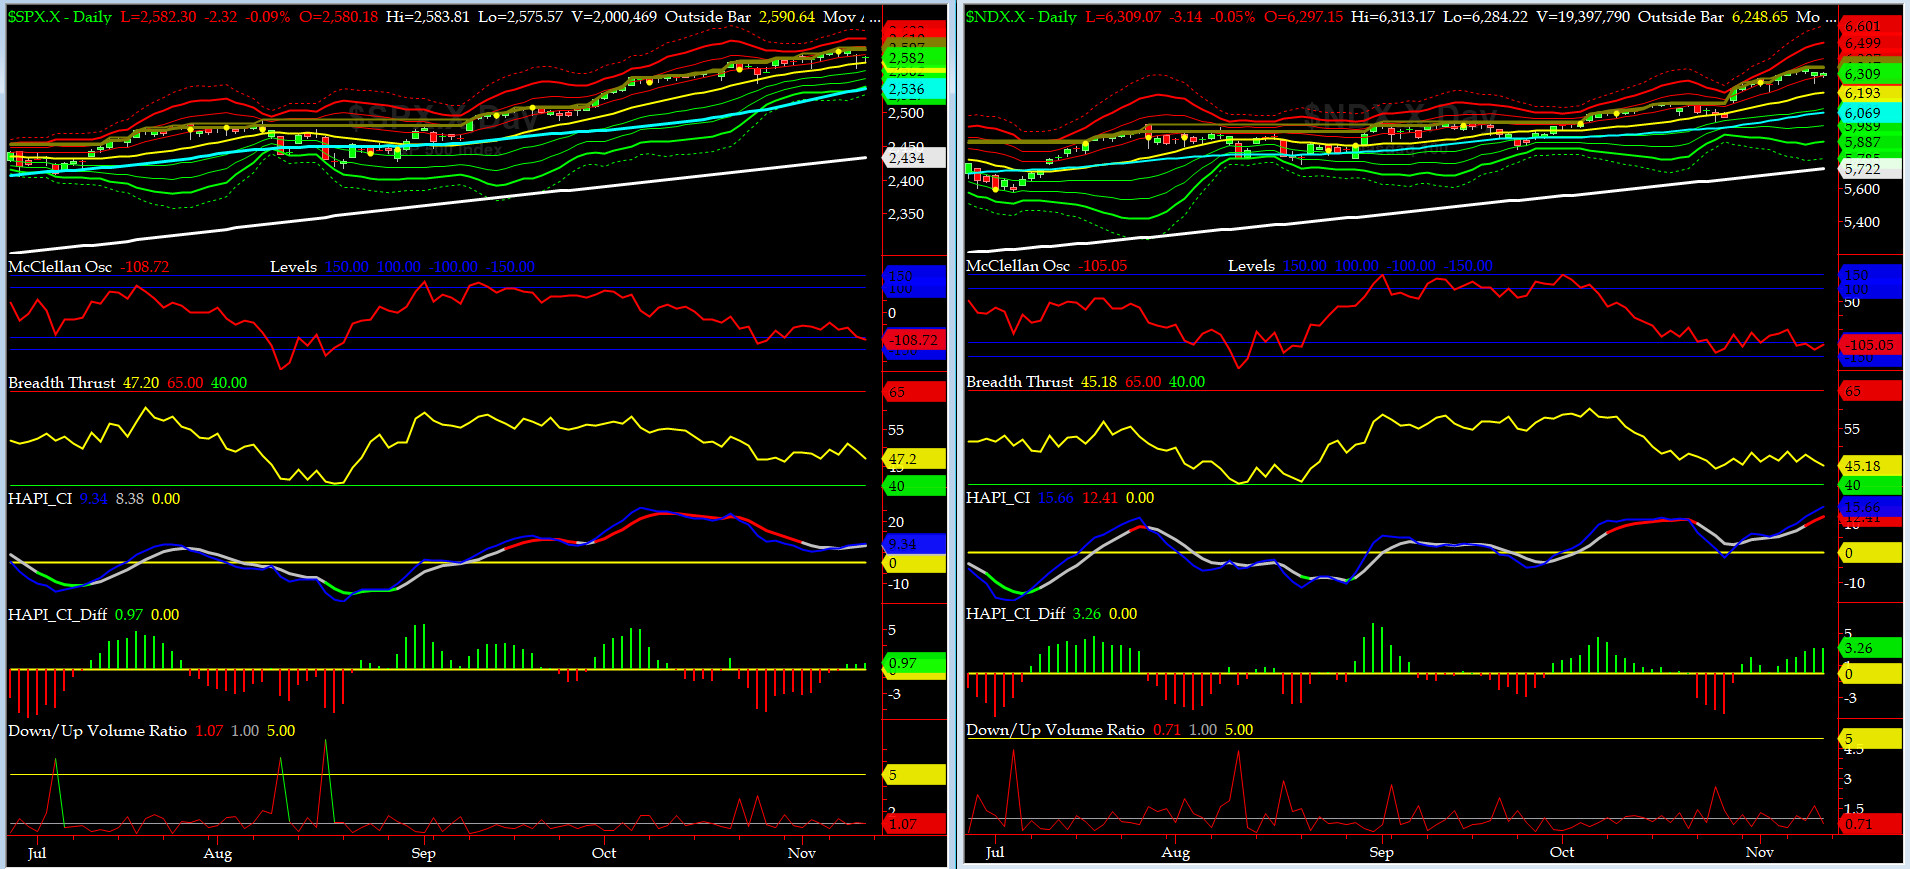
NYSE McClellan Oscillator = -109 (-150 is start of the O/S area; around -275 to -300 area or lower, we go into the �launch-pad� mode, over +150, we are in O/B area)
NYSE Breadth Thrust = 47 (40 is considered as oversold and 65 as overbought)
With divergences abound, finally SPX and NDX sold off a tad with little or no catalyst. This week we will/should look for follow-thru or abandon our short bias.
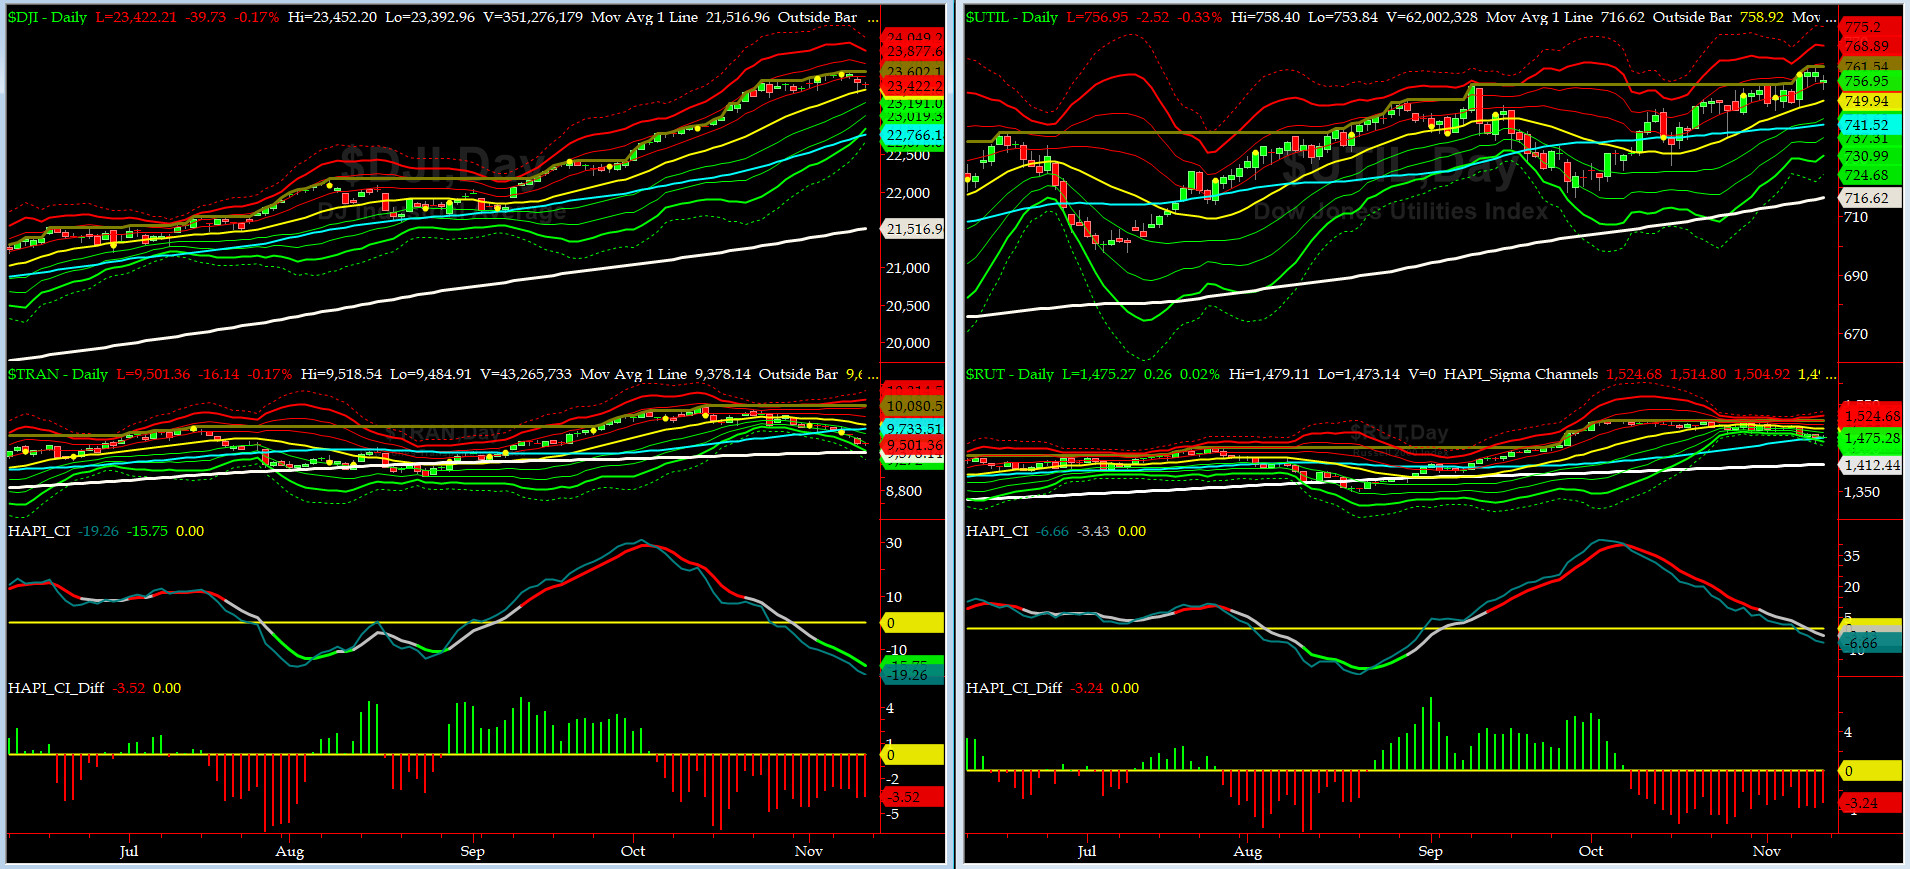
Canaries [in the Coal Mine] Chart for DJ TRAN & RUT Indices
200-Day MA DJ TRAN = 9378 or 1.3% above DJ TRAN (max observed in last 7 yrs = 20.2%, min = -20.3%)
200-Day MA RUT = 1412 or 4.4% above RUT (max observed in last 7 yrs = 21.3%, min = -22.6%)
DJ Transportation Index (proxy for economic conditions 6 to 9 months hence) continued to sell hard this past week (putting in 10 daily red bars in a row), cutting thru 50day MA and finally may start to impact the overall sentiment. A test of its 200day MA should be next.
Russell 2000 Small Caps Index (proxy for Risk ON/OFF) sold off hard on Tuesday and by the end of the week, managed to rest at its 50day MA. RISK is still ON but we should look for a test of 200day MA at 1412s.
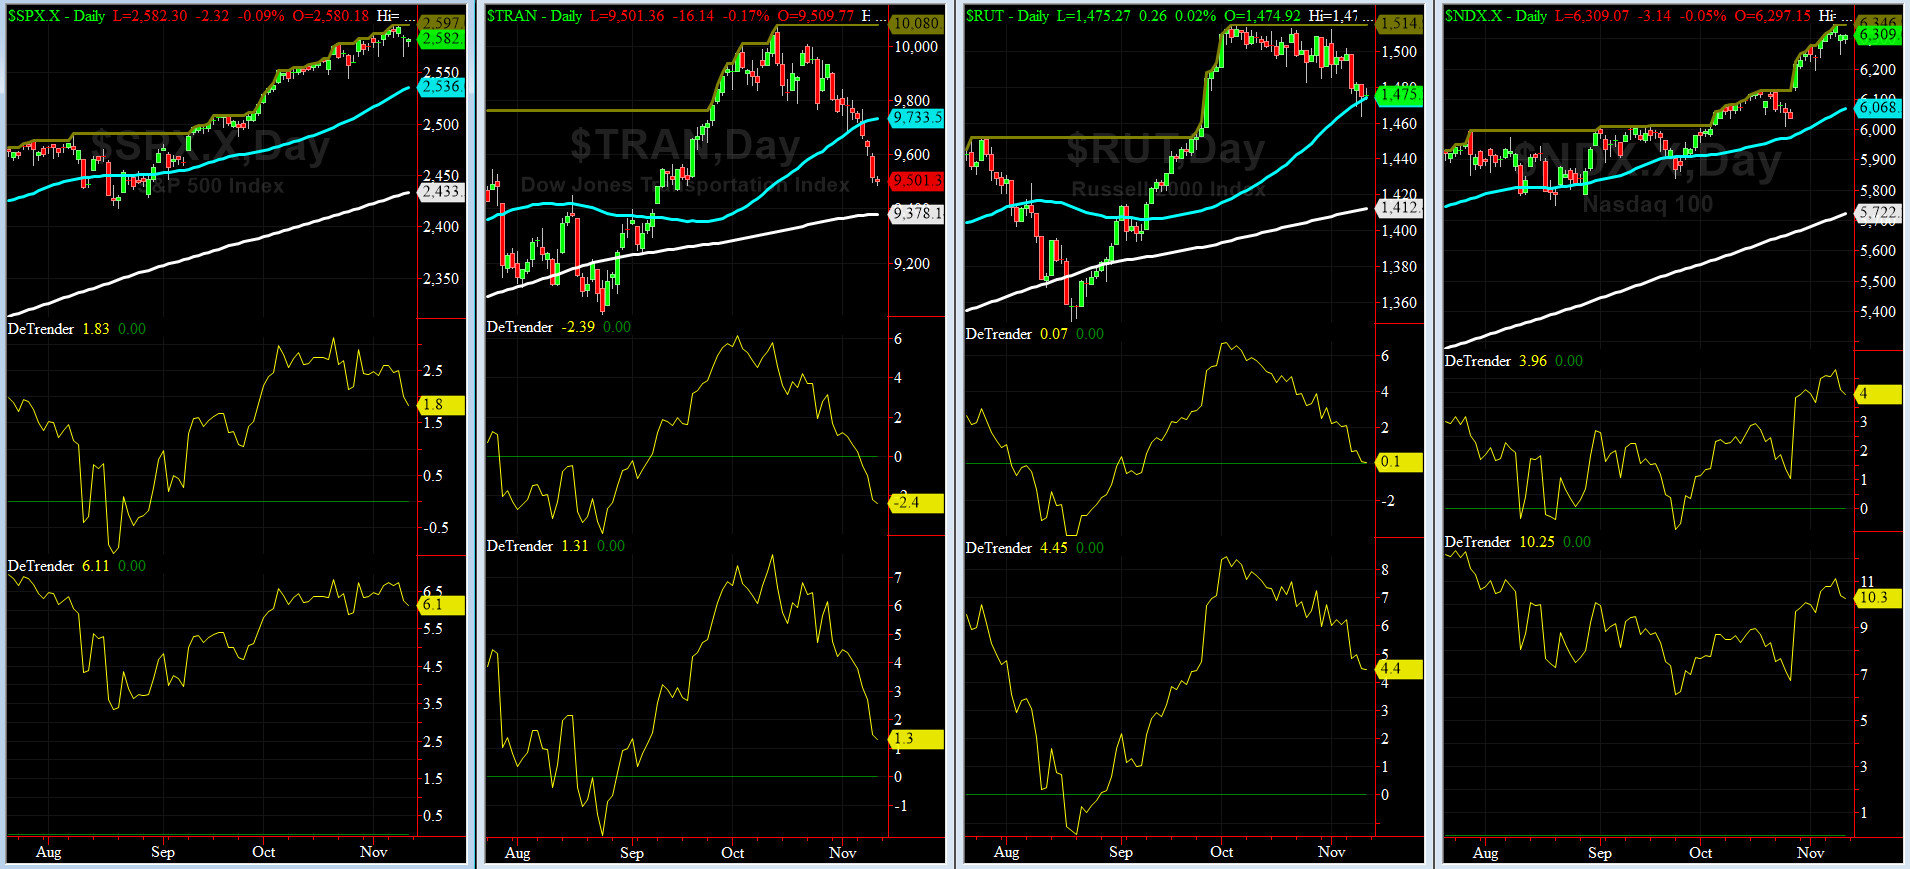
DeTrenders Charts for SPX, NDX, TRAN & RUT Indices
50-Day MA SPX = 2536 or 1.8% below SPX (max observed in last 7 yrs = +8.6%, min = -9.3%)
200-Day MA SPX = 2433 or 6.1% below SPX (max observed in last 7 yrs = 15.2%, min = -14%)
This week, we have SIX of our EIGHT DeTrenders are POSITIVE, one NEUTRAL and one NEGATIVE. The DeTrenders for DJ Tran & RUT will continue to be harbingers of future price behavior in broad indices.

HA_SP1_Momo Chart
WEEKLY Timing Model = on a BUY Signal since Friday 12/16/16 CLOSE at 2258
DAILY Timing Model = on a BUY Signal since Friday 9/29/17 CLOSE at 2519
Max SPX 52wk-highs reading last week = 59 (over 120-140, the local maxima is in)
Max SPX 52wk-Lows reading last week = 21 (over 40-60, the local minima is in)
HA_SP1 closed near its -1 sigma channels
HA_Momo = -3.6 (reversals most likely occur above +10 or below -10)
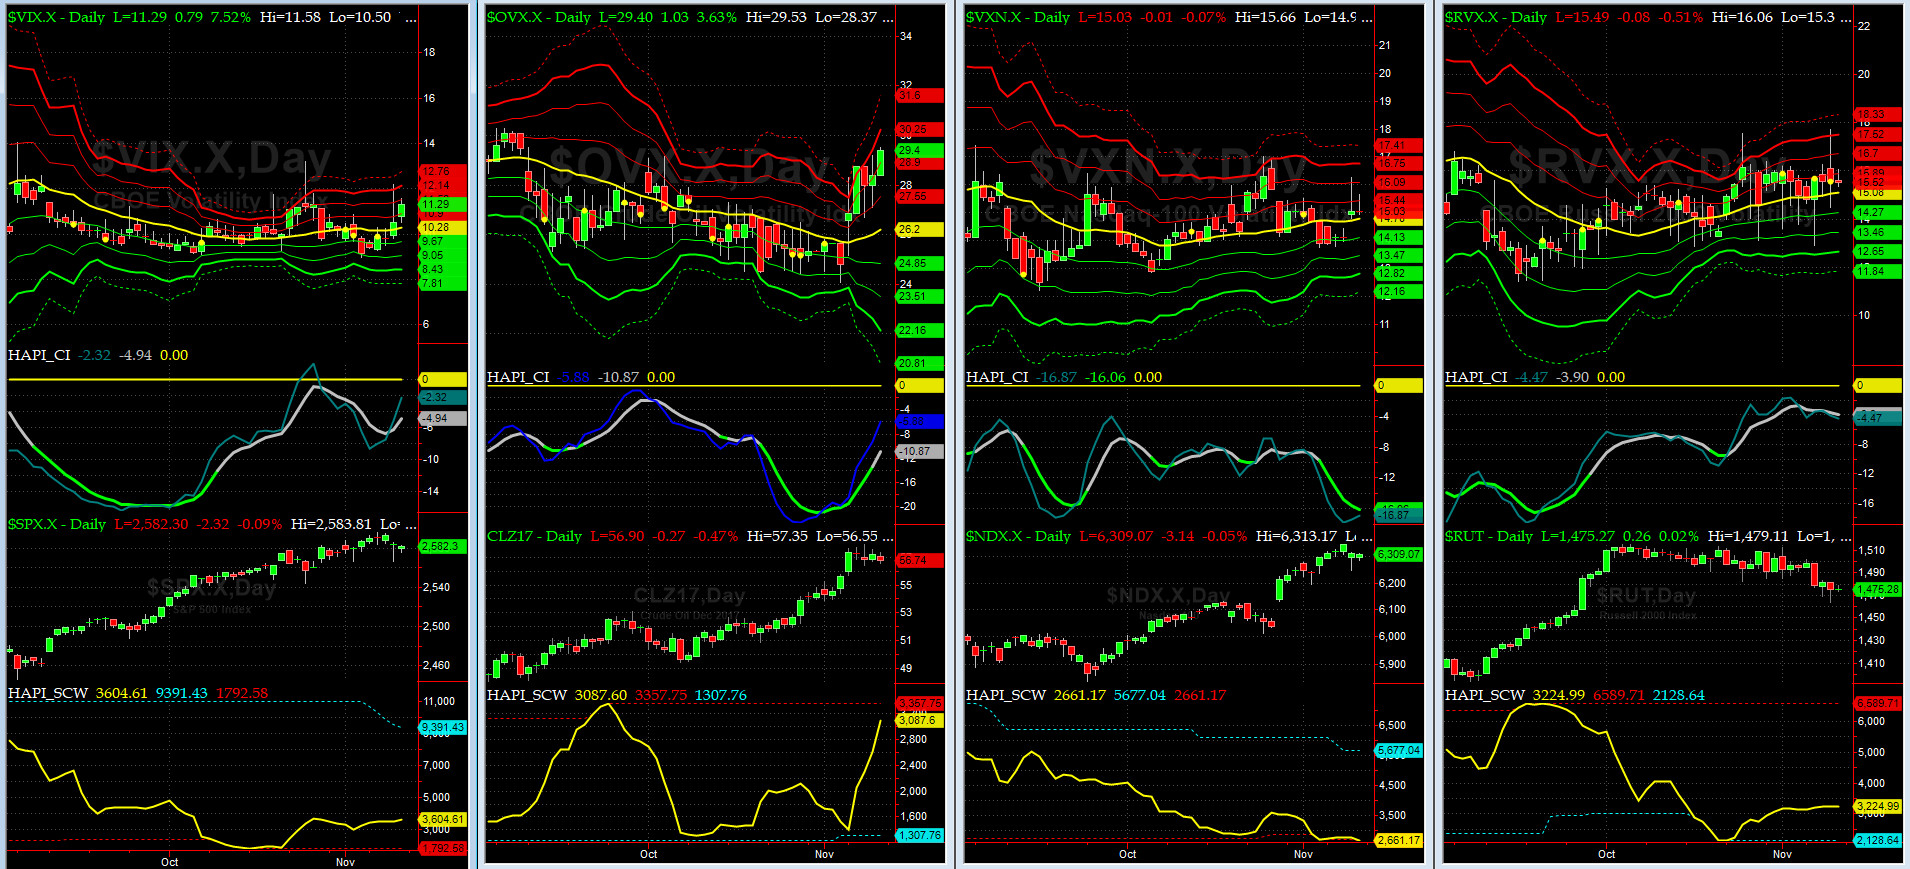
Vol of the Vols Chart
VIX currently stands at 11.3, at about its +2 sigma (remember it's the VIX volatility pattern ( its sigma channels) that matters, and not the level of VIX itself (this is per Dr. Robert Whaley, a great mentor and inventor of original VIX, now called VXO ). VIX usually peaks around a test of its +4 sigma).
Last week, VIX rallied about 4 sigma levels while its CI Crossed Up on Wednesday. The spike that we talked about last week here has arrived. We now need to look for a follow-thru.
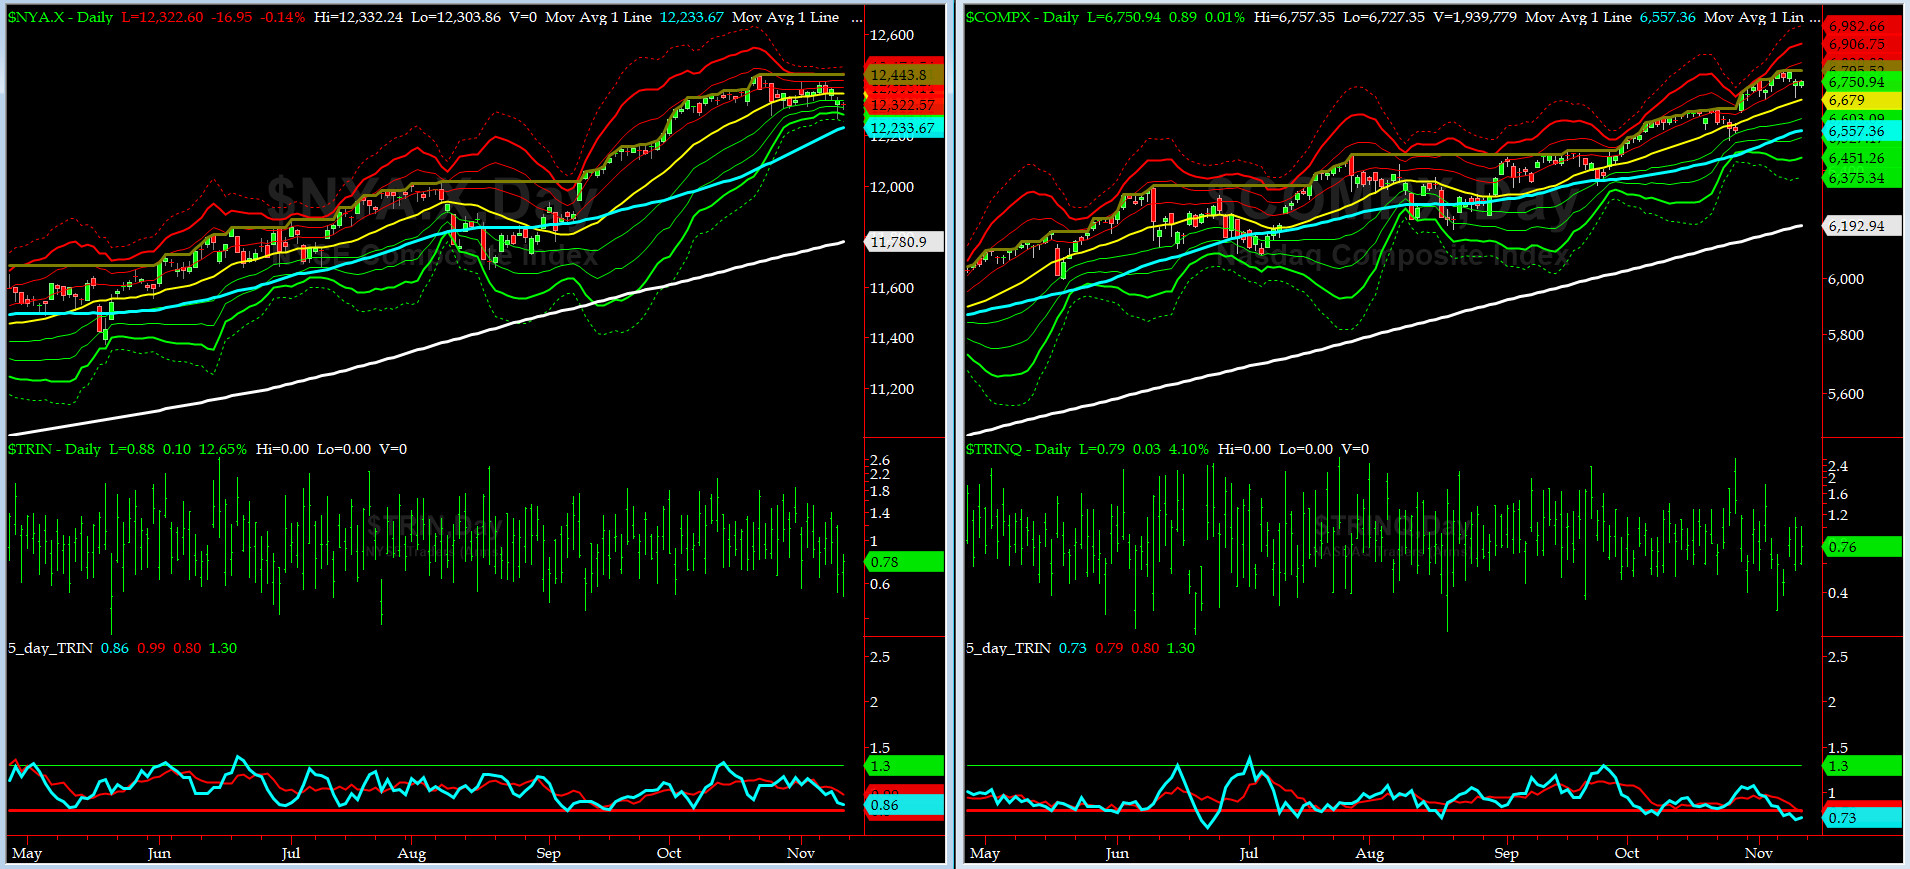
5-day TRIN & TRINQ Charts
NASDAQ 5-day TRIN is clearly in its SELL Zone while NYSE's wants to go there this week.
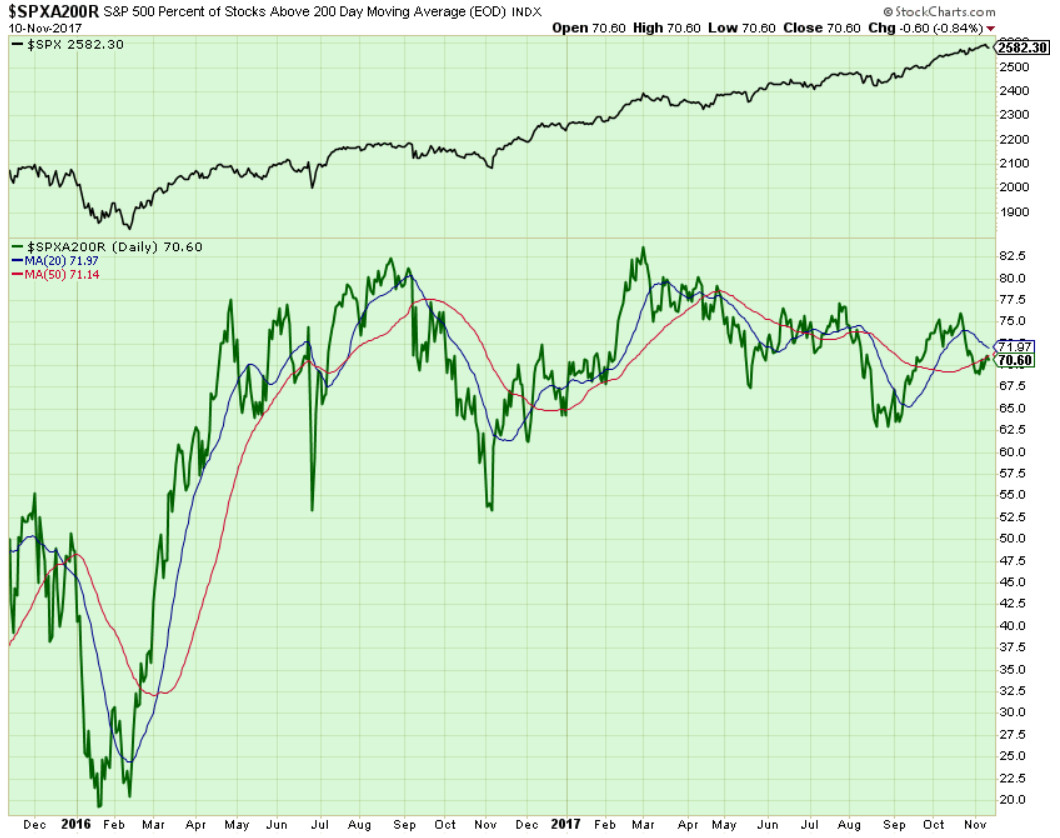
Components of SPX above their respective 200day MA Chart
This scoring indicator while putting in multiple divergences with SPX in the last six months, started to rally a tad and finished over 70%. if our short thesis comes thru this time, we should see this indicator test its 62% to 65% zone and then sink to 50% area. Otherwise, our short thesis is maligned.

SPX SKEW (Tail Risk) Chart
Last week SPX SKEW (Tail Risk) closed at 130.5, or about its -1 sigma (normal = 120-125, range 100-150).
Is all quiet on the Eastern & Mid-Western Fronts? Smart Money thinks YES.
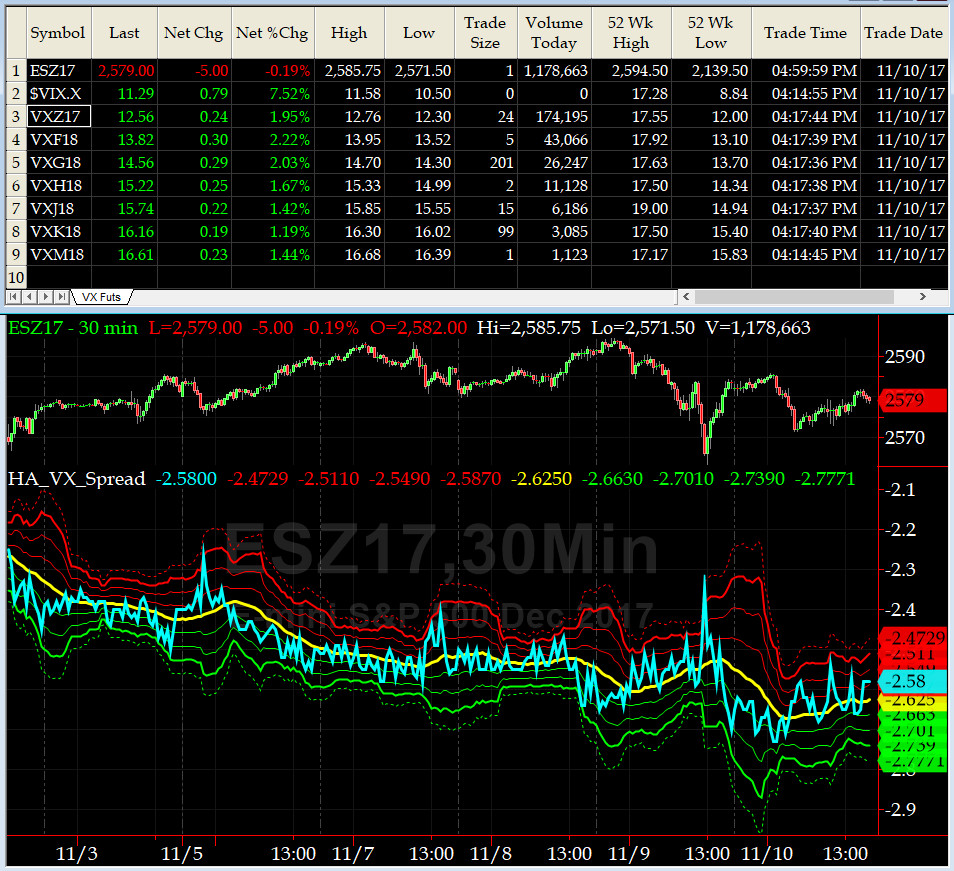
3-month VIX Futures Spread(VX) Chart
This coming week is NOV Options Expiry and our protocol calls for a roll over this past Friday. Thus, we now watch the Long DEC17, Short MAR18 VIX Futures (VX) Spread, which trended higher on Thursday and then went flat again on Friday to close at -2.66. Equity markets are no longer in short-term overbought zone.
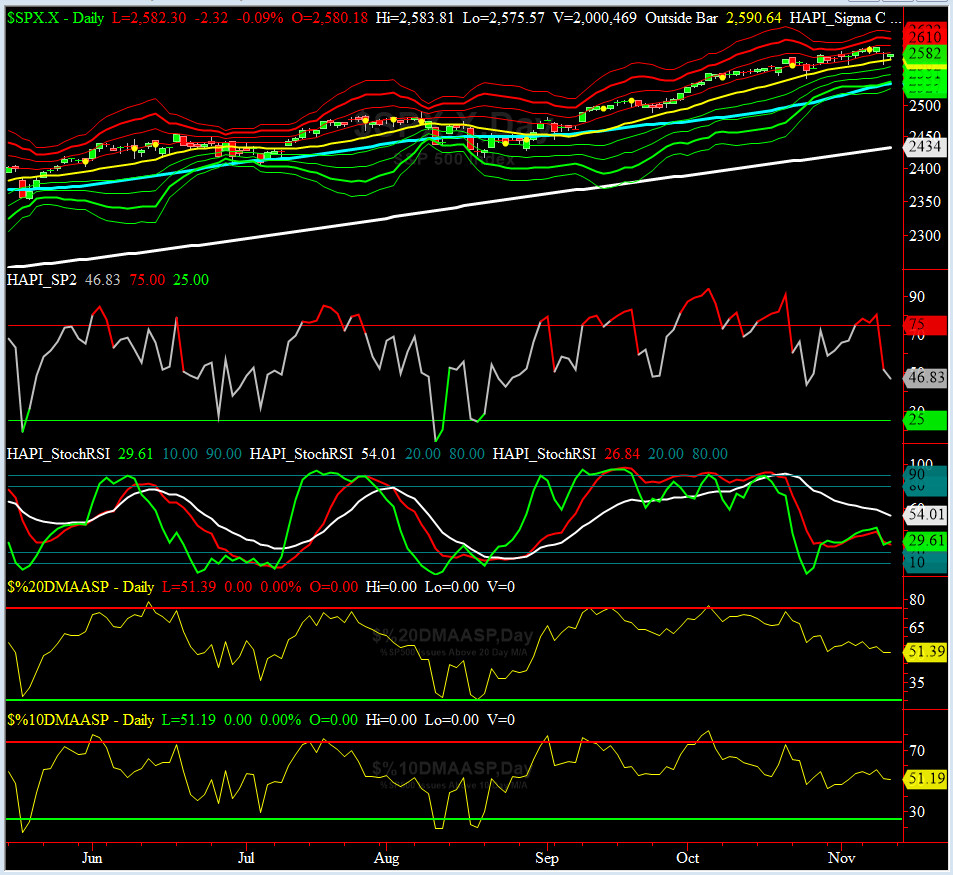
HA_SP2 Chart
HA_SP2 = 46.8 (Buy signal <= 25, Sell Signal >= 75)
Our favorite prop indicator finally sank and when thru 50 mark. Should we see a sub-30 reading, then our short thesis is [at least partially] validated.
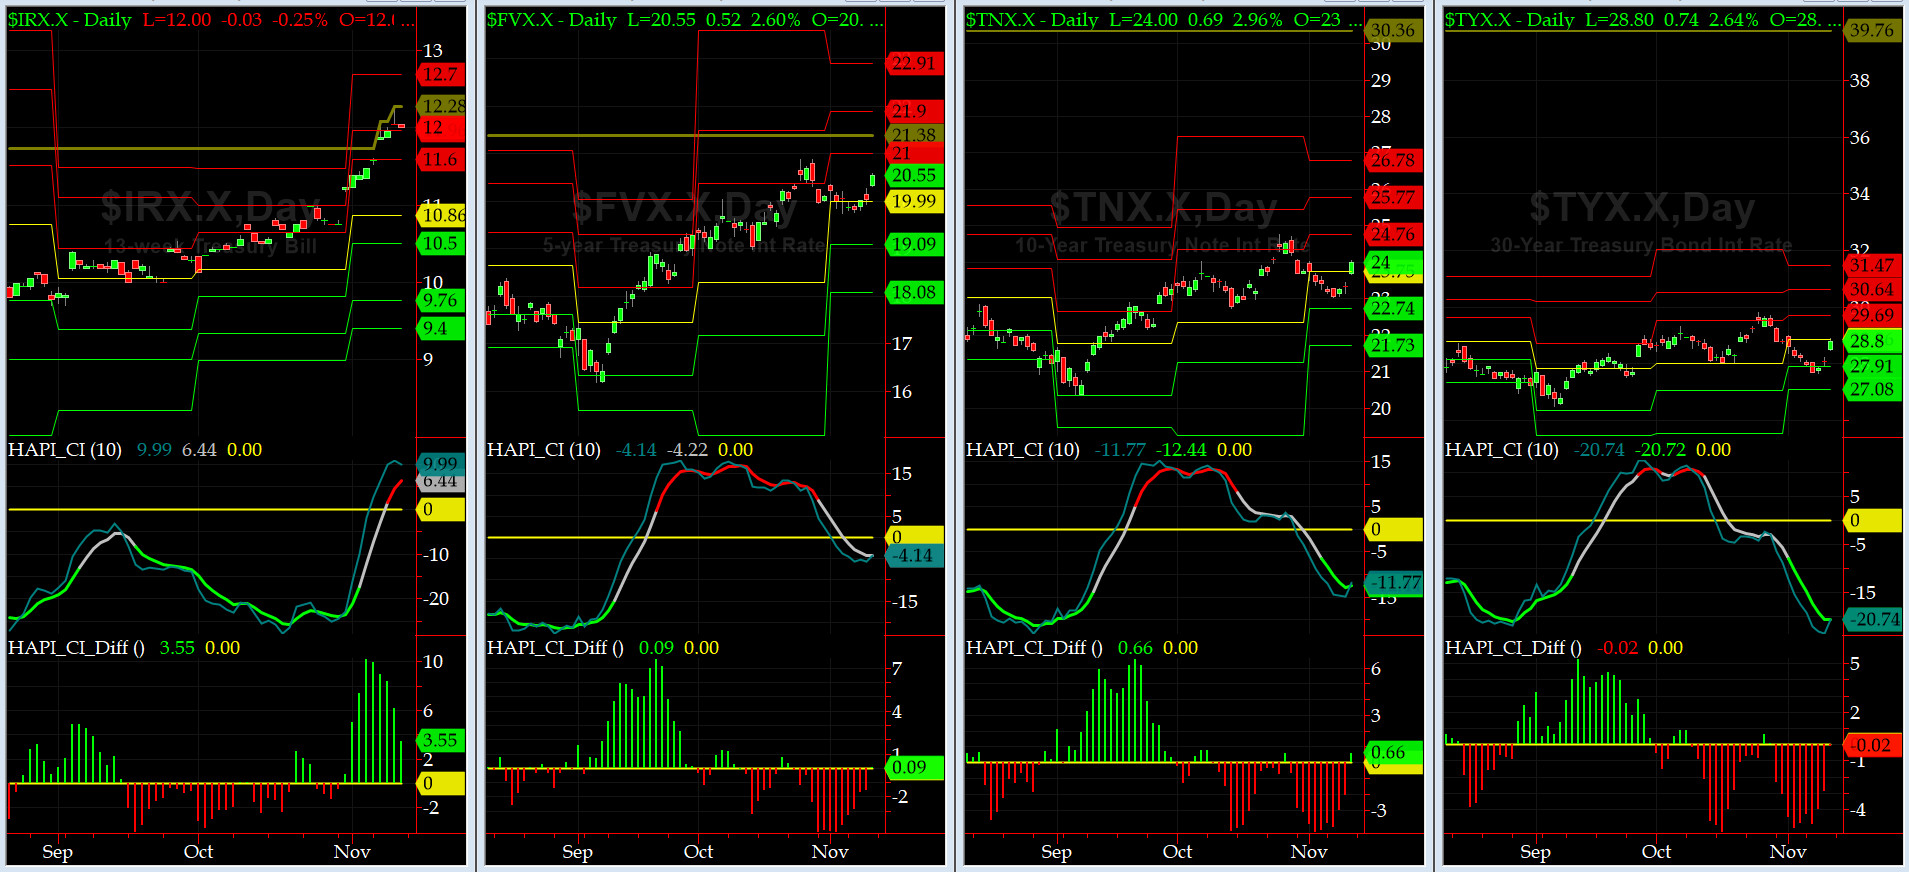
US Treasury T-Notes & T-Bonds Yields Chart
Our Treasury Market sank hard on Friday and reversed the drop in Yields across the Treasury Curve we had see for most of the past week. But the front end of the Yield Curve had another up-tick to 5-year highs. Five Yr Treasury is next (heading to put in new 5-yr high soon).
Fari Hamzei
|


 Proactive Market Timing