|
Sunday, December 3, 2017, 2345ET
Market Timing Charts, Analysis & Commentary for Issue #219
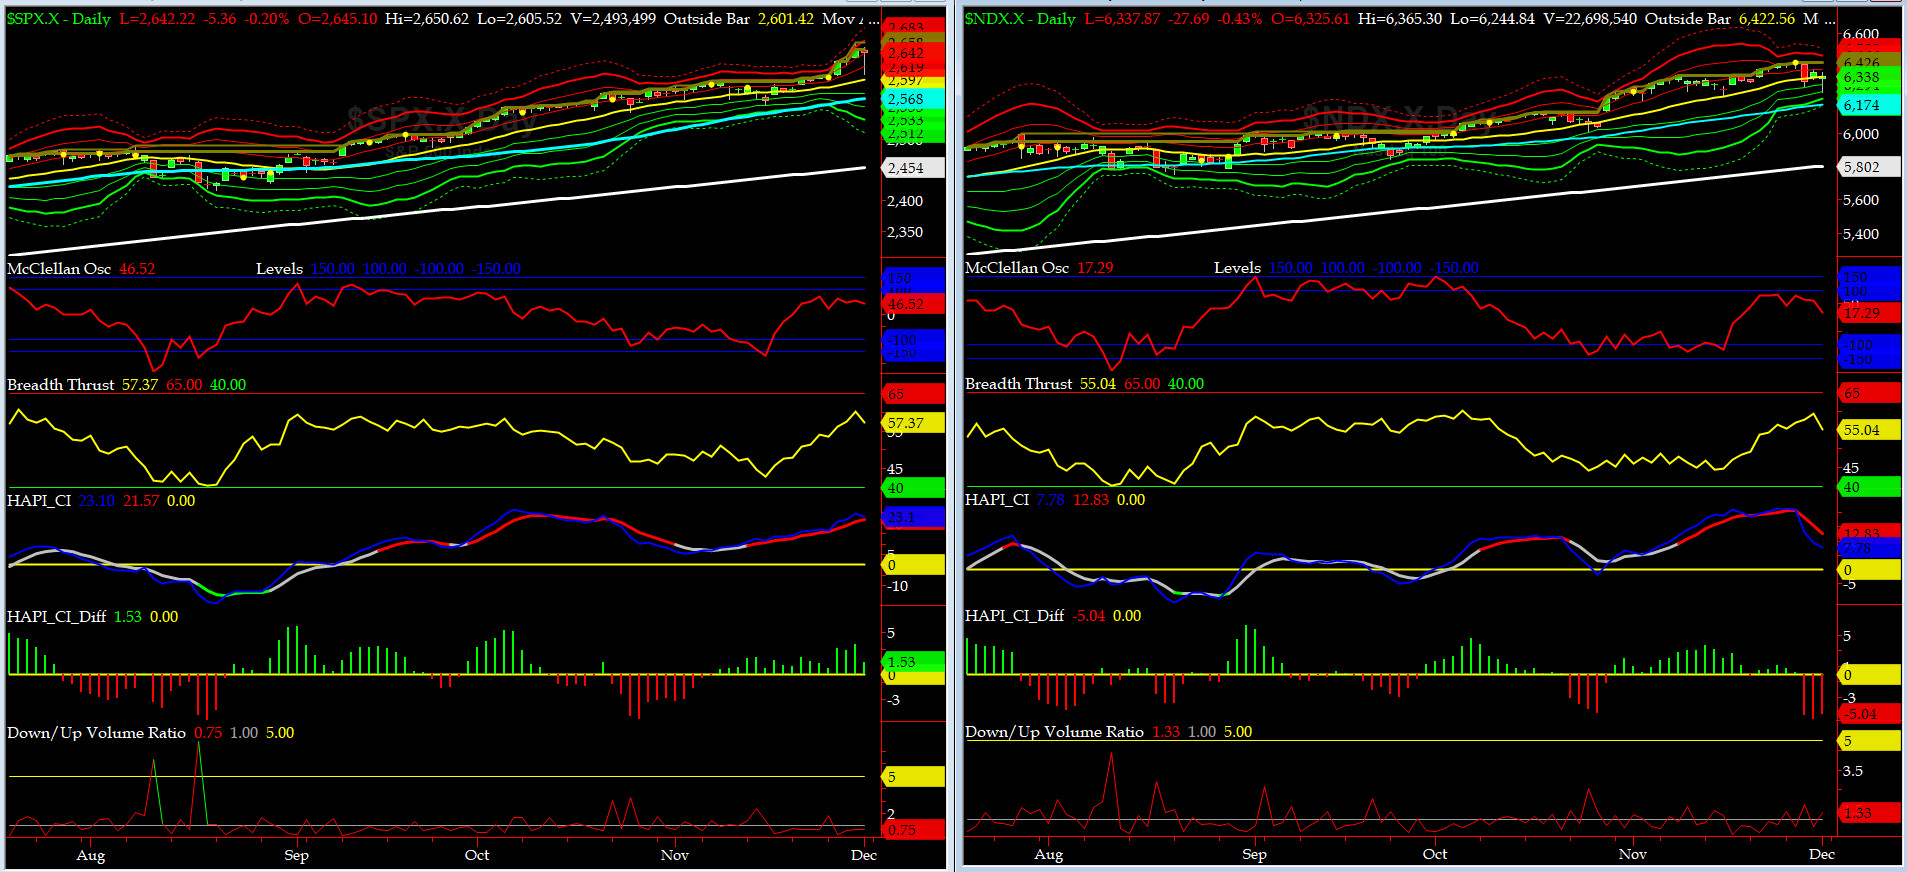
Timer Charts of S&P-500 Cash Index (SPX) + NASDAQ-100 Cash Index (NDX)
Most recent S&P-500 Cash Index (SPX): 2642.22 up +39.80 (up 1.53%) for the week ending on Friday, December 1, 2017, which closed at its +2 sigma.
SPX ALL TIME INTRADAY HIGH = 2657.74 (reached on Thursday, Nov 30, 2017)
SPX ALL TIME CLOSING HIGH = 2647.58 (reached on Thursday, Nov 30, 2017)
Current DAILY +2 Sigma SPX = 2640 with WEEKLY +2 Sigma = 2645
Current DAILY 0 Sigma (20 day MA) SPX = 2597 with WEEKLY 0 Sigma = 2522
Current DAILY -2 Sigma SPX = 2555 with WEEKLY -2 Sigma = 2399
NYSE McClellan Oscillator = +46.5 (-150 is start of the O/S area; around -275 to -300 area or lower, we go into the “launch-pad” mode, over +150, we are in O/B area)
NYSE Breadth Thrust = 57.4 (40 is considered as oversold and 65 as overbought)
News from Washington is good & bad. Each time the vols spike, everyone [& his brother] buys the dips. This shall work until it doesn't. Stay focused sailor......
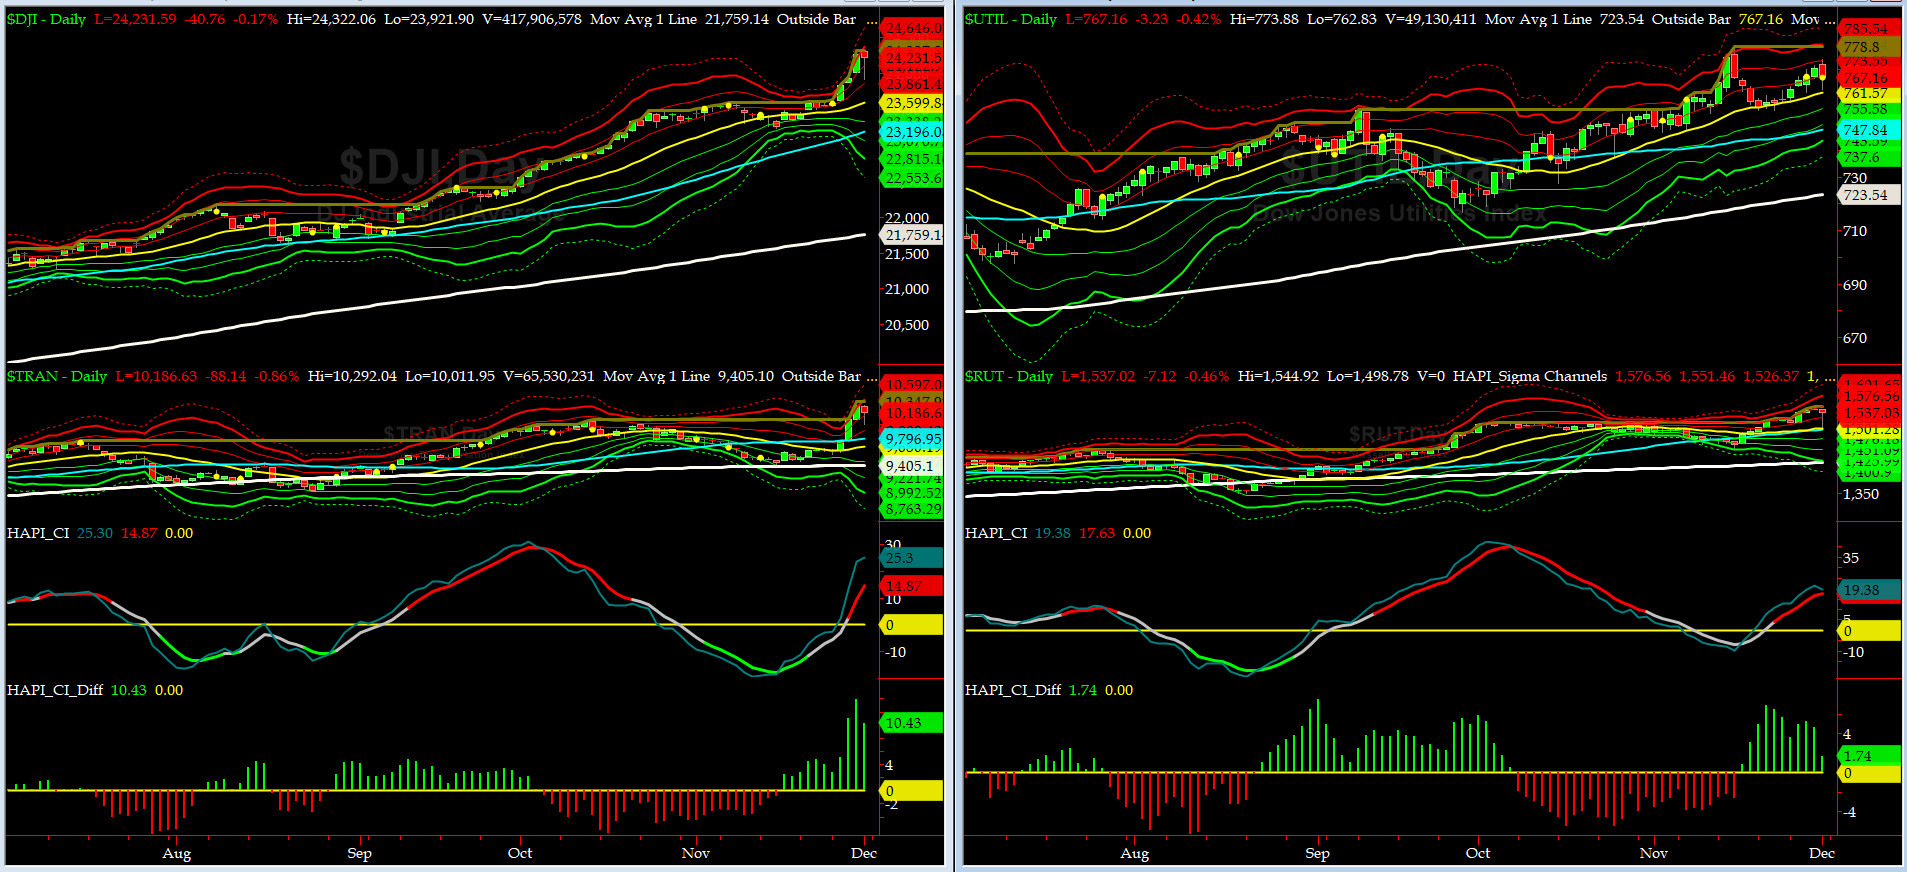
Canaries [in the Coal Mine] Chart for DJ TRAN & RUT Indices
200-Day MA DJ TRAN = 9405 or 8.3% above DJ TRAN (max observed in last 7 yrs = 20.2%, min = -20.3%)
200-Day MA RUT = 1421 or 8.1% above RUT (max observed in last 7 yrs = 21.3%, min = -22.6%)
DJ Transportation Index (proxy for economic conditions 6 to 9 months hence) put in her best performance in months with massive ascend on Tuesday thru Thursday of last week. Truly impressive. As we have mentioned here before, huge bars have to respected.
Russell 2000 Small Caps Index (proxy for Risk ON/OFF) also rallied very nicely on said days but it was no DJ TRAN. RISK is definitely ON again.
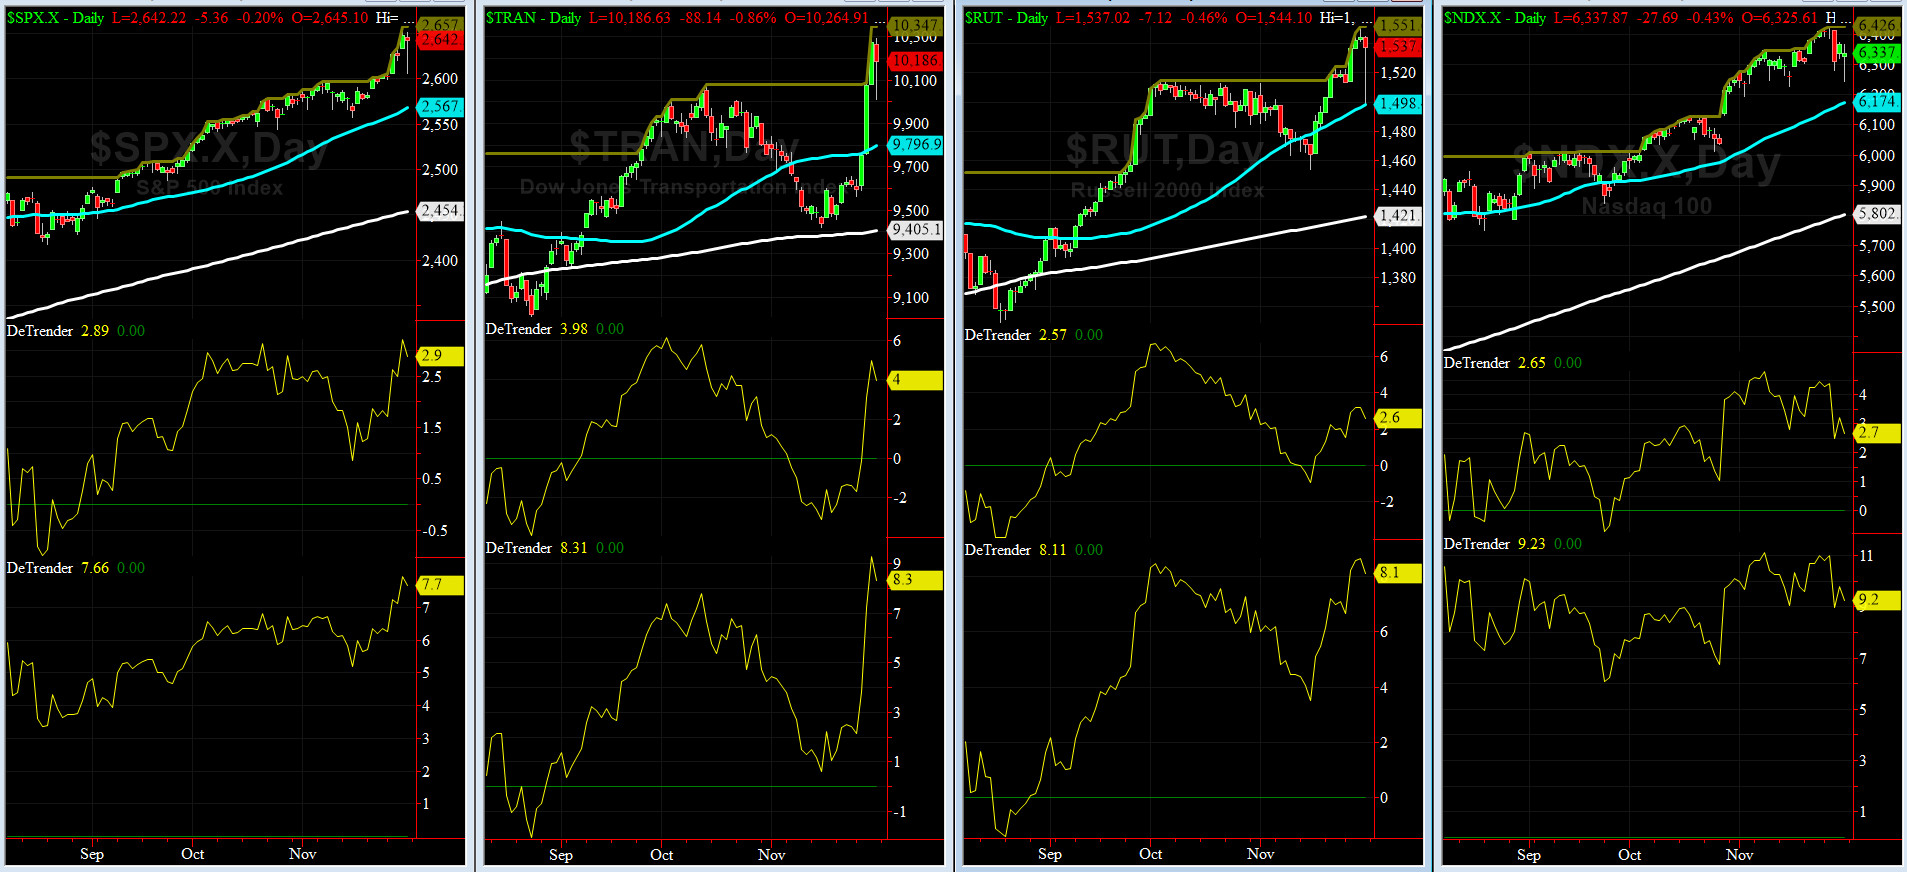
DeTrenders Charts for SPX, NDX, TRAN & RUT Indices
50-Day MA SPX = 2567 or 2.9% below SPX (max observed in last 7 yrs = +8.6%, min = -9.3%)
200-Day MA SPX = 2454 or 7.7% below SPX (max observed in last 7 yrs = 15.2%, min = -14%)
All of our EIGHT DeTrenders are in POSITIVE territory. The DeTrenders for DJ Tran & RUT will continue to be harbingers of future price behavior in broad indices.

HA_SP1_Momo Chart
WEEKLY Timing Model = on a BUY Signal since Friday 12/16/16 CLOSE at 2258
DAILY Timing Model = on a BUY Signal since Wednesday 11/22/17 CLOSE at 2597
Max SPX 52wk-highs reading last week = 119 (over 120-140, the local maxima is in)
Max SPX 52wk-Lows reading last week = 2 (over 40-60, the local minima is in)
HA_SP1 closed near its +2 sigma channels
HA_Momo = +2.8 (reversals most likely occur above +10 or below -10)
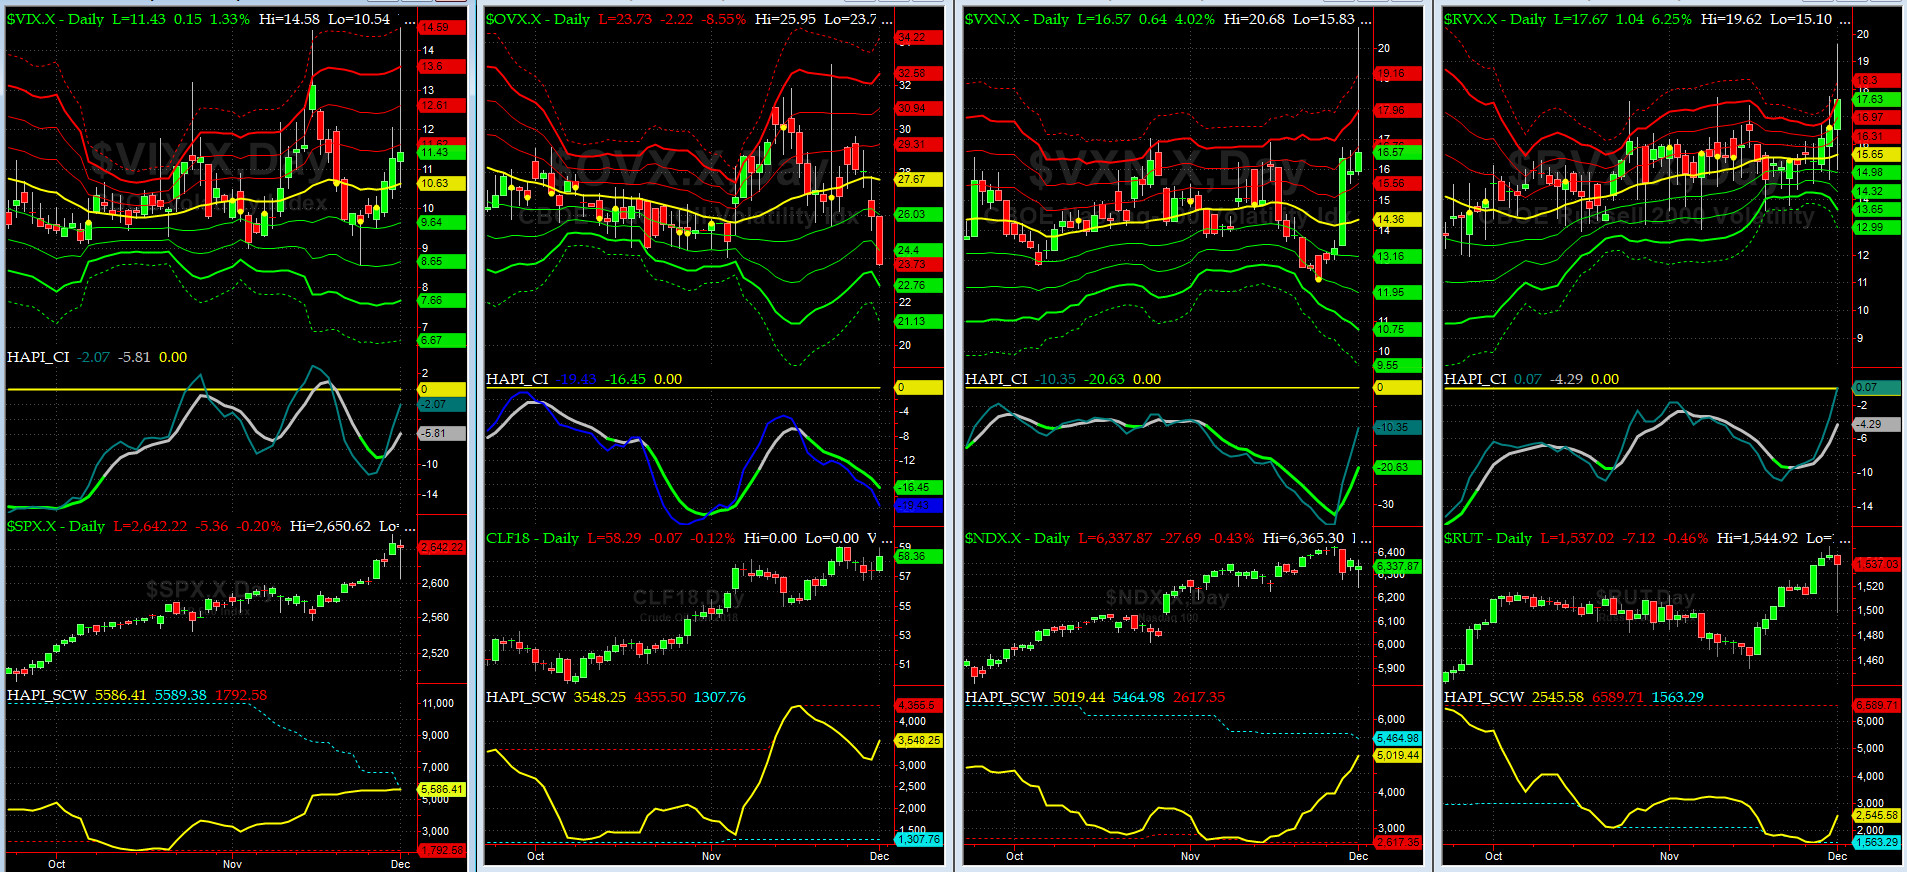
Vol of the Vols Chart
VIX currently stands at 11.43, at about its +1 sigma (remember it's the VIX volatility pattern ( its sigma channels) that matters, and not the level of VIX itself (this is per Dr. Robert Whaley, a great mentor and inventor of original VIX, now called VXO ). VIX usually peaks around a test of its +4 sigma).
Just when we thought that another vol shockwave is over & CBOE might need a GoFundMe page, on Friday December 1st, VIX put in its most massive day with its options volume soaring over 3 mil contracts a new ATH.

5-day TRIN & TRINQ Charts
NYSE 5-day TRIN is in the SELL zone.
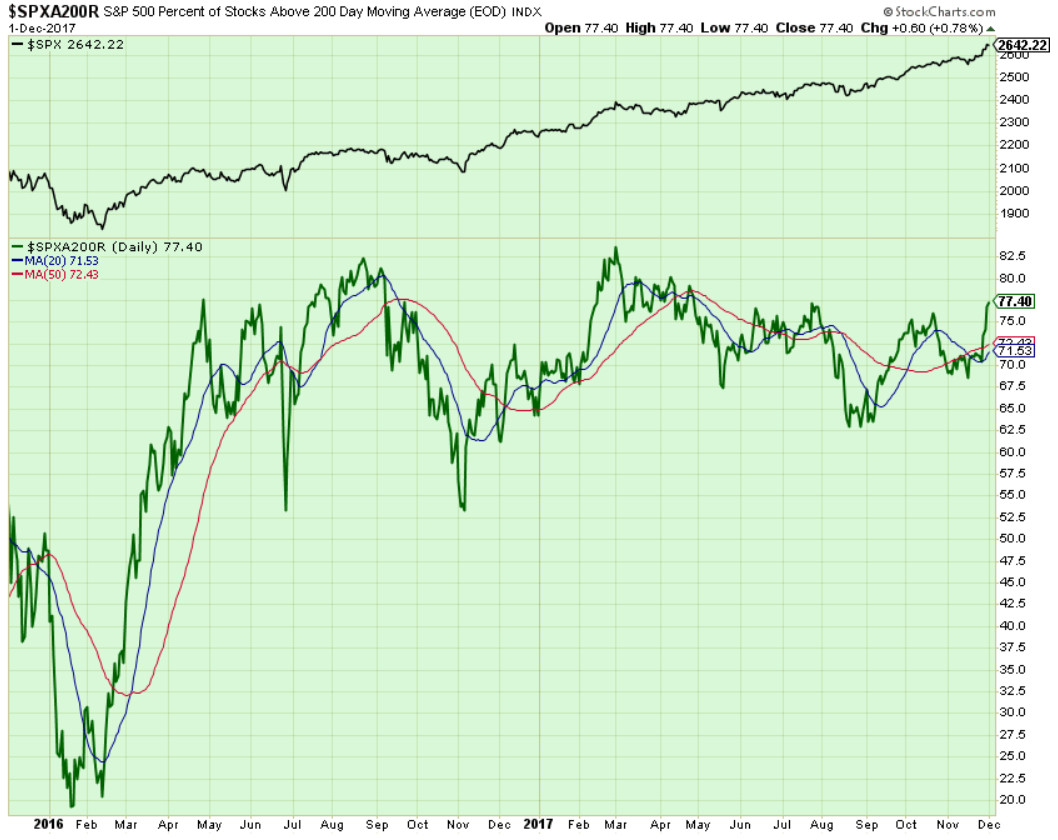
Components of SPX above their respective 200day MA Chart
This scoring indicator had a strong week and tested 77.5% area. As as the result, we expect higher prices in SPX shortly.
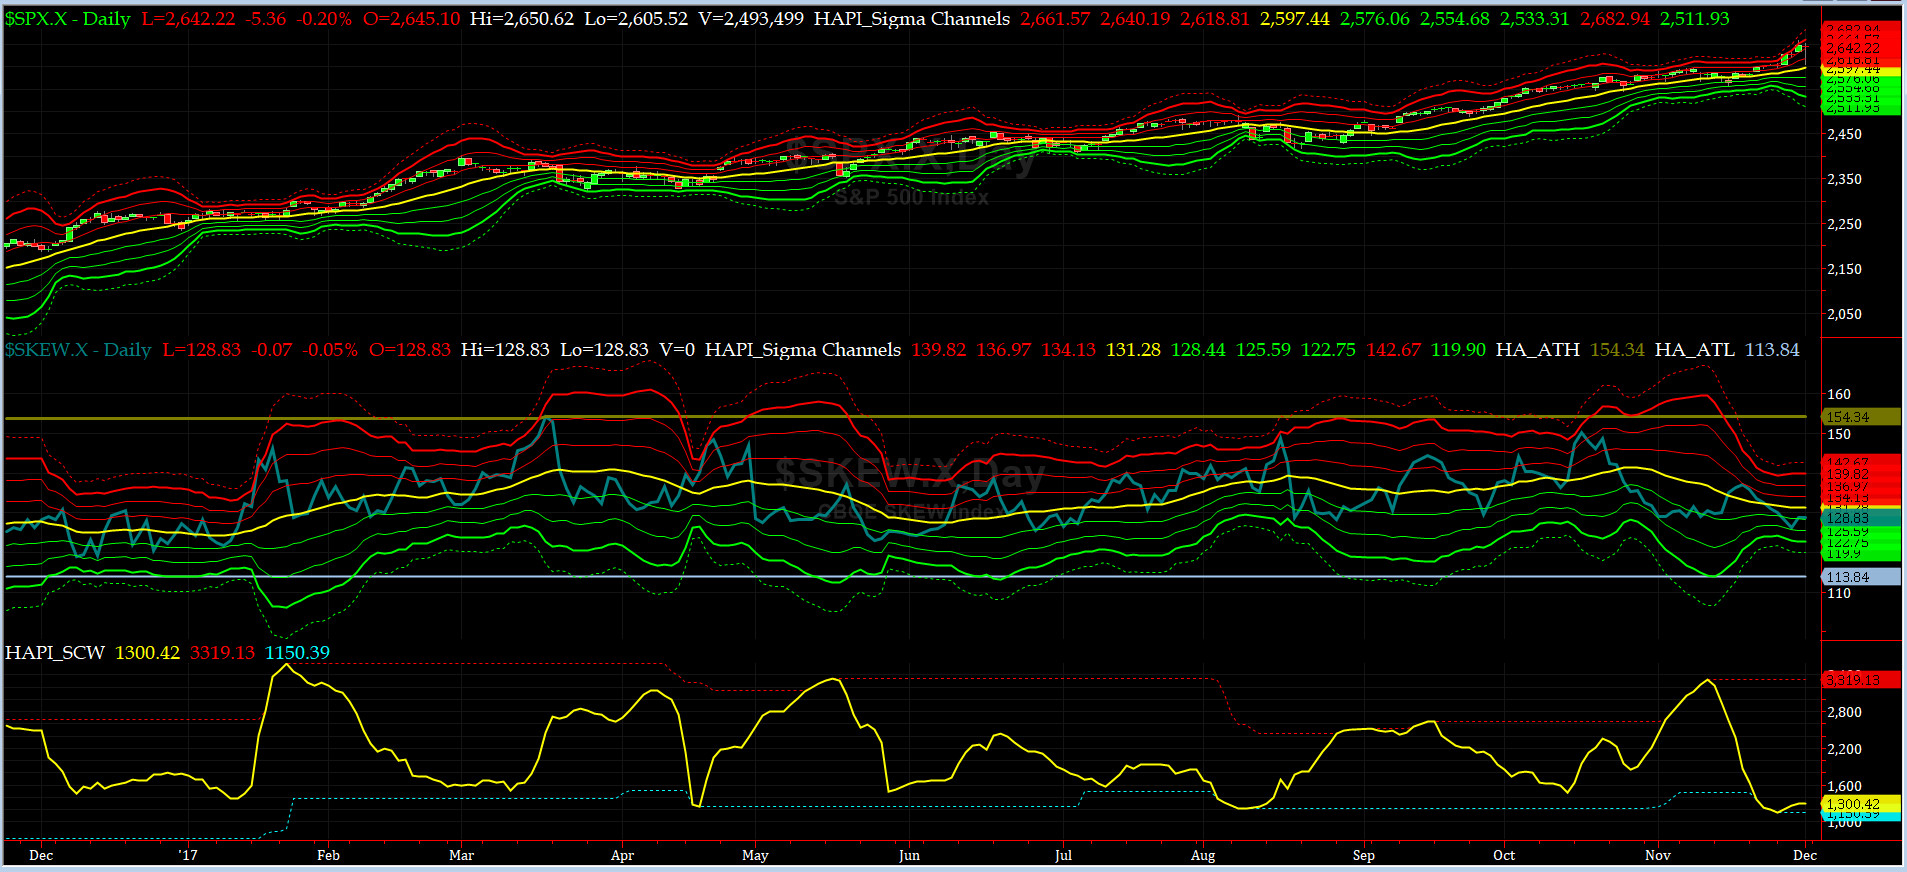
SPX SKEW (Tail Risk) Chart
Last week SPX SKEW (Tail Risk) closed at ~129, or about its zero sigma (normal = 120-125, range 100-150).
Is all quiet on the Eastern & Mid-Western Fronts? Smart Money thinks YES.
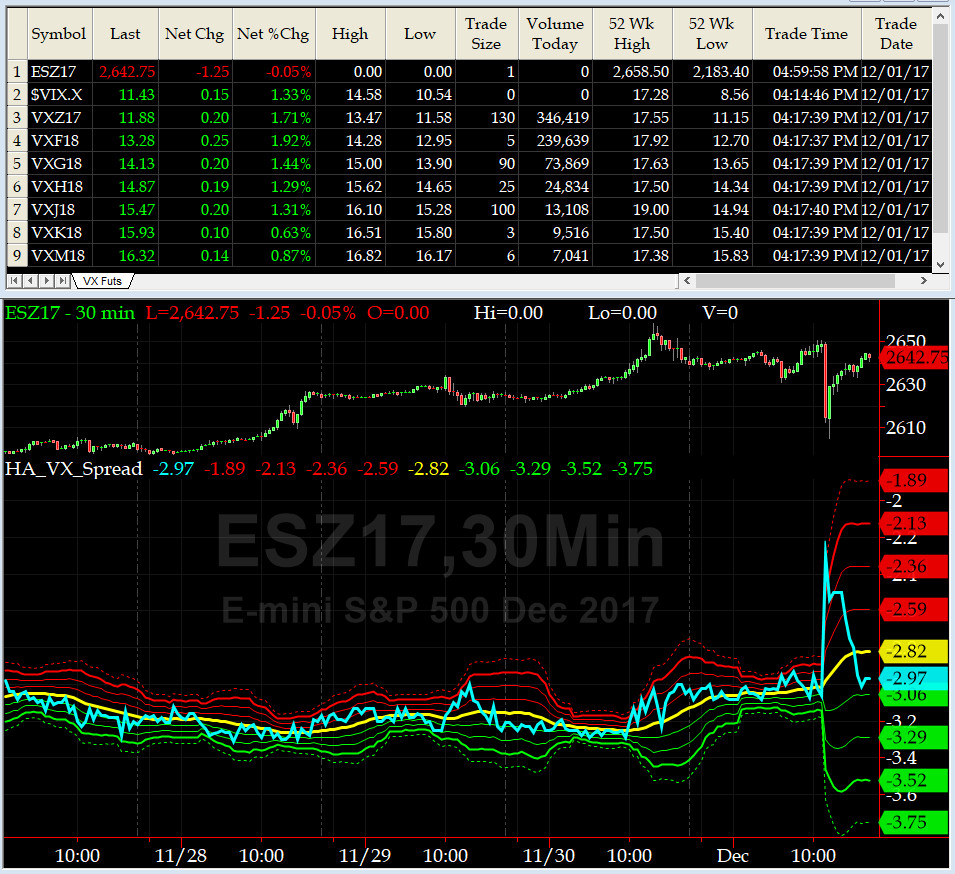
3-month VIX Futures Spread(VX) Chart
Oh what a day this timing indicator had on Friday before closing at -2.97. Equity markets are still in short-term overbought zone.
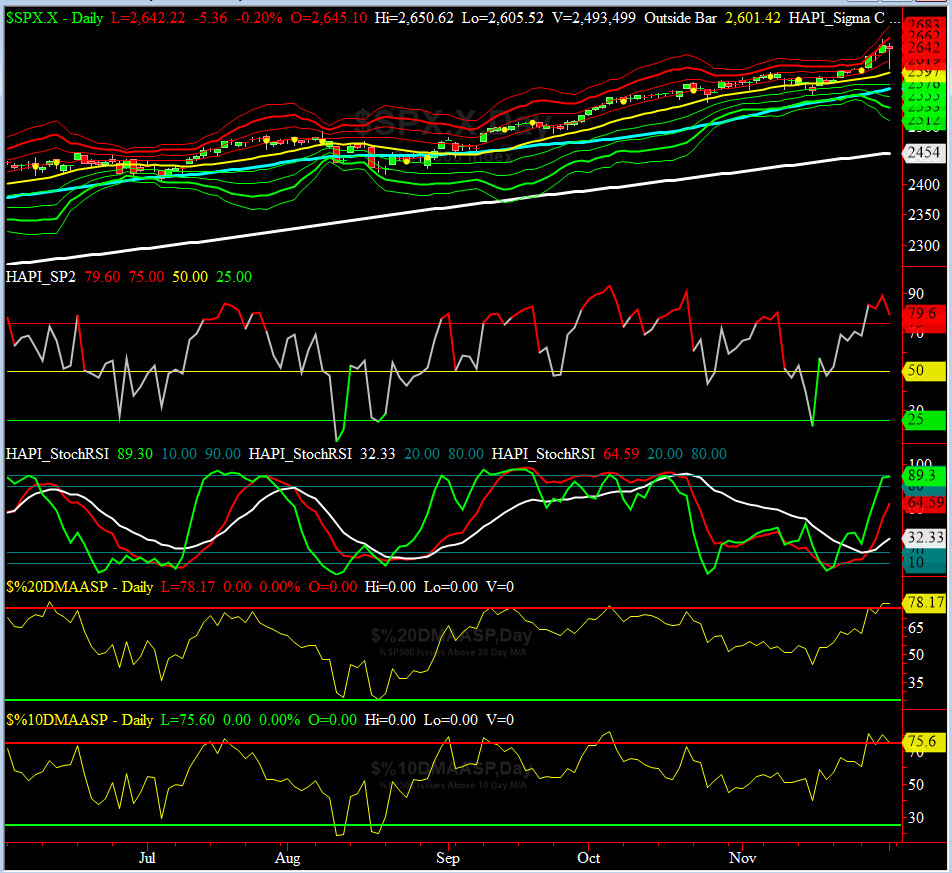
HA_SP2 Chart
HA_SP2 = 79.6 (Buy signal <= 25, Sell Signal >= 75)
On Thursday, SP2 closed at ~89.4 and thus we went short SPX with TD. Little we knew that we shall drop more than 1%., intraday, the very next day.
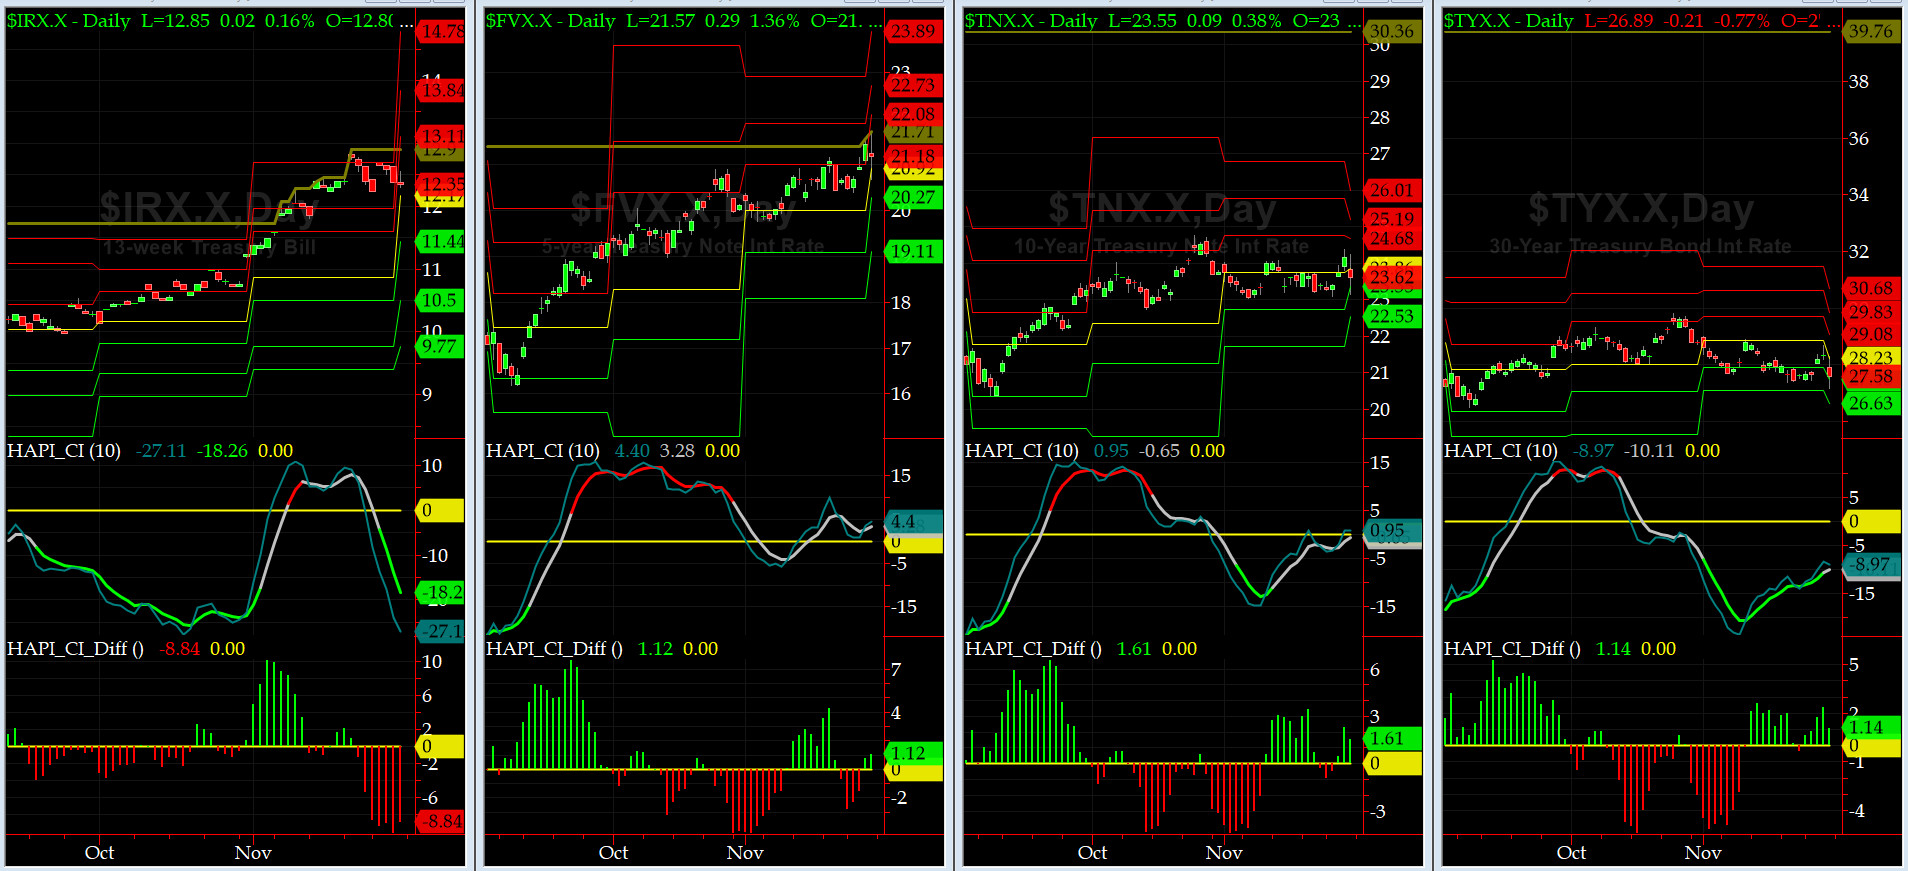
US Treasury T-Notes & T-Bonds Yields Chart
This past week, again our Treasury Market went nowhere fast as evidenced by sideway action in YTMs.
Fari Hamzei
|


 Proactive Market Timing


