|
Tuesday, January 2, 2018, 0915ET
Market Timing Charts, Analysis & Commentary for Issue #222

Timer Charts of S&P-500 Cash Index (SPX) + NASDAQ-100 Cash Index (NDX)
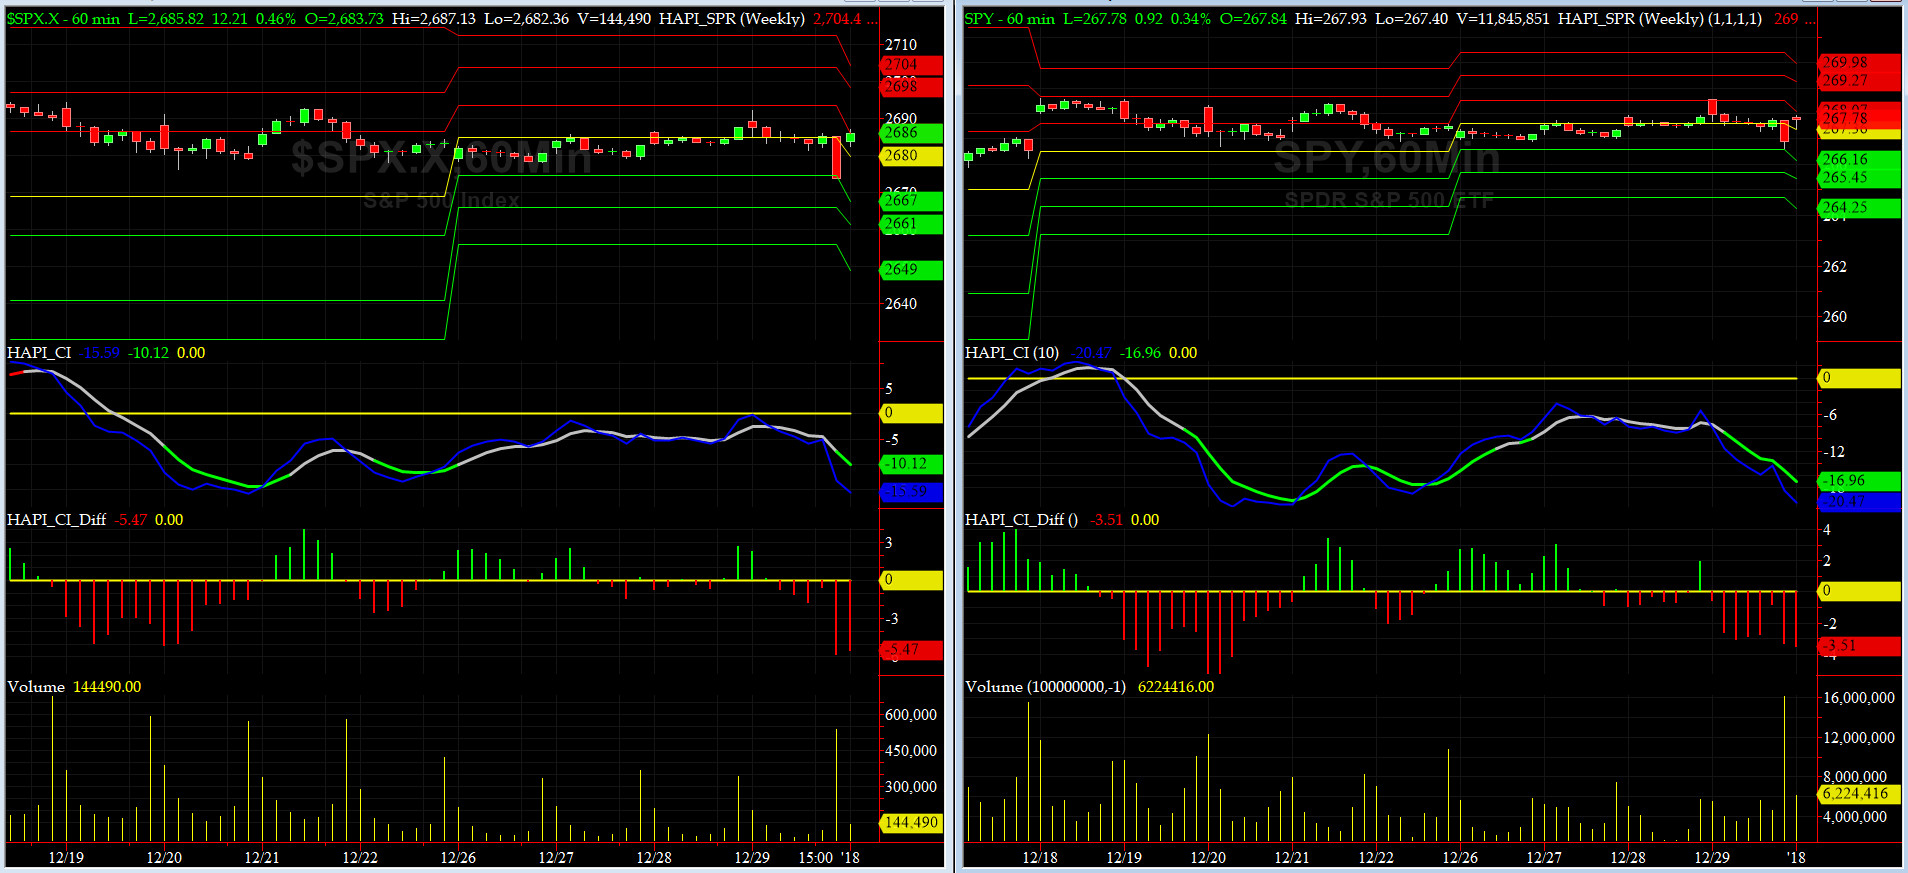
Most recent S&P-500 Cash Index (SPX): 2673.61 down -2.2 (down -0.08%) for two weeks ending on Friday, December 29, 2017, which closed near its zero sigma.
SPX ALL TIME INTRADAY HIGH = 2694.97 (reached on Monday, Dec 18, 2017)
SPX ALL TIME CLOSING HIGH = 2690.16 (reached on Monday, Dec 18, 2017)
Current DAILY +2 Sigma SPX = 2704 with WEEKLY +2 Sigma = 2717
Current DAILY 0 Sigma (20 day MA) SPX = 2664 with WEEKLY 0 Sigma = 2563
Current DAILY -2 Sigma SPX = 2624 with WEEKLY -2 Sigma = 2410
NYSE McClellan Oscillator = +14.6 (-150 is start of the O/S area; around -275 to -300 area or lower, we go into the �launch-pad� mode, over +150, we are in O/B area)
NYSE Breadth Thrust = 55.3(40 is considered as oversold and 65 as overbought)
After two weeks of very tiny range, SPX dropped off hard on Friday during the last hour, most likely due to the news from Iran.
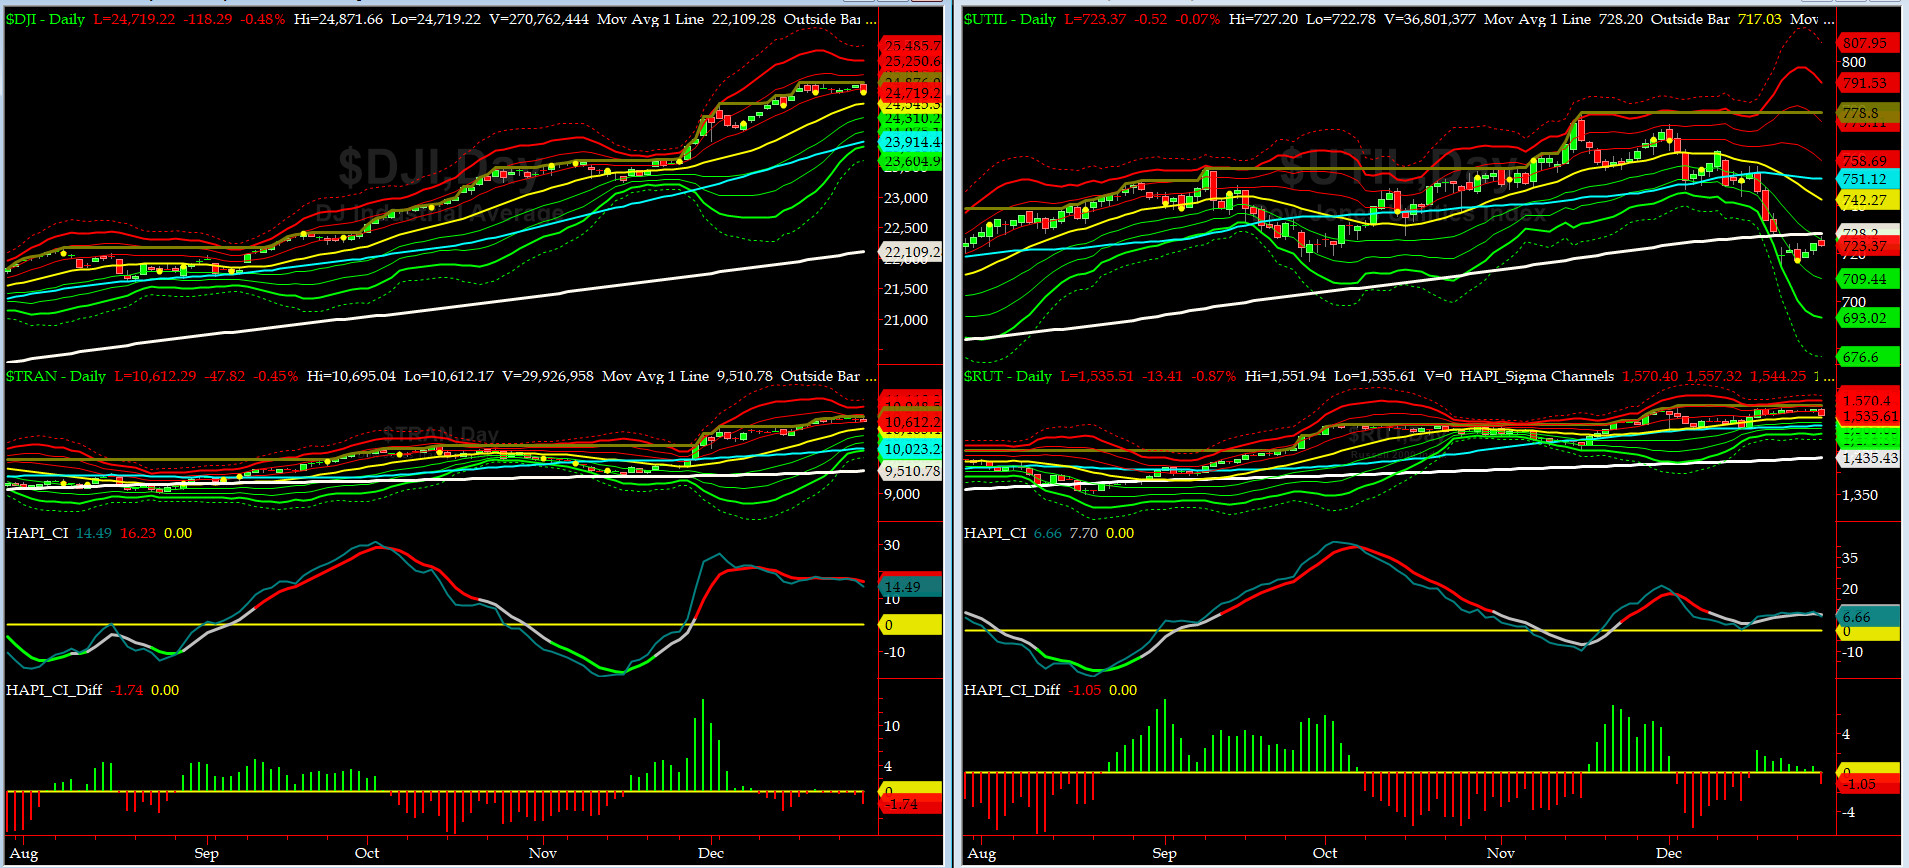
Canaries [in the Coal Mine] Chart for DJ TRAN & RUT Indices
200-Day MA DJ TRAN = 9510 or 11.6 above DJ TRAN (max observed in last 7 yrs = 20.2%, min = -20.3%)
200-Day MA RUT = 1435 or 7% above RUT (max observed in last 7 yrs = 21.3%, min = -22.6%)
DJ Transportation Index (proxy for economic conditions 6 to 9 months hence) went sideways this past week. Alarming? not yet, but if it continues, then our answer is YES.
Russell 2000 Small Caps Index (proxy for Risk ON/OFF) sold off hard on Friday. RISK is definitely still ON.
All of our EIGHT DeTrenders are in POSITIVE territory. The DeTrenders for DJ Tran & RUT will continue to be harbingers of future price behavior in broad indices.
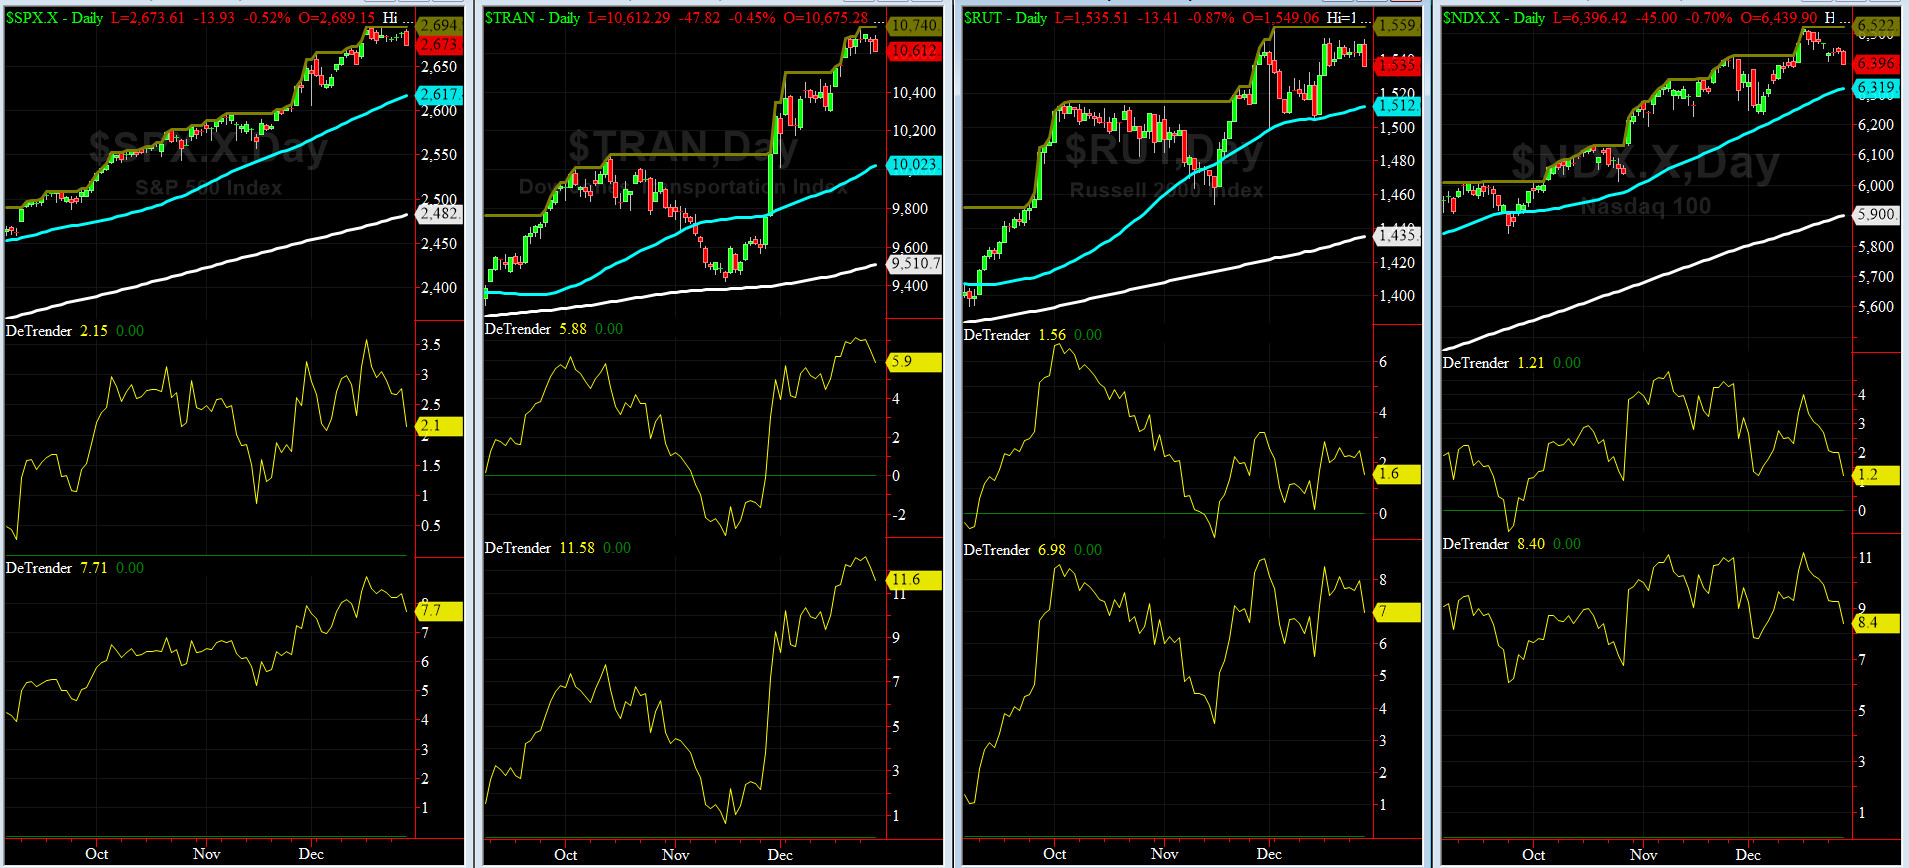
DeTrenders Charts for SPX, NDX, TRAN & RUT Indices
50-Day MA SPX = 2617 or 2.1% below SPX (max observed in last 7 yrs = +8.6%, min = -9.3%)
200-Day MA SPX = 2482 or 7.7% below SPX (max observed in last 7 yrs = 15.2%, min = -14%)
All of our EIGHT DeTrenders are in POSITIVE territory. The DeTrenders for DJ Tran & RUT will continue to be harbingers of future price behavior in broad indices.
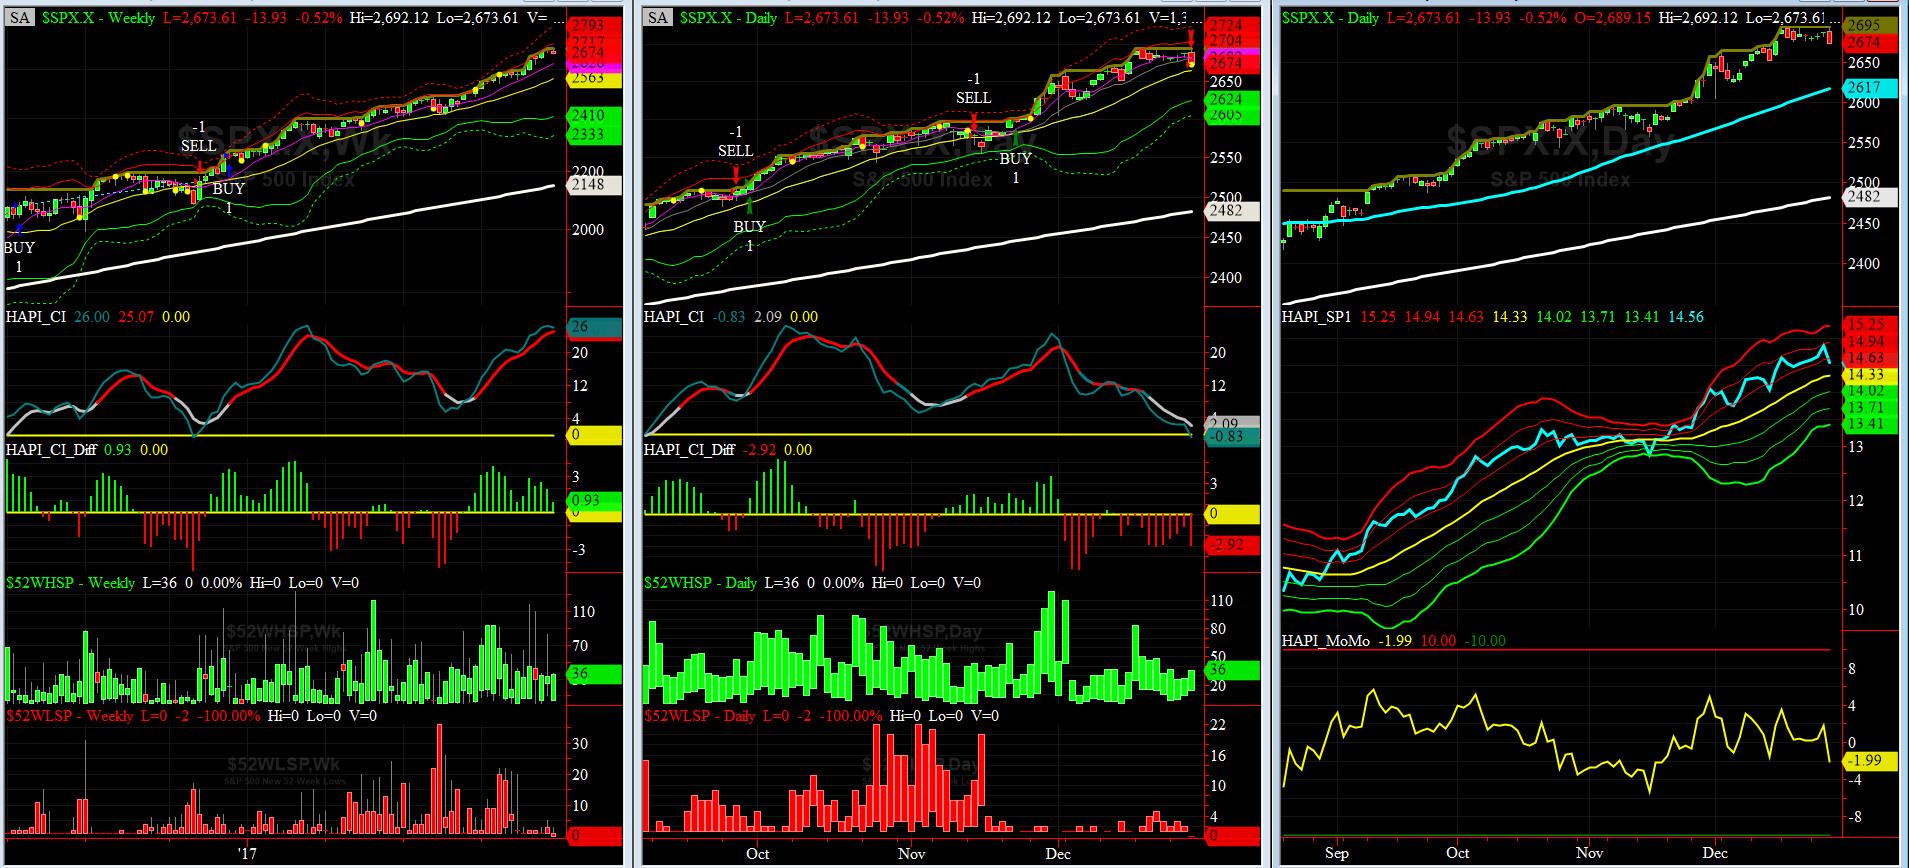
HA_SP1_Momo Chart
WEEKLY Timing Model = on a BUY Signal since Friday 12/16/16 CLOSE at 2258
DAILY Timing Model = on a SELL Signal since Friday 12/29/17 CLOSE at 2673
Max SPX 52wk-highs reading last week = 37 (over 120-140, the local maxima is in)
Max SPX 52wk-Lows reading last week = 3 (over 40-60, the local minima is in)
HA_SP1 closed near its +1 sigma channels
HA_Momo = -2 (reversals most likely occur above +10 or below -10)
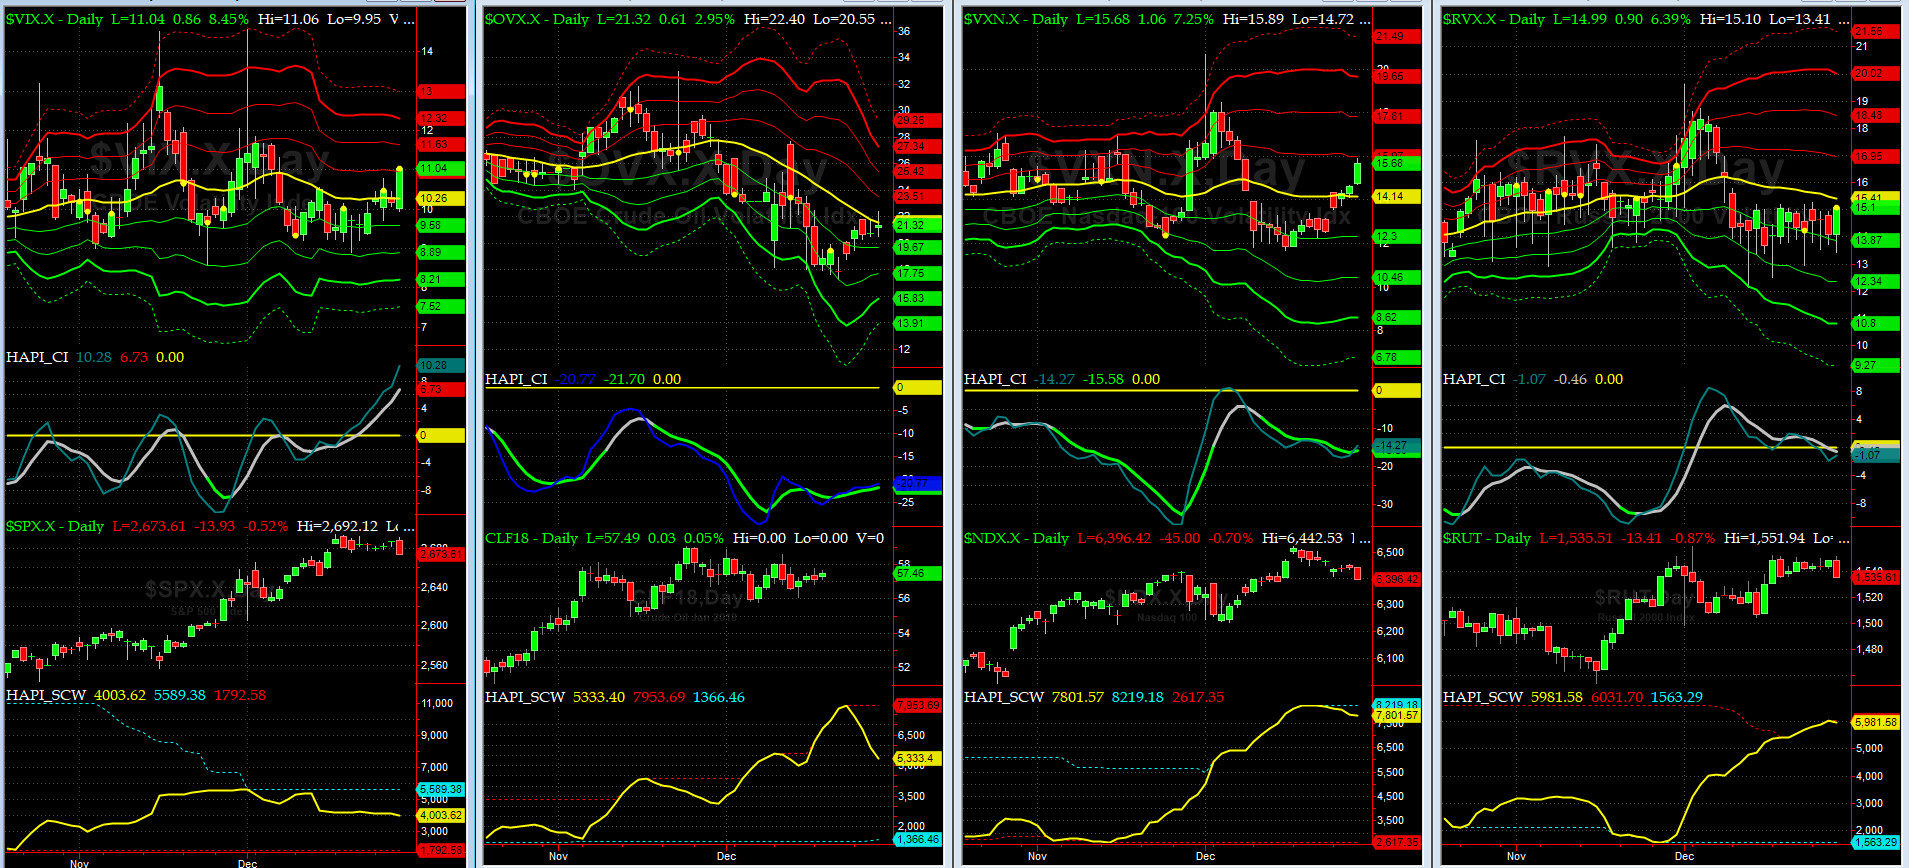
Vol of the Vols Chart
VIX currently stands at 11.04, at about its +1 sigma (remember it's the VIX volatility pattern aka "its sigma channels" that matters, and not the level of VIX itself (this is per Dr. Robert Whaley, a great mentor and inventor of original VIX, now called VXO). VIX usually peaks around a test of its +4 sigma).
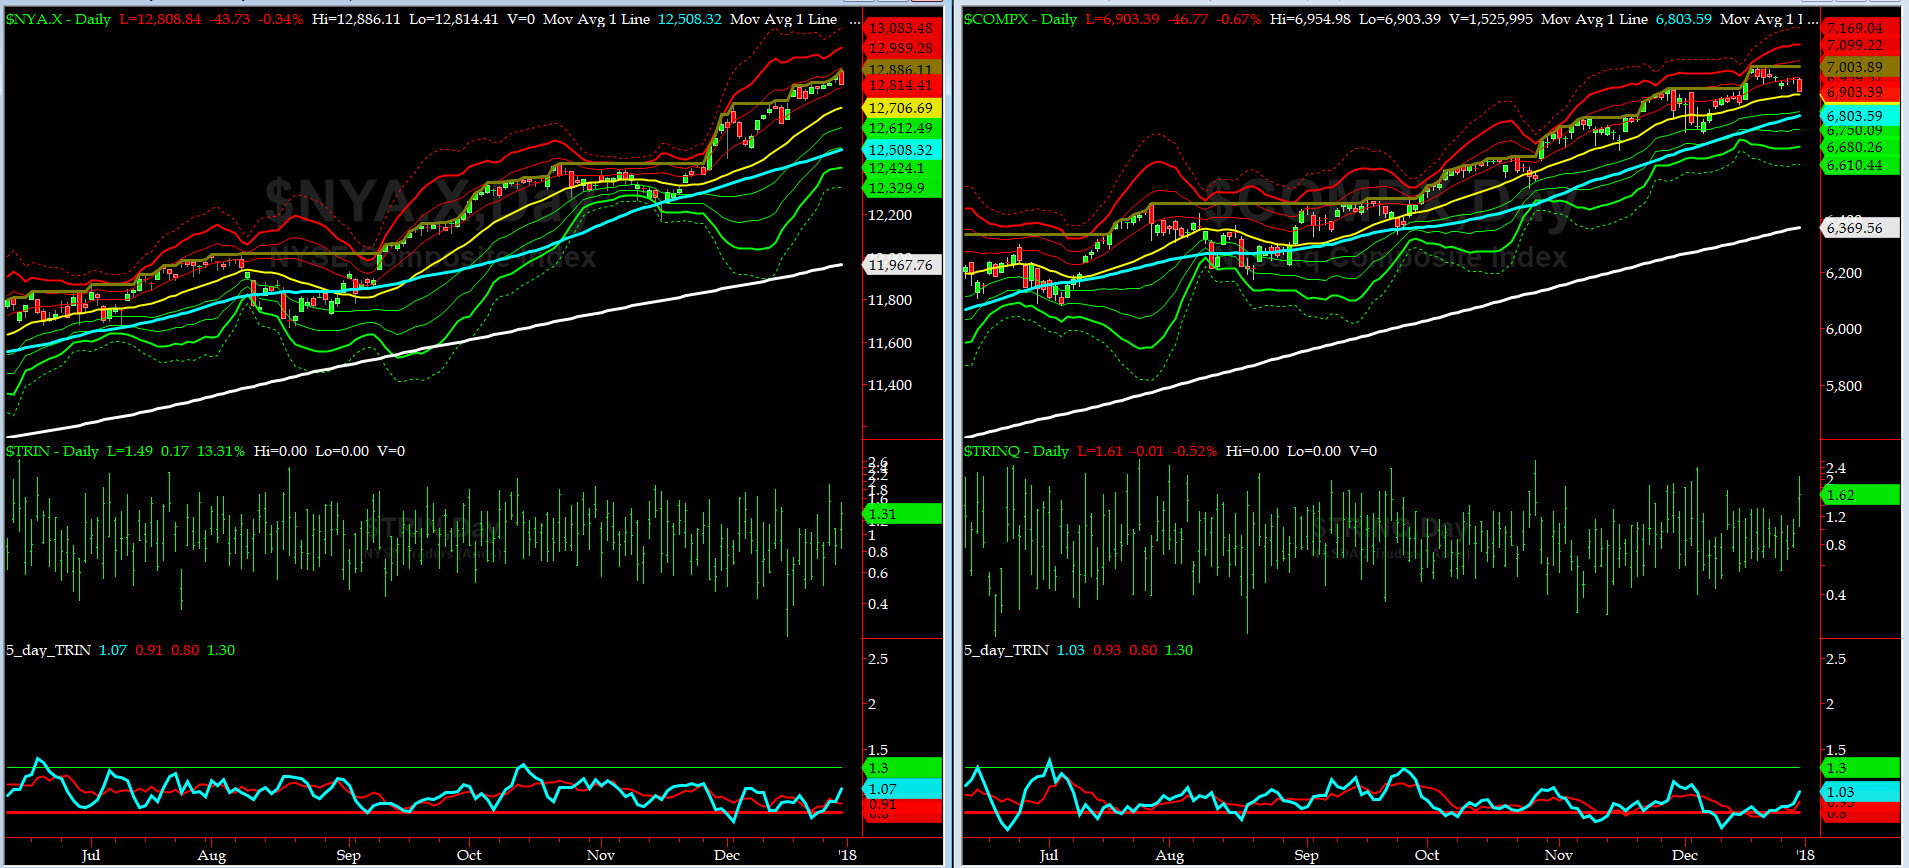
5-day TRIN & TRINQ Charts
Both NYSE 5-day TRIN & TRINQ are in the NEUTRAL zones.
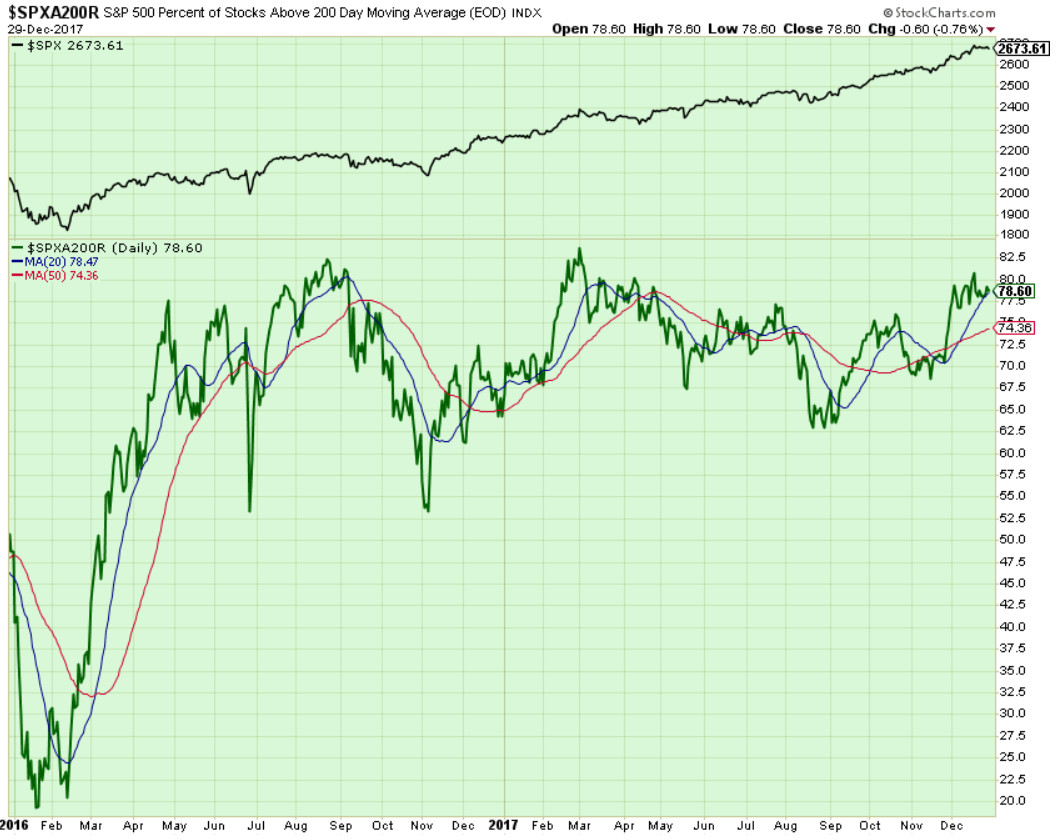
Components of SPX above their respective 200day MA Chart
This scoring indicator rose a tad and then eased off and went sideways to close at 78.6. NO SIGNAL HERE.
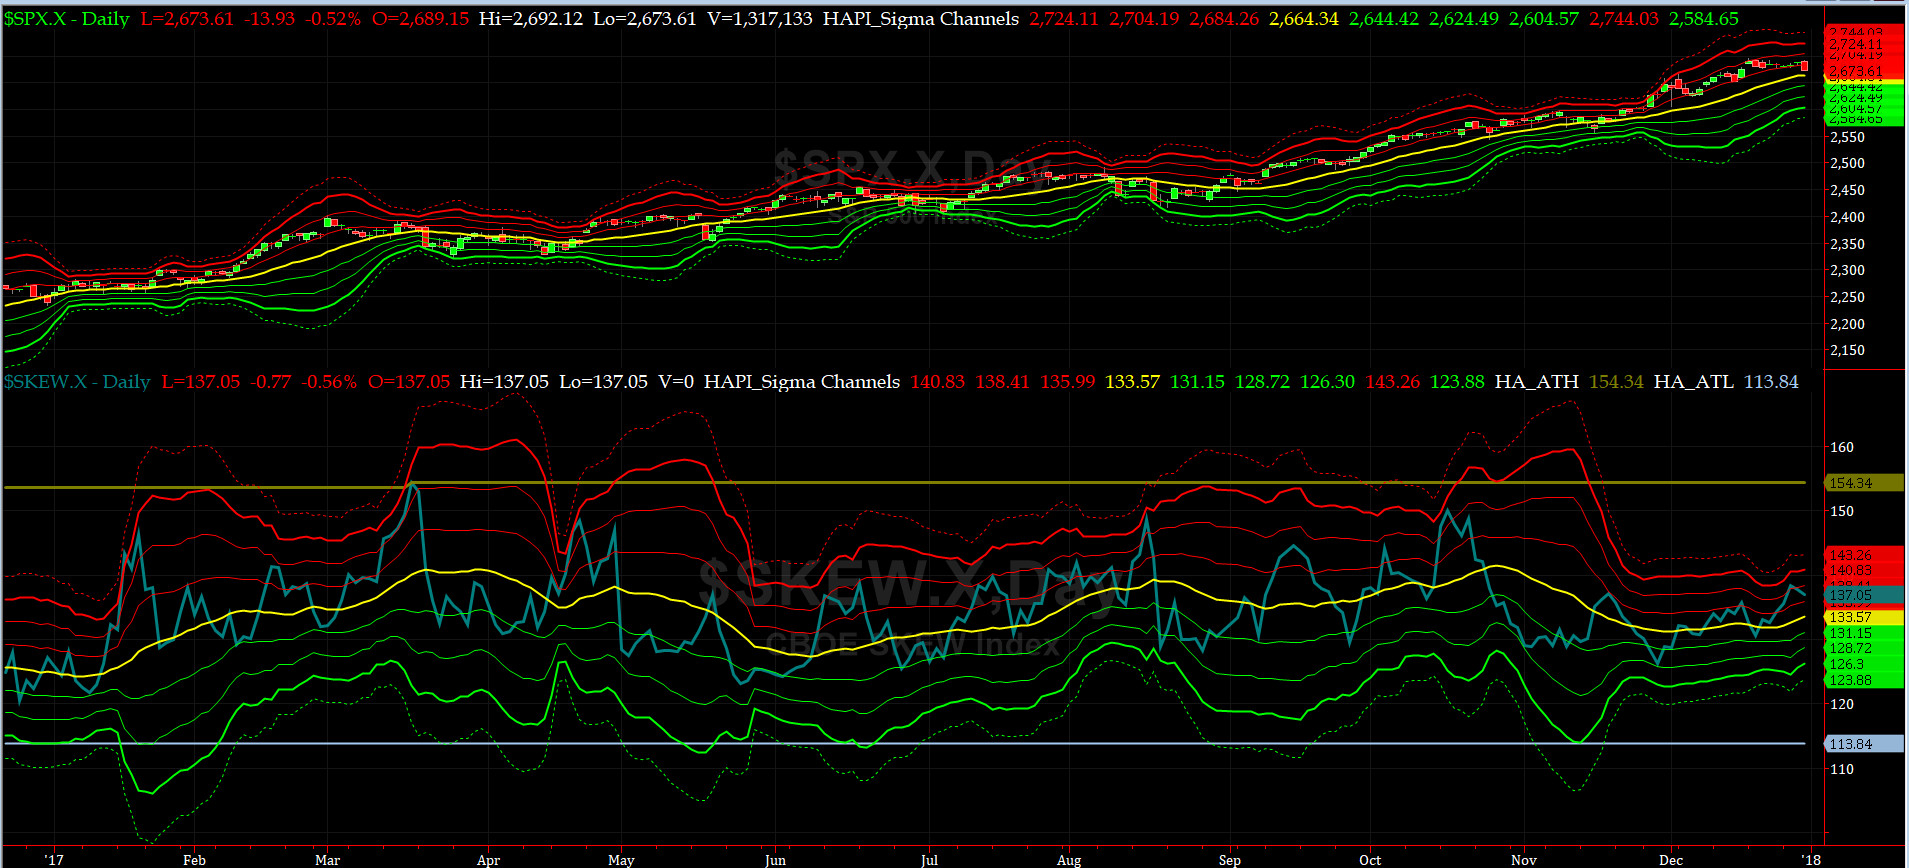
SPX SKEW (Tail Risk) Chart
Last week SPX SKEW (Tail Risk) closed at ~137, or about its +1 sigma (normal = 120-125, range 100-150).
Is all quiet on the Eastern & Mid-Western Fronts? Smart Money says 'maybe.'
How to interpret the value of SPX SKEW? (from CBOE white paper on SKEW)

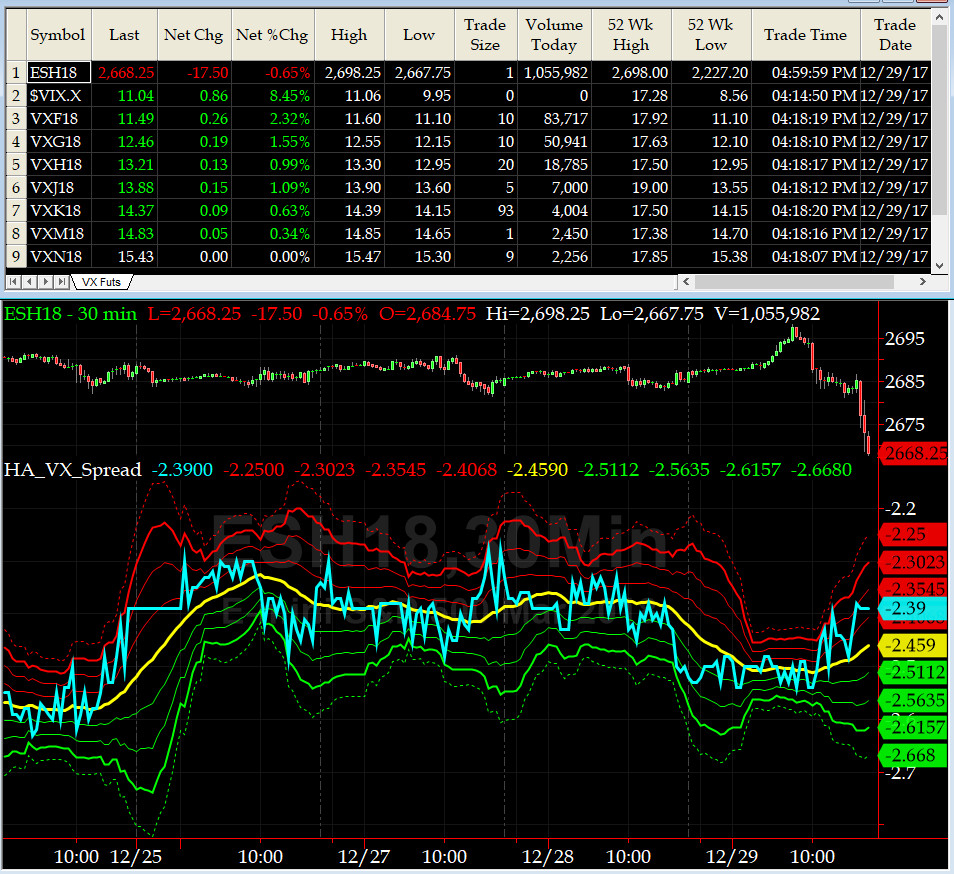
3-month VIX Futures Spread(VX) Chart
This popular timing indicator closed at -2.4. Equity markets eased off a tad from short-term overbought zones.
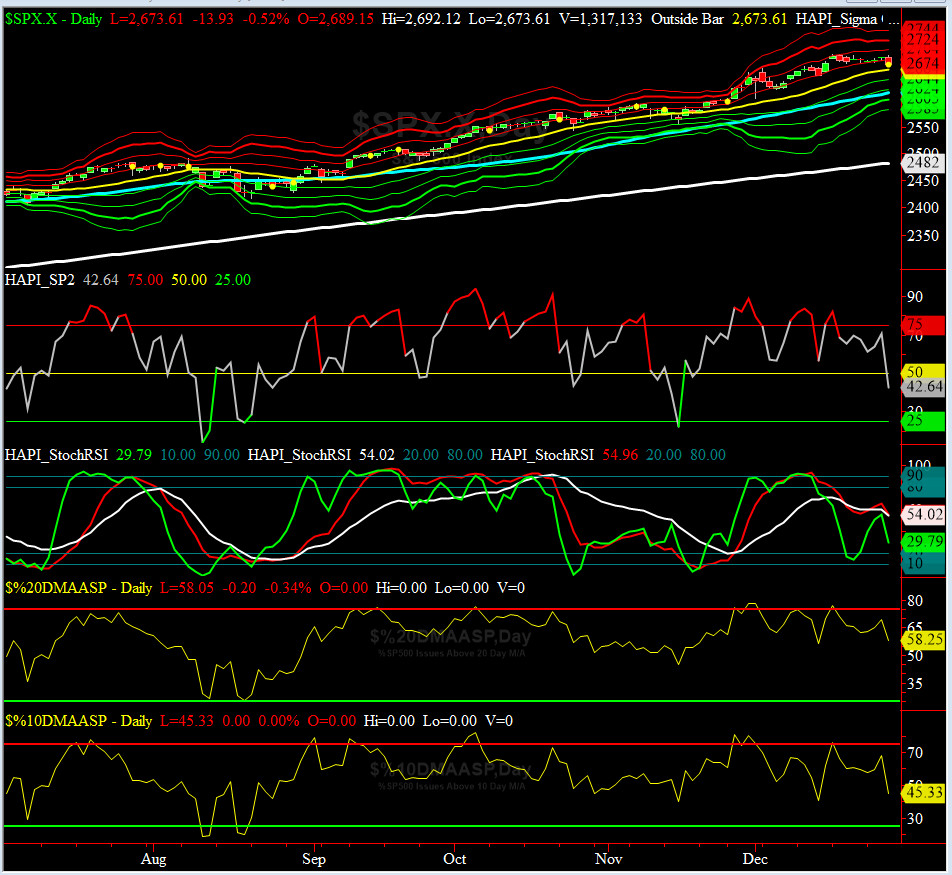
HA_SP2 Chart
HA_SP2 = 42.64 (Buy signal <= 25, Sell Signal >= 75)
While this coveted timing indicator rallied to 71 during the past week, it plunged hard to 42 in the last trading hour of 2017, possibly due to news from Iran.
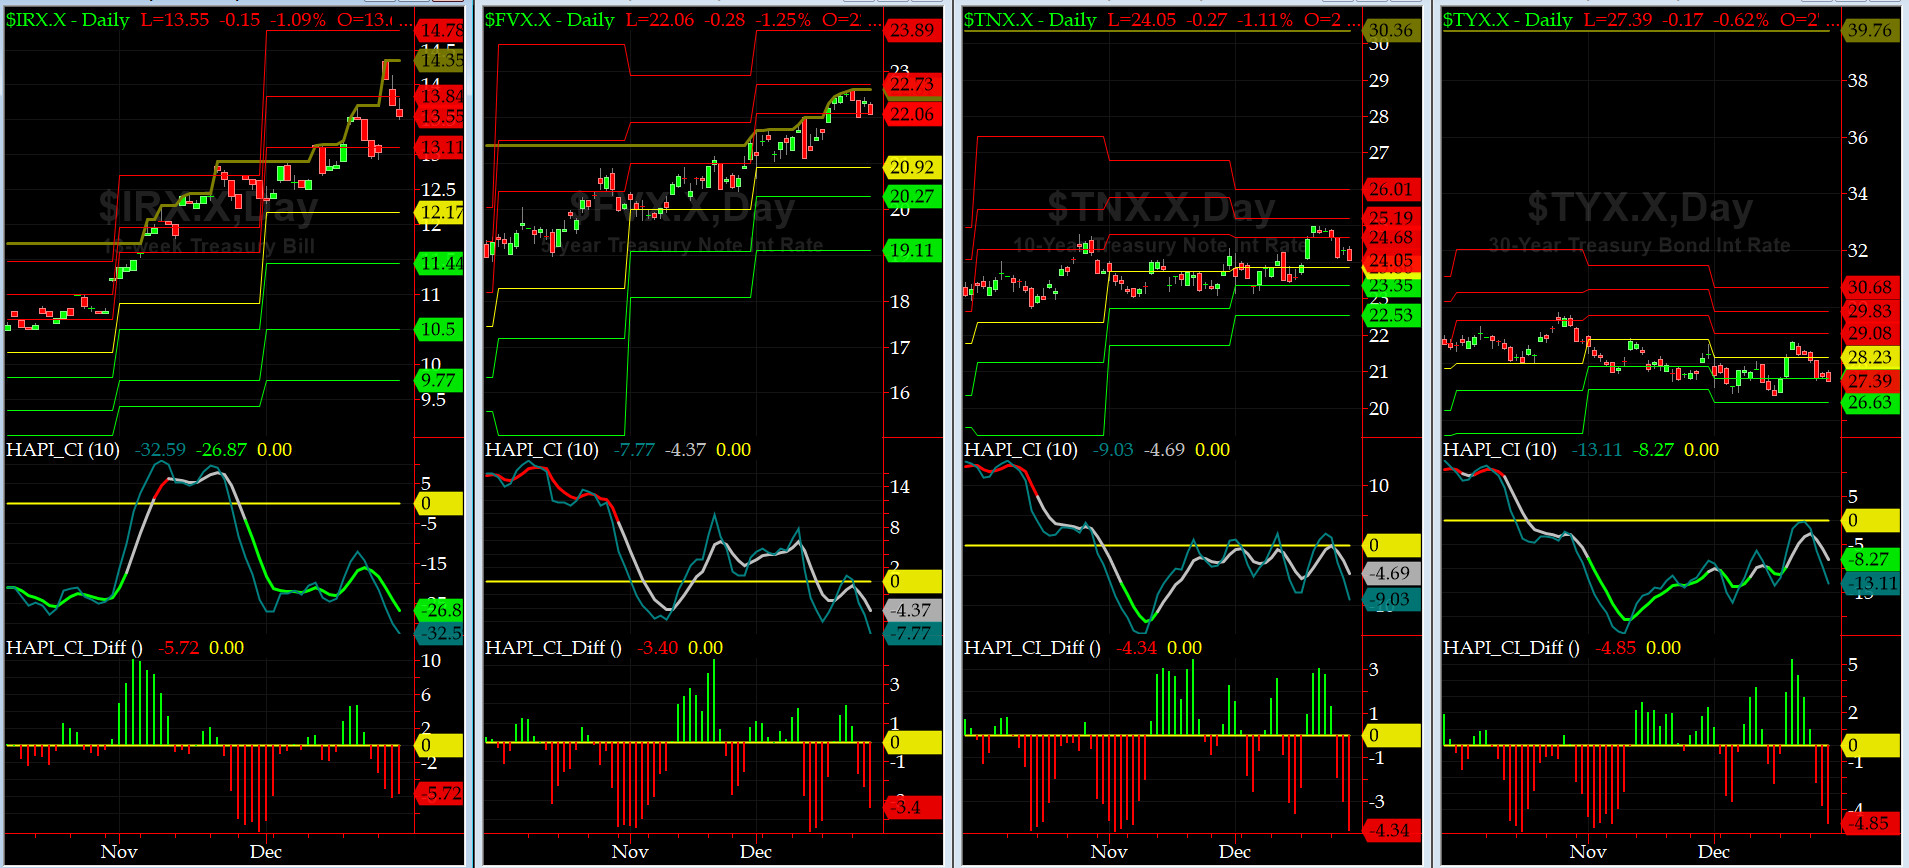
US Treasury T-Notes & T-Bonds Yields Chart
Again, during this two weeks, front-end of the Treasury Curve (Bills & Five Year Notes) sold off further (YTMs rose) while the longer-end (10 Year Notes & 30 Year Bonds) rallied (YTMs eased off).
Fari Hamzei
|


 Proactive Market Timing