
|
 |
 |
 |
 |
 |
 |
 |
 |
 Proactive Market Timing Proactive Market Timing
|
|
|
Most Recent PMT vs SPX Performance Chart

|
|
|
|
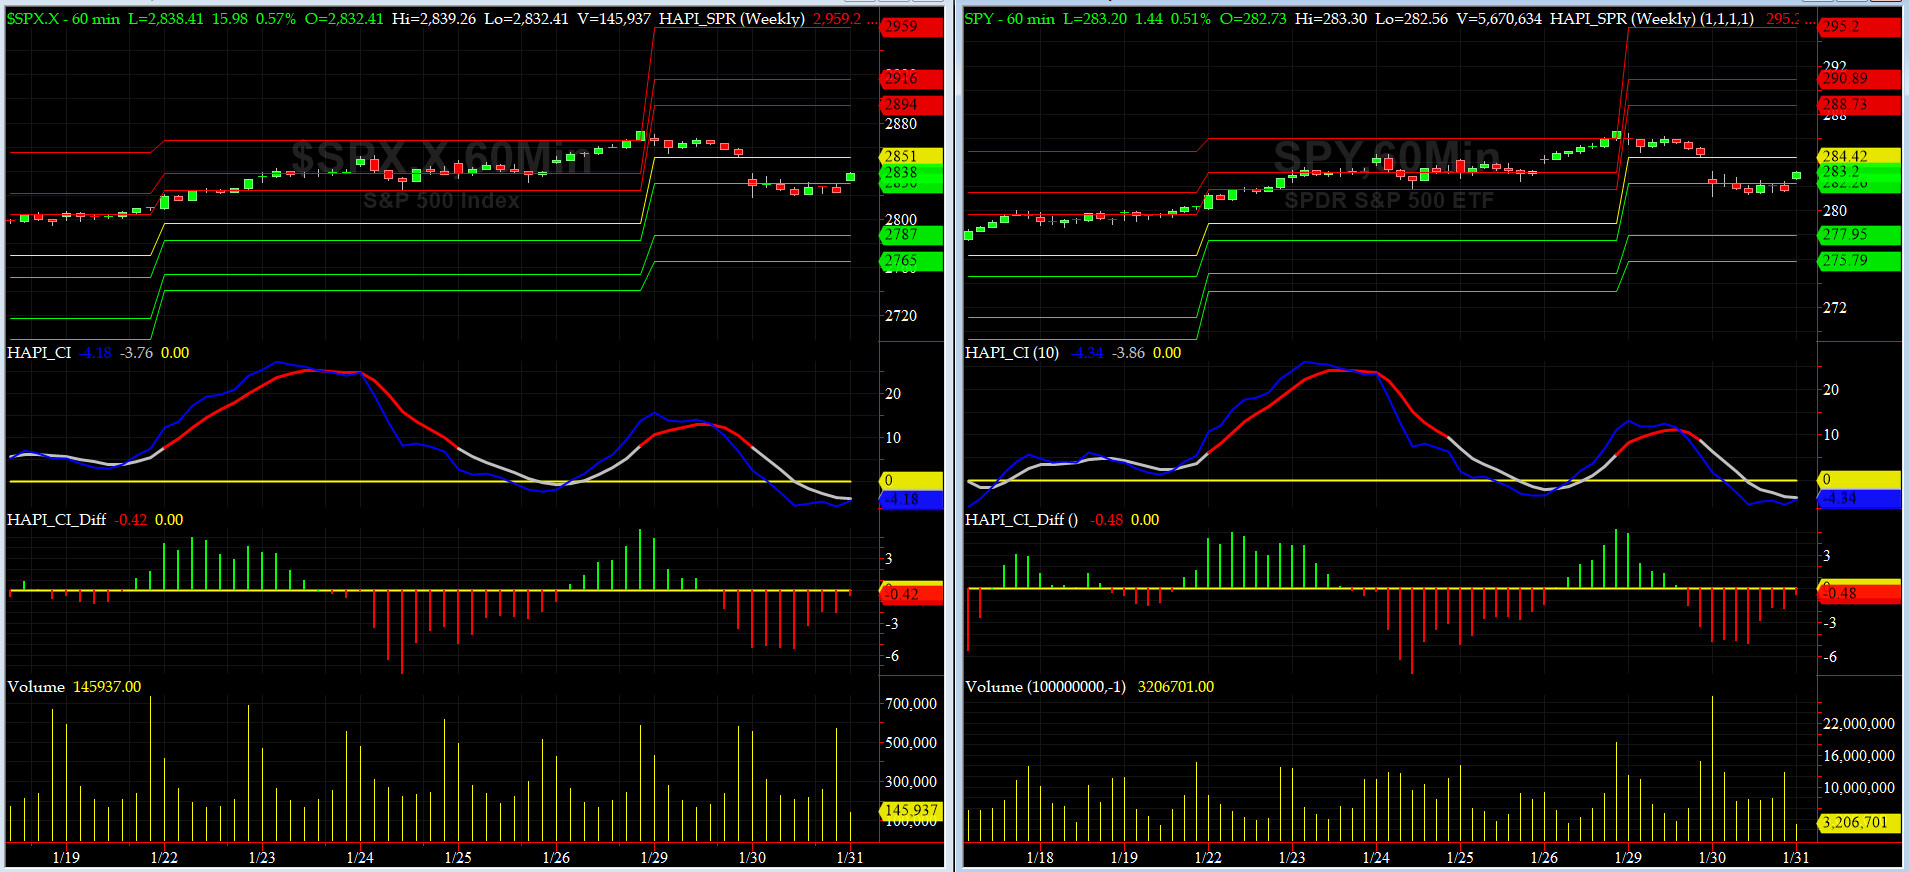
Wednesday, January 31, 2018, 1000ET
UPDATED Companion Chart for Market Bias Review, Issue #226
|
|
|
|
|
|
Wednesday, January 31, 2018, 0955ET
UPDATED Market Bias for Issue #226
Our current Market Bias with Timer Digest is LONG SPX as of Friday JAN 26 at 2872.87
Our previous Market Bias was SHORT SPX as of Tuesday DEC 19 at 2681.47
Here are the trade parameters for this week:
SPX Secondary Profit Target for last 20% of our position = 2900
SPX Primary Profit Target for first 80% of our position = 2885
SPX BreakEven Stop (Last Open) for last 20% of our position = 2832
SPX Money Management Stop for 100% of our position = 2820
|
| Action |
Asset |
Expiration |
Strike |
Option |
| BUY |
SPY |
Friday FEB 16 |
283 |
Calls |
| SELL SHORT |
SPY |
Friday FEB 16 |
288 |
Calls |
| You need to execute both legs and hold it as a Call-Spread.
|
Note A:
Once the Primary Profit Target has been reached, traders are advised to close 80% of their position in order to lock in profits. The remaining balance can be carried over with a BreakEven STOP, based on the SPX level at the time of entry, in order to make the trade a zero-risk trade with the final position running to reach the Secondary Profit Target.
Once either Secondary Profit or Money Management (BreakEven STOP after the 80% peel-off) is hit, our Option/ETF trade for that week is over. Go to Cash and wait for the next PMT Issue.
Note B:
When we change our Market Bias with Timer Digest, You need to go FLAT asap. With PMT Pro, that is before the Close that day and with the basic PMT, at the open of the next day.
Fari Hamzei
|
|
|
|
|
|
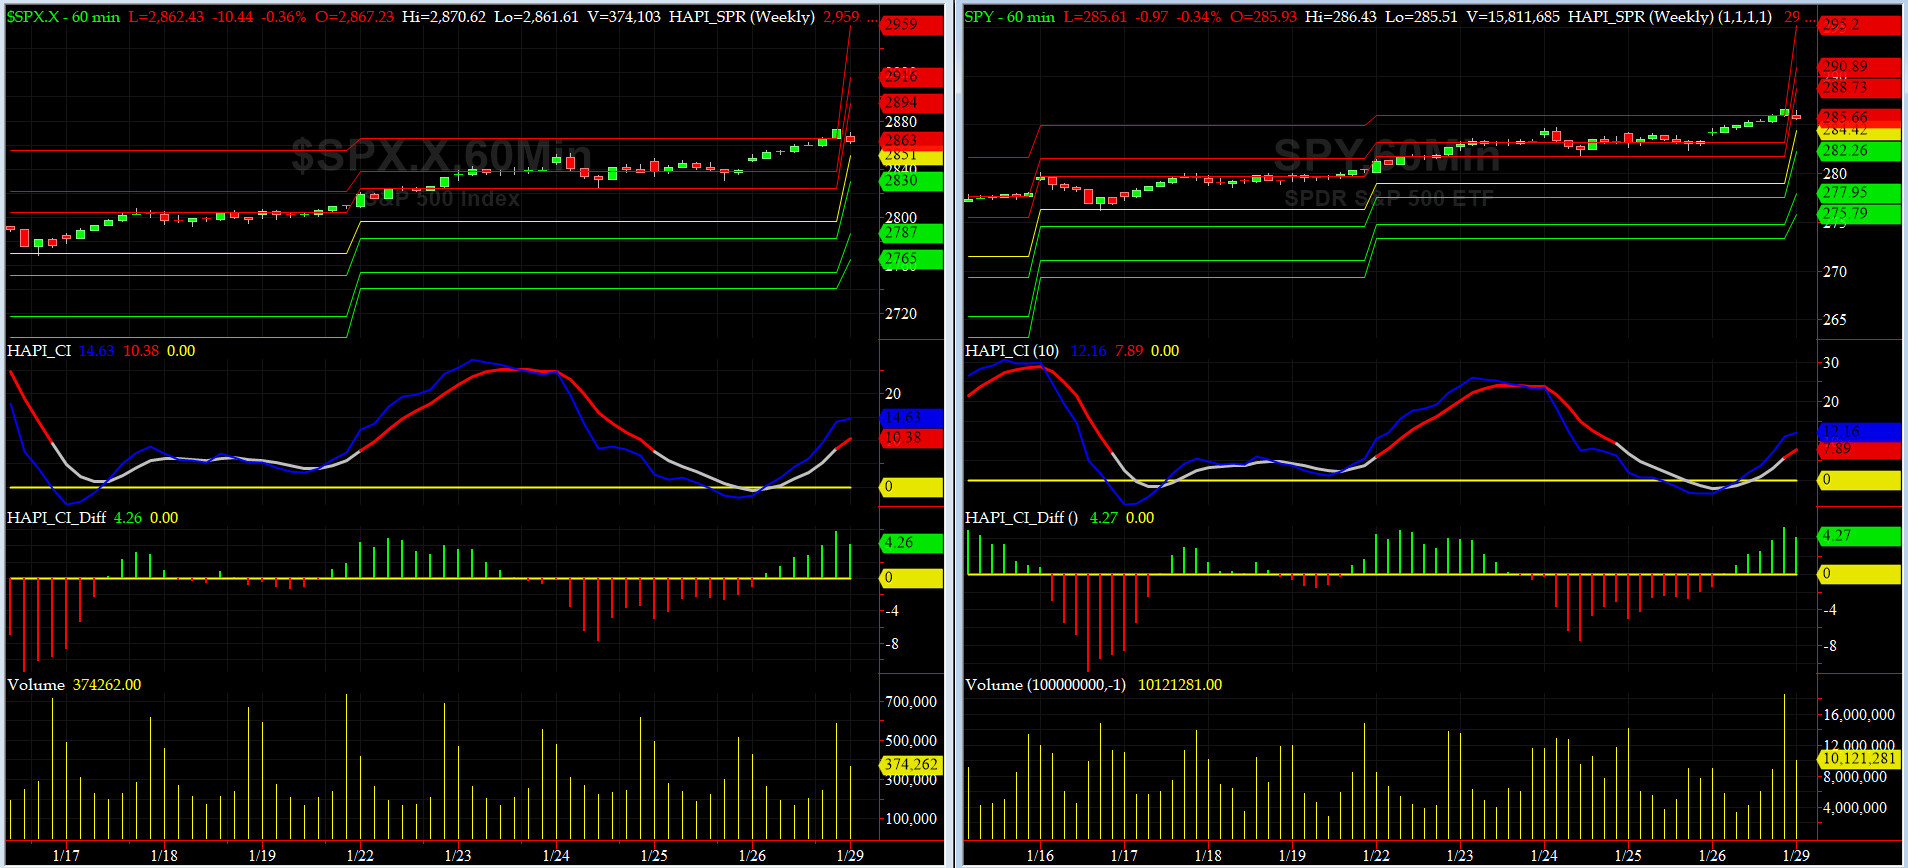
Monday, January 29, 2018, 1000ET
Companion Chart for Market Bias Review, Issue #226
|
|
|
|
|
|
Monday, January 29, 2018, 0955ET
Market Bias for Issue #226
Our current Market Bias with Timer Digest is LONG SPX as of Friday JAN 26 at 2872.87
Our previous Market Bias was SHORT SPX as of Tuesday DEC 19 at 2681.47
Here are the trade parameters for this week:
SPX Secondary Profit Target for last 20% of our position = 2915
SPX Primary Profit Target for first 80% of our position = 2895
SPX BreakEven Stop (Last Open) for last 20% of our position = 2867
SPX Money Management Stop for 100% of our position = 2845
|
| Action |
Asset |
Expiration |
Strike |
Option |
| BUY |
SPY |
Friday FEB 16 |
286 |
Calls |
| SELL SHORT |
SPY |
Friday FEB 16 |
291 |
Calls |
| You need to execute both legs and hold it as a Call-Spread.
|
Note A:
Once the Primary Profit Target has been reached, traders are advised to close 80% of their position in order to lock in profits. The remaining balance can be carried over with a BreakEven STOP, based on the SPX level at the time of entry, in order to make the trade a zero-risk trade with the final position running to reach the Secondary Profit Target.
Once either Secondary Profit or Money Management (BreakEven STOP after the 80% peel-off) is hit, our Option/ETF trade for that week is over. Go to Cash and wait for the next PMT Issue.
Note B:
When we change our Market Bias with Timer Digest, You need to go FLAT asap. With PMT Pro, that is before the Close that day and with the basic PMT, at the open of the next day.
Fari Hamzei
|
|
|
|
|
|
Sunday, January 28, 2018, 2130ET
Market Timing Charts, Analysis & Commentary for Issue #226
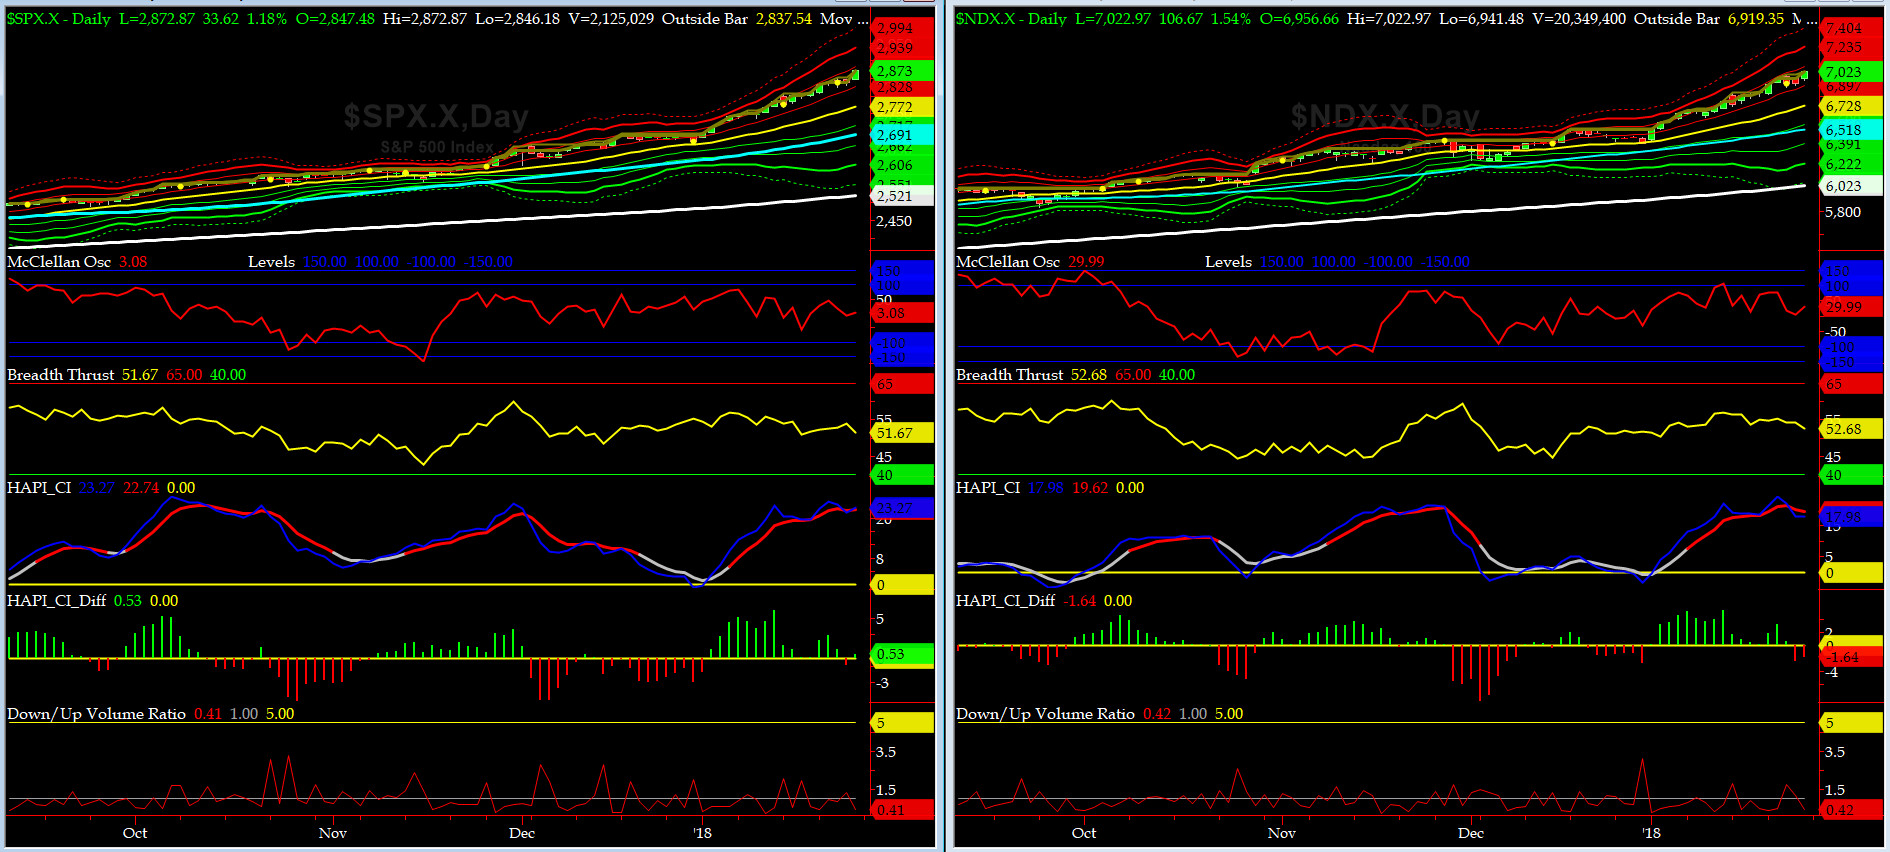
Timer Charts of S&P-500 Cash Index (SPX) + NASDAQ-100 Cash Index (NDX)
Most recent S&P-500 Cash Index (SPX): 2873.87 up +63.57 (up 2.3%) for the week ending on Friday, January 26, 2018, which closed about its +2 sigma.
SPX ALL TIME INTRADAY HIGH = 2872.87 (reached on Friday, Jan 26, 2018)
SPX ALL TIME CLOSING HIGH = 2872.87 (reached on Friday, Jan 26, 2018)
Current DAILY +2 Sigma SPX = 2883 with WEEKLY +2 Sigma = 2837
Current DAILY 0 Sigma (20 day MA) SPX = 2772 with WEEKLY 0 Sigma = 2634
Current DAILY -2 Sigma SPX = 2662 with WEEKLY -2 Sigma = 2430
NYSE McClellan Oscillator = +3 (-150 is start of the O/S area; around -275 to -300 area or lower, we go into the �launch-pad� mode, over +150, we are in O/B area)
NYSE Breadth Thrust = 51.6(40 is considered as oversold and 65 as overbought)
yes, equity markets are still in overbought zone......
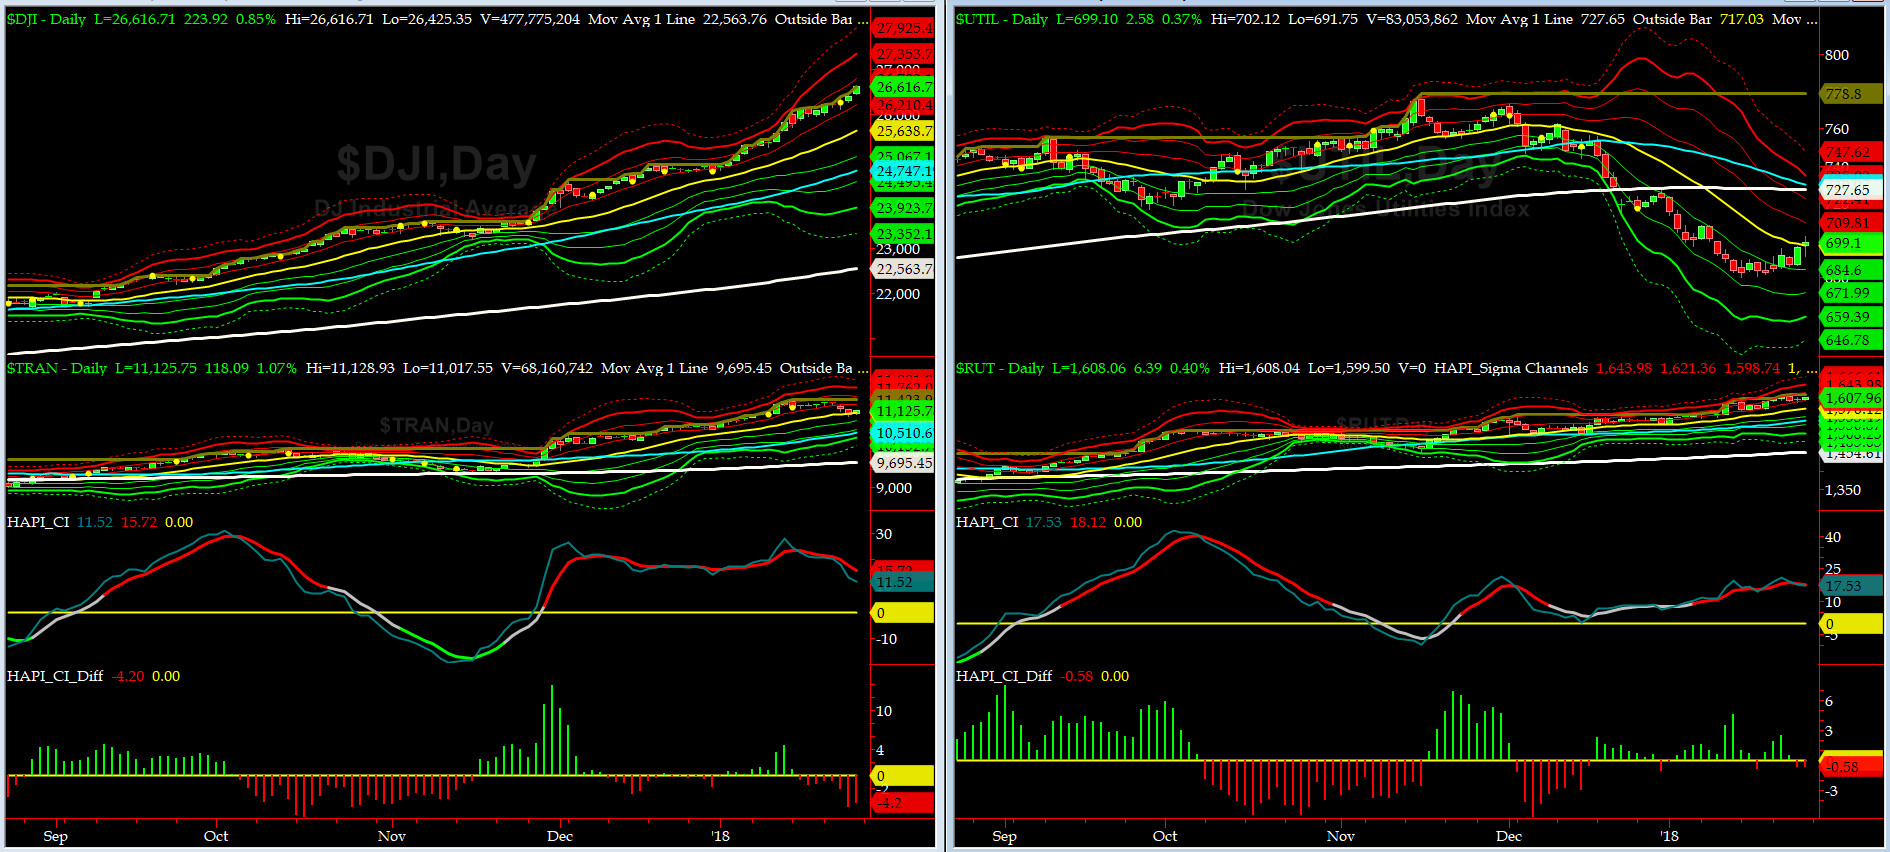
Canaries [in the Coal Mine] Chart for DJ TRAN & RUT Indices
200-Day MA DJ TRAN = 9695 or 14.8% above DJ TRAN (max observed in last 7 yrs = 20.2%, min = -20.3%)
200-Day MA RUT = 1454 or 10.5% above RUT (max observed in last 7 yrs = 21.3%, min = -22.6%)
DJ Transportation Index (proxy for economic conditions 6 to 9 months hence) took a dive this past week and its 200day DeTrender is off 4% from its peak. Need to watch this carefully.
Russell 2000 Small Caps Index (proxy for Risk ON/OFF) is slowly trying to keep up with SPX. RISK continues to be ON.
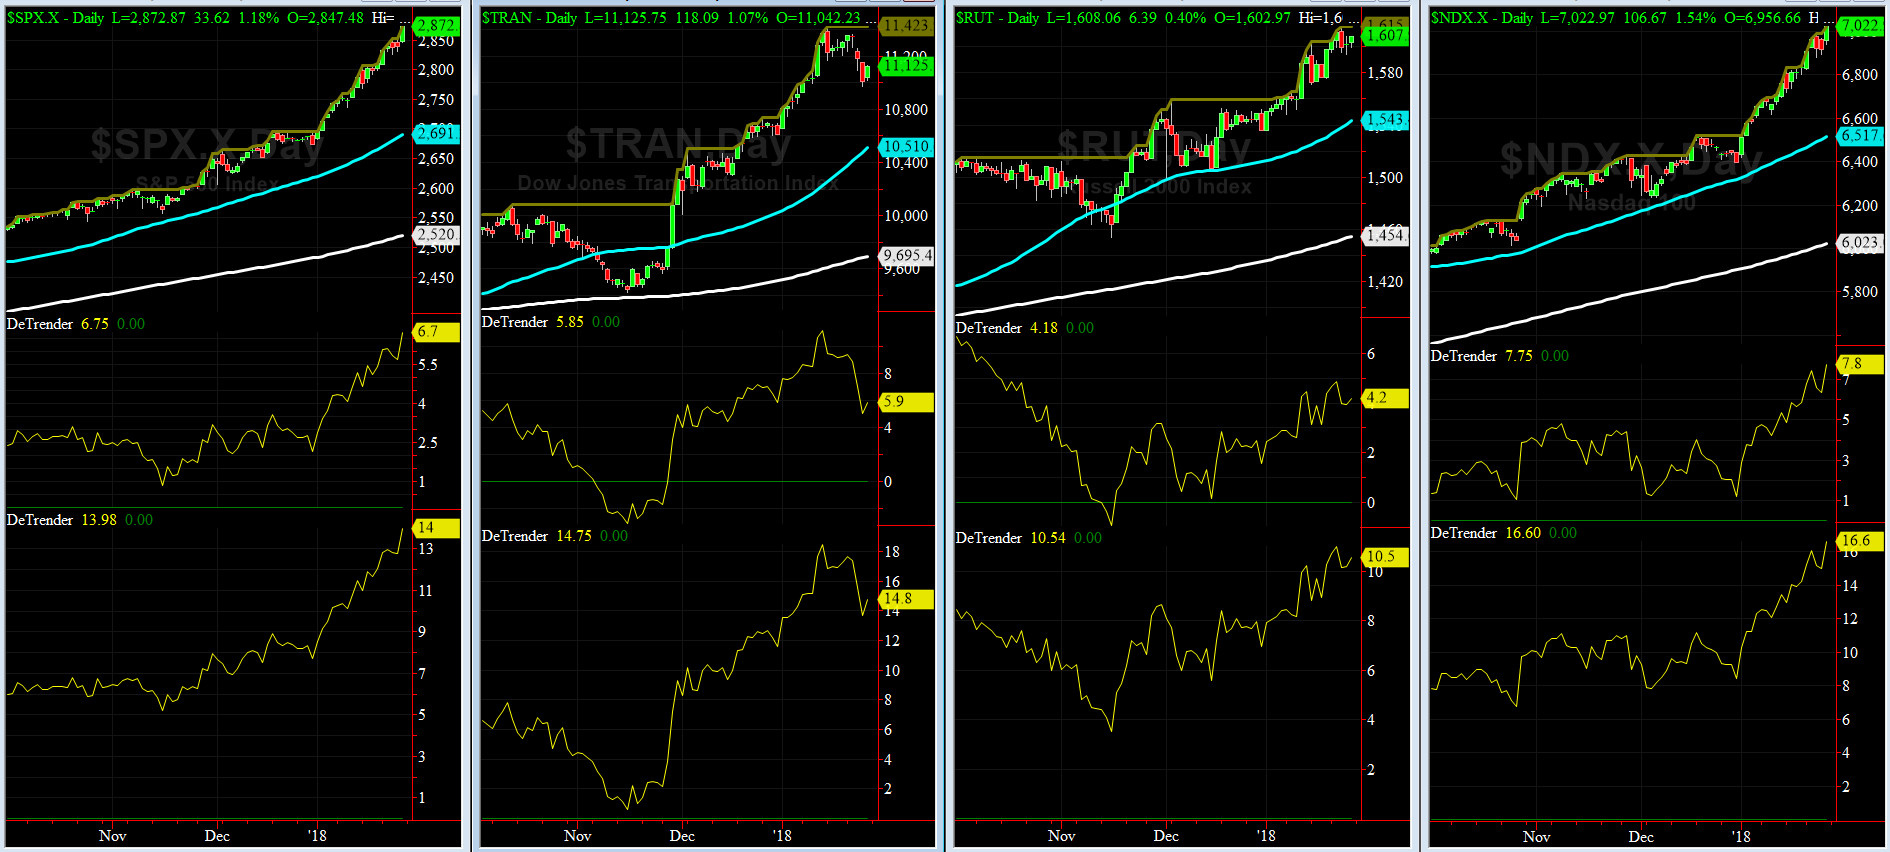
DeTrenders Charts for SPX, NDX, TRAN & RUT Indices
50-Day MA SPX = 2665 or 6.7% below SPX (max observed in last 7 yrs = +8.6%, min = -9.3%)
200-Day MA SPX = 2508 or 14% below SPX (max observed in last 7 yrs = 15.2%, min = -14%)
Pay special attention to both SPX's 50day and 200day DeTrenders reach historical highs.
All of our EIGHT DeTrenders are in POSITIVE territory. The DeTrenders for DJ Tran & RUT will continue to be harbingers of future price behavior in broad indices.
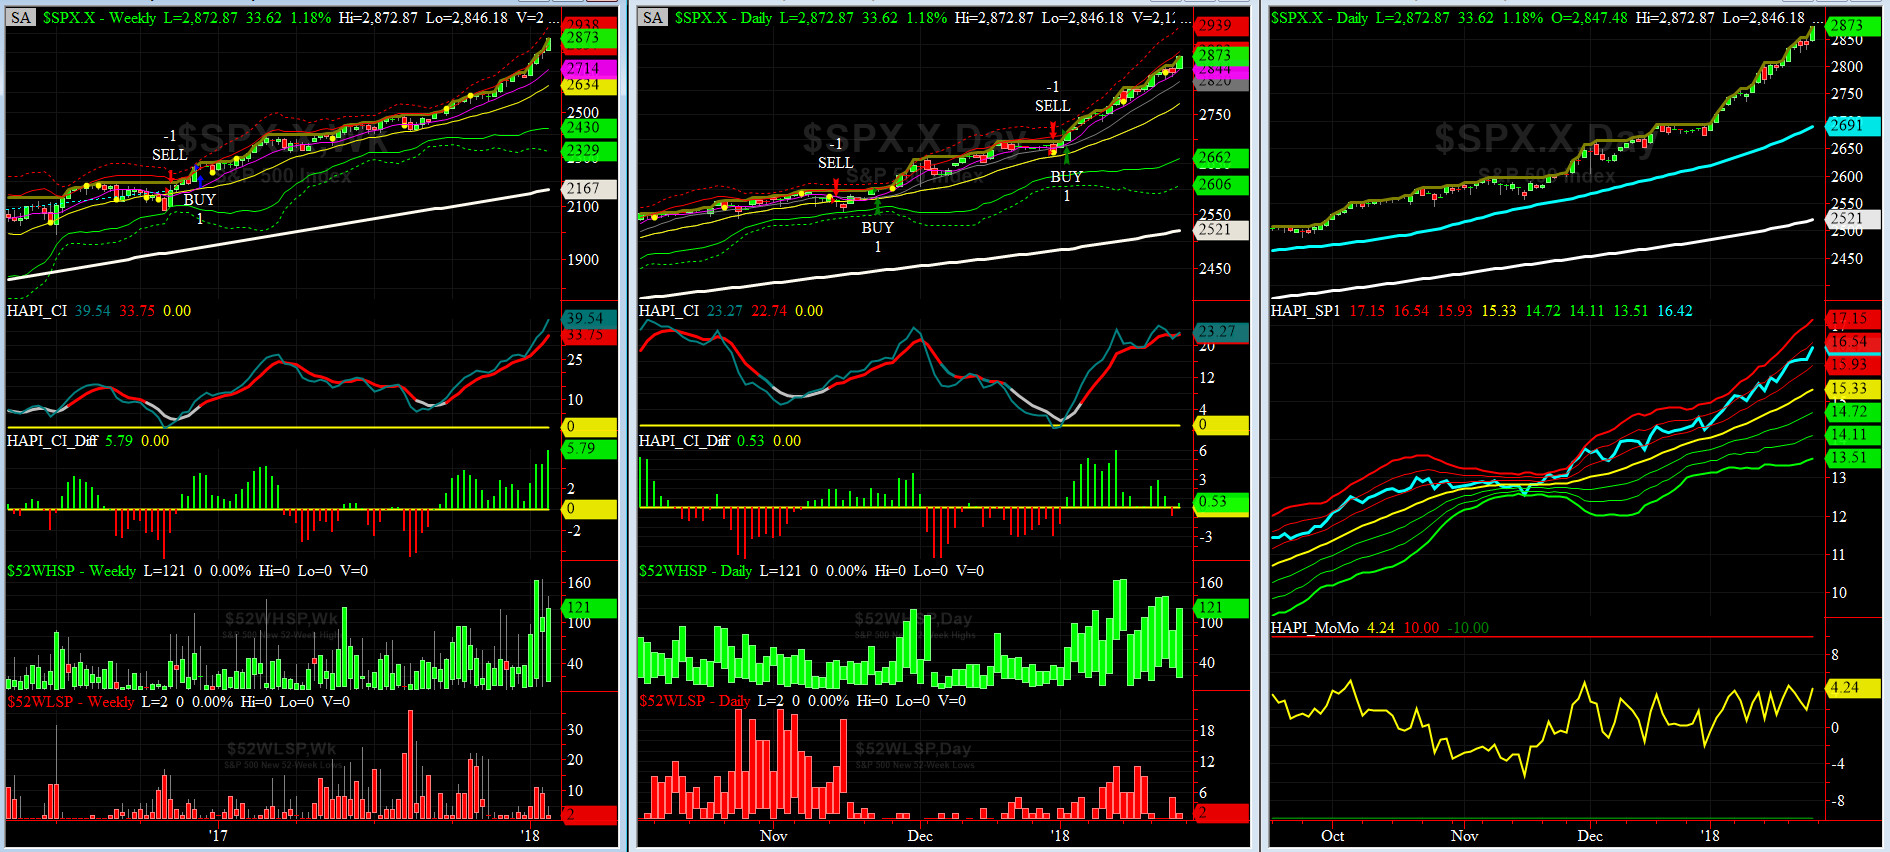
HA_SP1_Momo Chart
WEEKLY Timing Model = on a BUY Signal since Friday 12/16/16 CLOSE at 2258
DAILY Timing Model = on a BUY Signal since Wednesday 1/3/18 CLOSE at 2713
Max SPX 52wk-highs reading last week = 139 (over 120-140, the local maxima is in)
Max SPX 52wk-Lows reading last week = 5 (over 40-60, the local minima is in)
HA_SP1 closed near its +2 sigma channels
HA_Momo = +4.2 (reversals most likely occur above +10 or below -10)
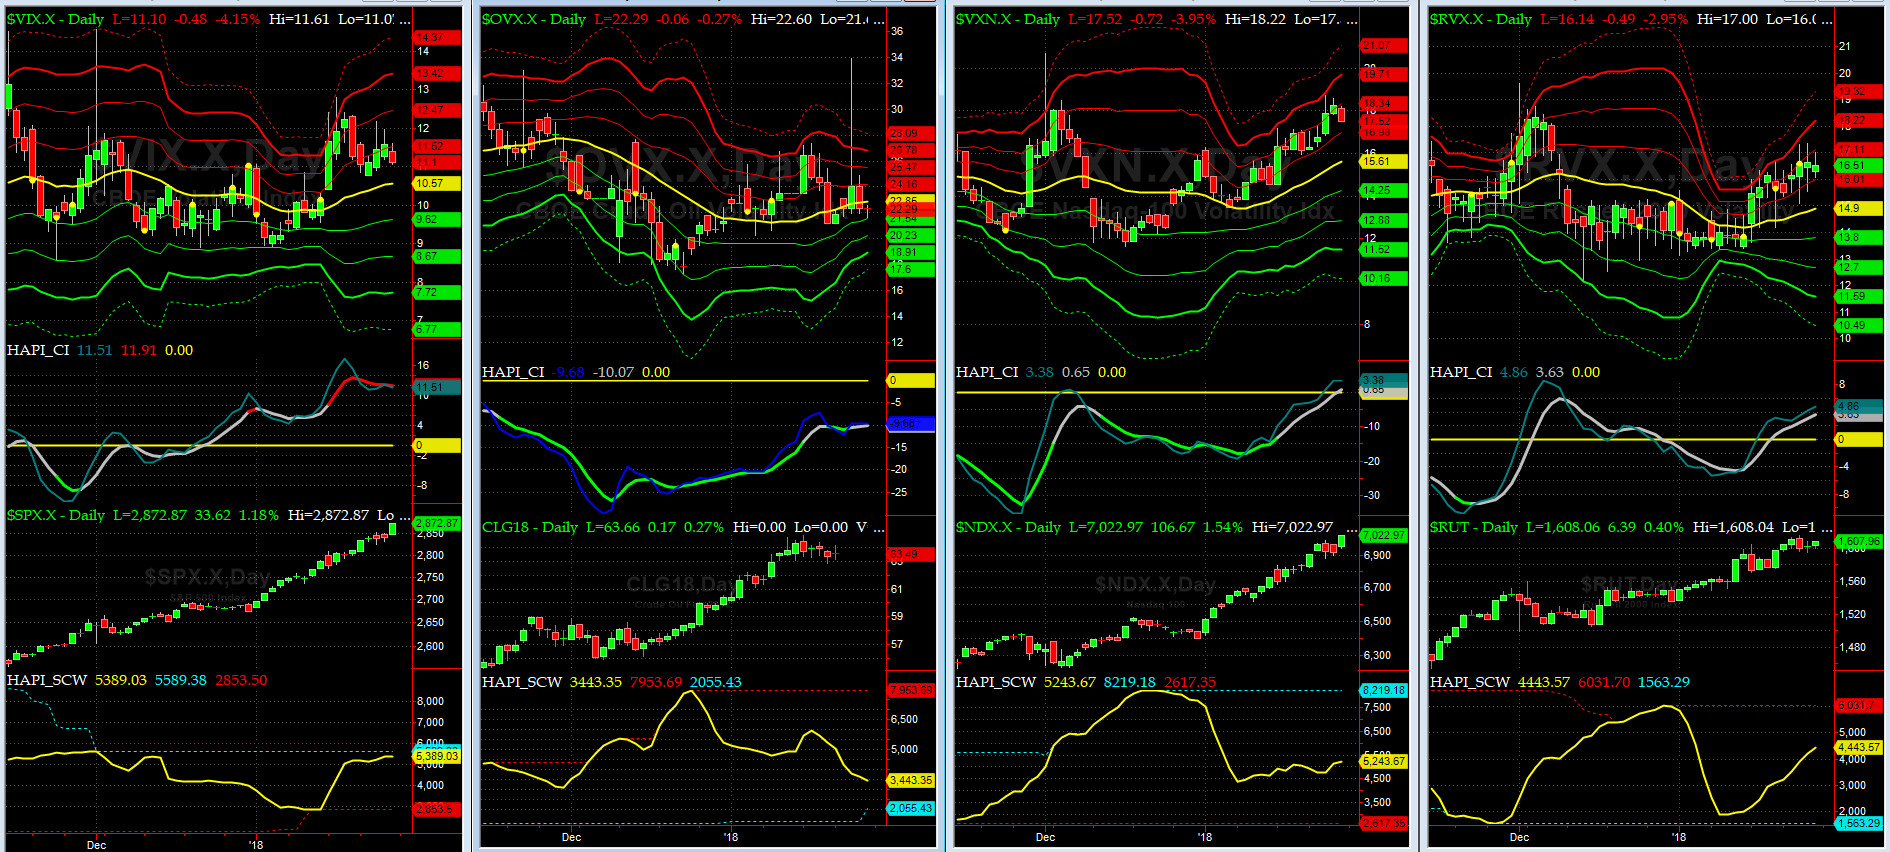
Vol of the Vols Chart
VIX currently stands at 11.1, at about its +1 sigma (remember it's the VIX volatility pattern aka "its sigma channels" that matters, and not the level of VIX itself (this is per Dr. Robert Whaley, a great mentor and inventor of original VIX, now called VXO). VIX usually peaks around a test of its +4 sigma).
Lower highs both in absolute and sigma levels were put in by VIX this week. This melt-up still have some energy.

5-day TRIN & TRINQ Charts
Both NYSE & NASDAQ 5-day TRINs are trading at or near SELL zone.
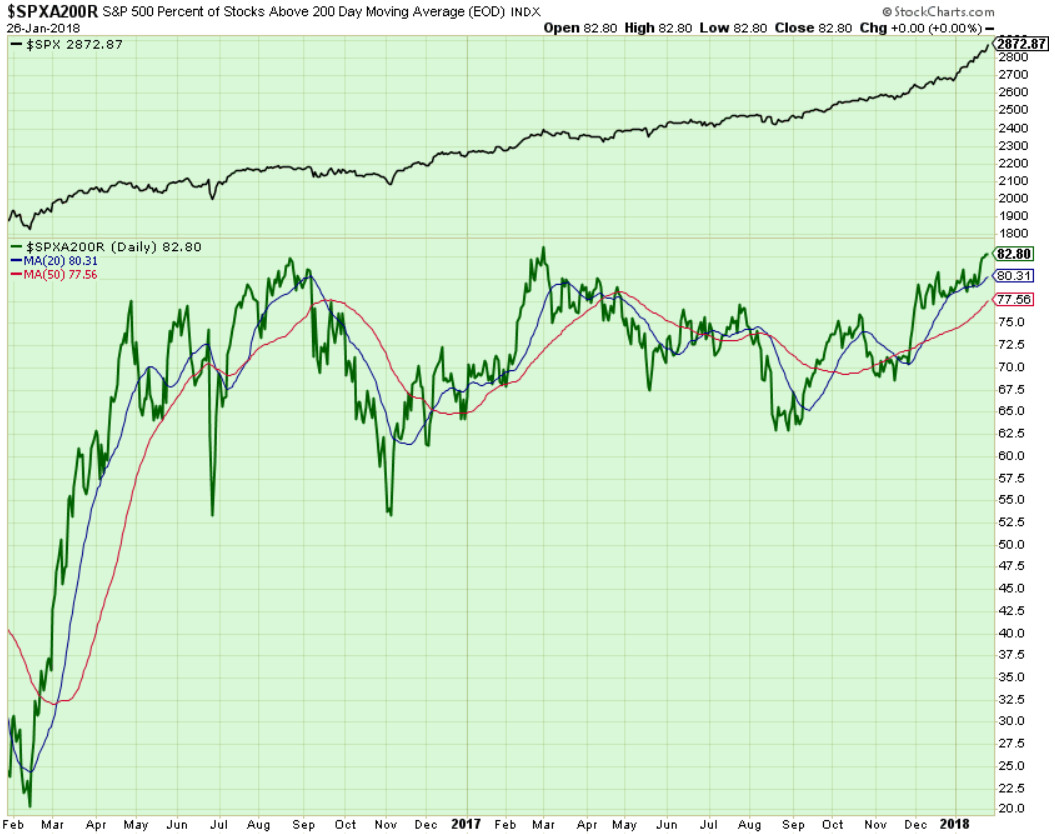
Components of SPX above their respective 200day MA Chart
This scoring indicator was finally broke out of the channel week it has been for 7 weeks and closed at 82.8, confirming more upside could be ahead !!!.

SPX SKEW (Tail Risk) Chart
Last week SPX SKEW (Tail Risk) closed at ~132, or about its zero sigma (normal = 120-125, range 100-150).
Is all quiet on the Eastern & Mid-Western Fronts? Smart Money still says 'YES.'
How to interpret the value of SPX SKEW? (from CBOE white paper on SKEW)

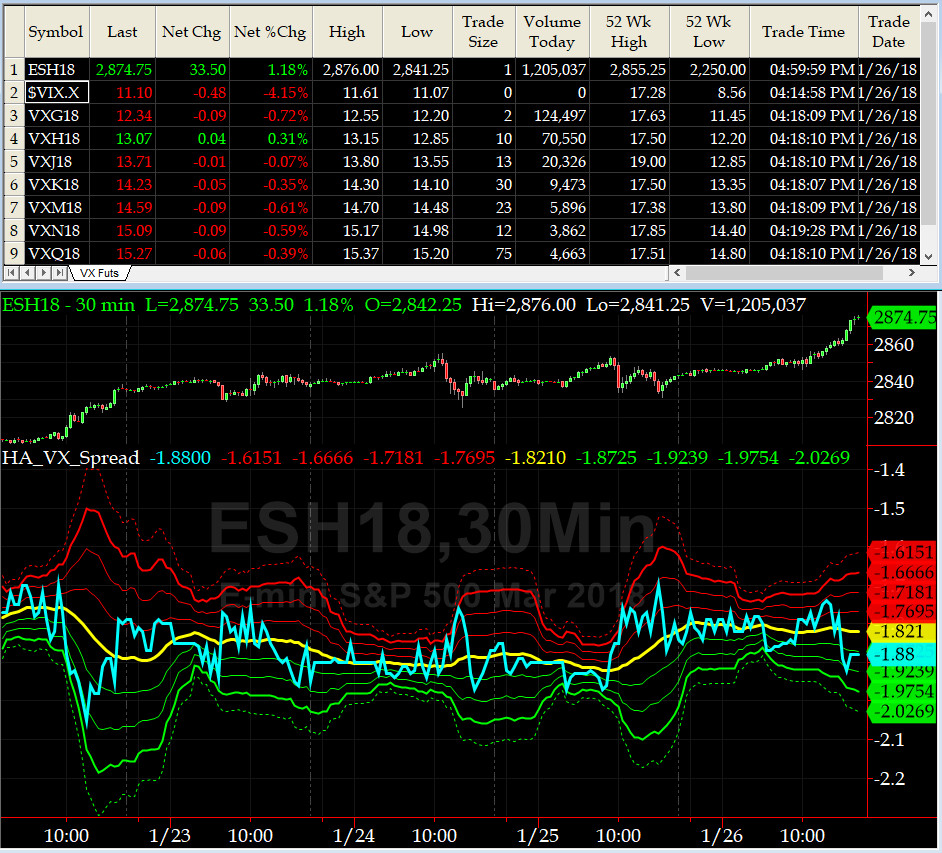
3-month VIX Futures Spread(VX) Chart
This popular timing indicator, now long Feb, short May VIX Futures again closed exactly where it was last week, at -1.88. And again, our equity markets, as far as this indicator is concerned, continue to be slightly overbought.
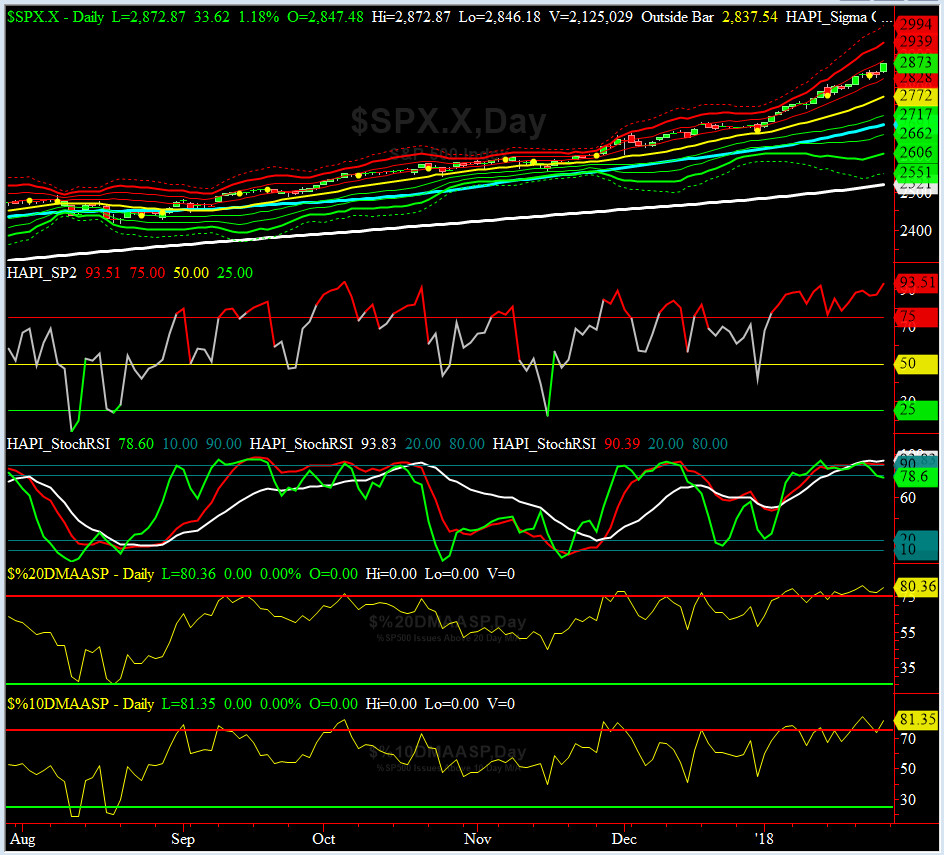
HA_SP2 Chart
HA_SP2 = 93.5 (Buy signal <= 25, Sell Signal >= 75)
This coveted timing indicator says we are now in uber overbought zone (but we know from recent history that we can stay in OB until we don't).
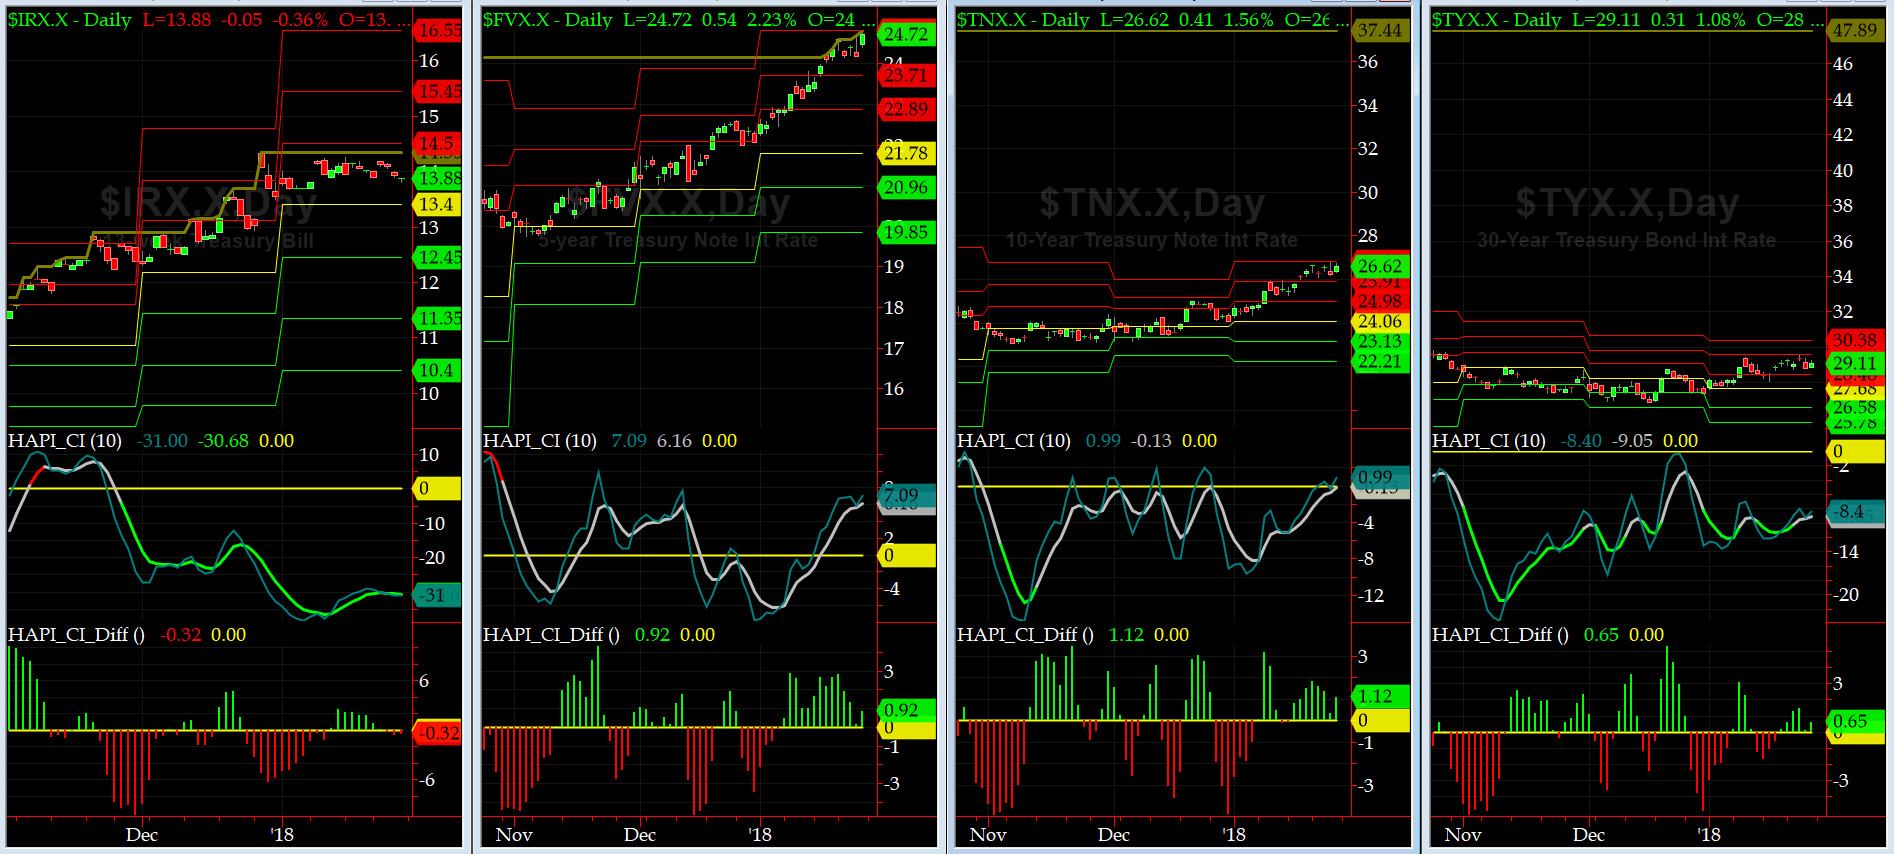
US Treasury T-Notes & T-Bonds Yields Chart
During this past week, the Treasury Curve sold off, mainly in the middle of the Yield Curve with 7-Yr YTM hitting 5 yr highs.
Fari Hamzei
|
|
|
|
|
|
Sunday, January 28, 2017, 1539ET
Notice of Change of Bias with Timer Digest
Dear Jim,
Our equity markets continue to remain overbought as measured by most technical indicators (we also see a few warning signs from certain correlated assets).
But with the current market participant�s psychology, full of boiling animal spirits (you can blame the algos, if you wish), we have witnessed one heck of a bullish move in January 2018. While we are reminded that all parabolic moves usually end with ugly outcomes, and thus think, this game will be over soon (reminds us of 1999-2000 melt-ups), we can�t be certain of the timing of its final top formation. Heck, we were wrong couple times last year too, but percentages up here, translate to much bigger absolute adverse moves.
So, for now, we shall switch to the LONG side, till we can see/reach another probable top.
LONG SPX from 2,872.87��..
Fari Hamzei
|
|
|
|
|
|
Customer Care:
|
|
|
|
|
|
|
 |
 |
|
 |
|
 |
 |
 |
HA YouTube Channel ::: HA Blog ::: Testimonials ::: Tutorials & FAQs ::: Privacy Policy
|
Trading Derivatives (Options & Futures) contains substantial risk and is not for every investor. An investor could potentially lose all or more than his/her initial investment.
Only risk capital should be used for trading and only those with sufficient risk capital should consider trading derivatives. Past performance is not
necessarily indicative of future results. Testimonials appearing on this website may not be representative of other clients or customers
and are not a guarantee of future performance or success.
|
| (c) 1998-2025, Hamzei Analytics, LLC.® All Rights Reserved. |
|
|