|
Sunday, February 4, 2018, 2230ET
Market Timing Charts, Analysis & Commentary for Issue #227
Timer Charts of S&P-500 Cash Index (SPX) + NASDAQ-100 Cash Index (NDX)
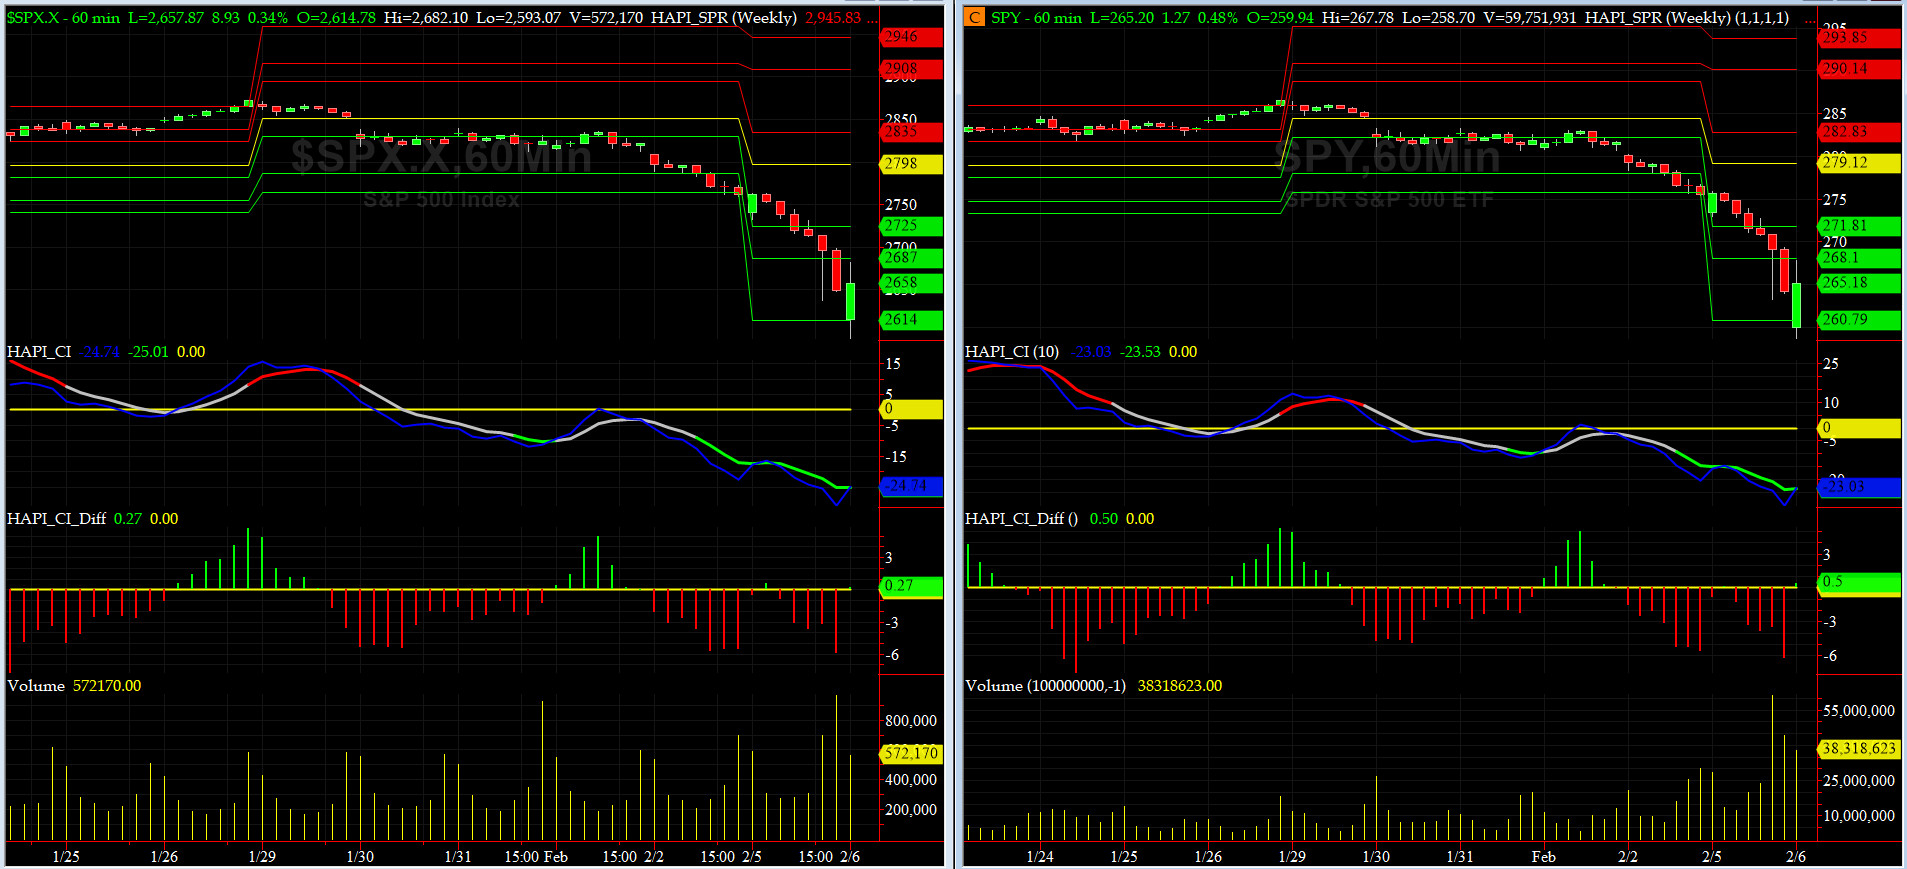
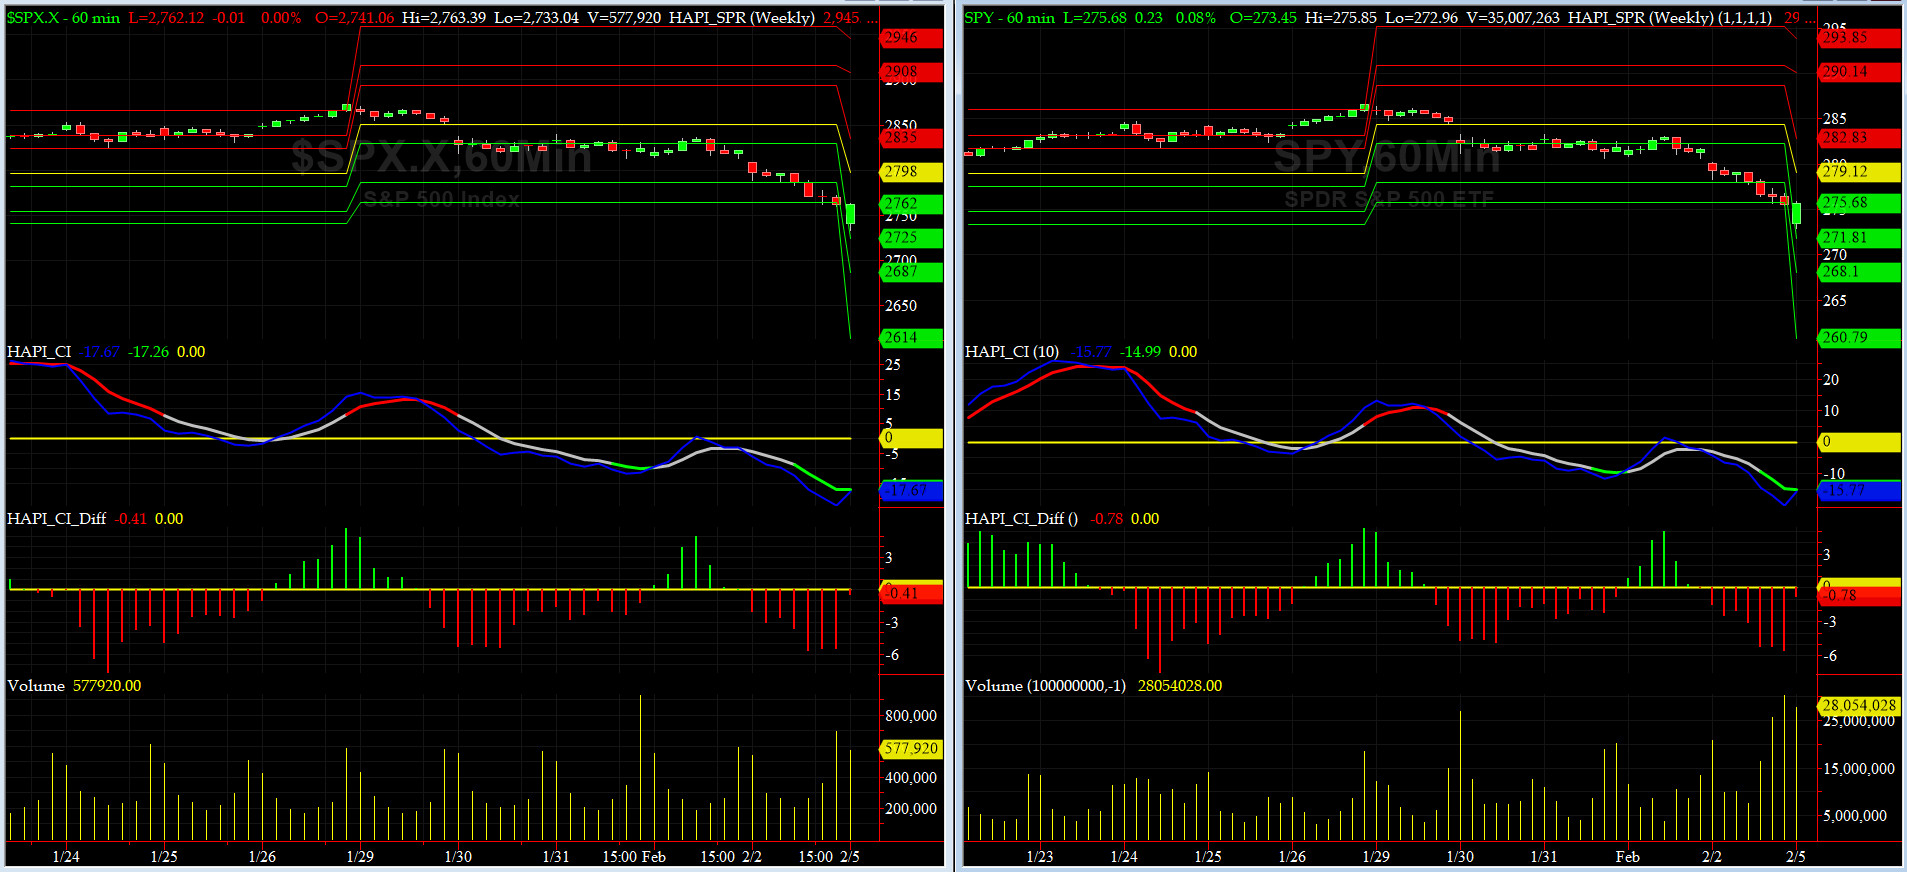
Most recent S&P-500 Cash Index (SPX): 2762.13 down -111.74 (down -3.88%) for the week ending on Friday, February 2, 2018, which closed about its -1 sigma.
SPX ALL TIME INTRADAY HIGH = 2872.87 (reached on Friday, Jan 26, 2018)
SPX ALL TIME CLOSING HIGH = 2872.87 (reached on Friday, Jan 26, 2018)
Current DAILY +2 Sigma SPX = 2879 with WEEKLY +2 Sigma = 2848
Current DAILY 0 Sigma (20 day MA) SPX = 2802 with WEEKLY 0 Sigma = 2647
Current DAILY -2 Sigma SPX = 2725 with WEEKLY -2 Sigma = 2446
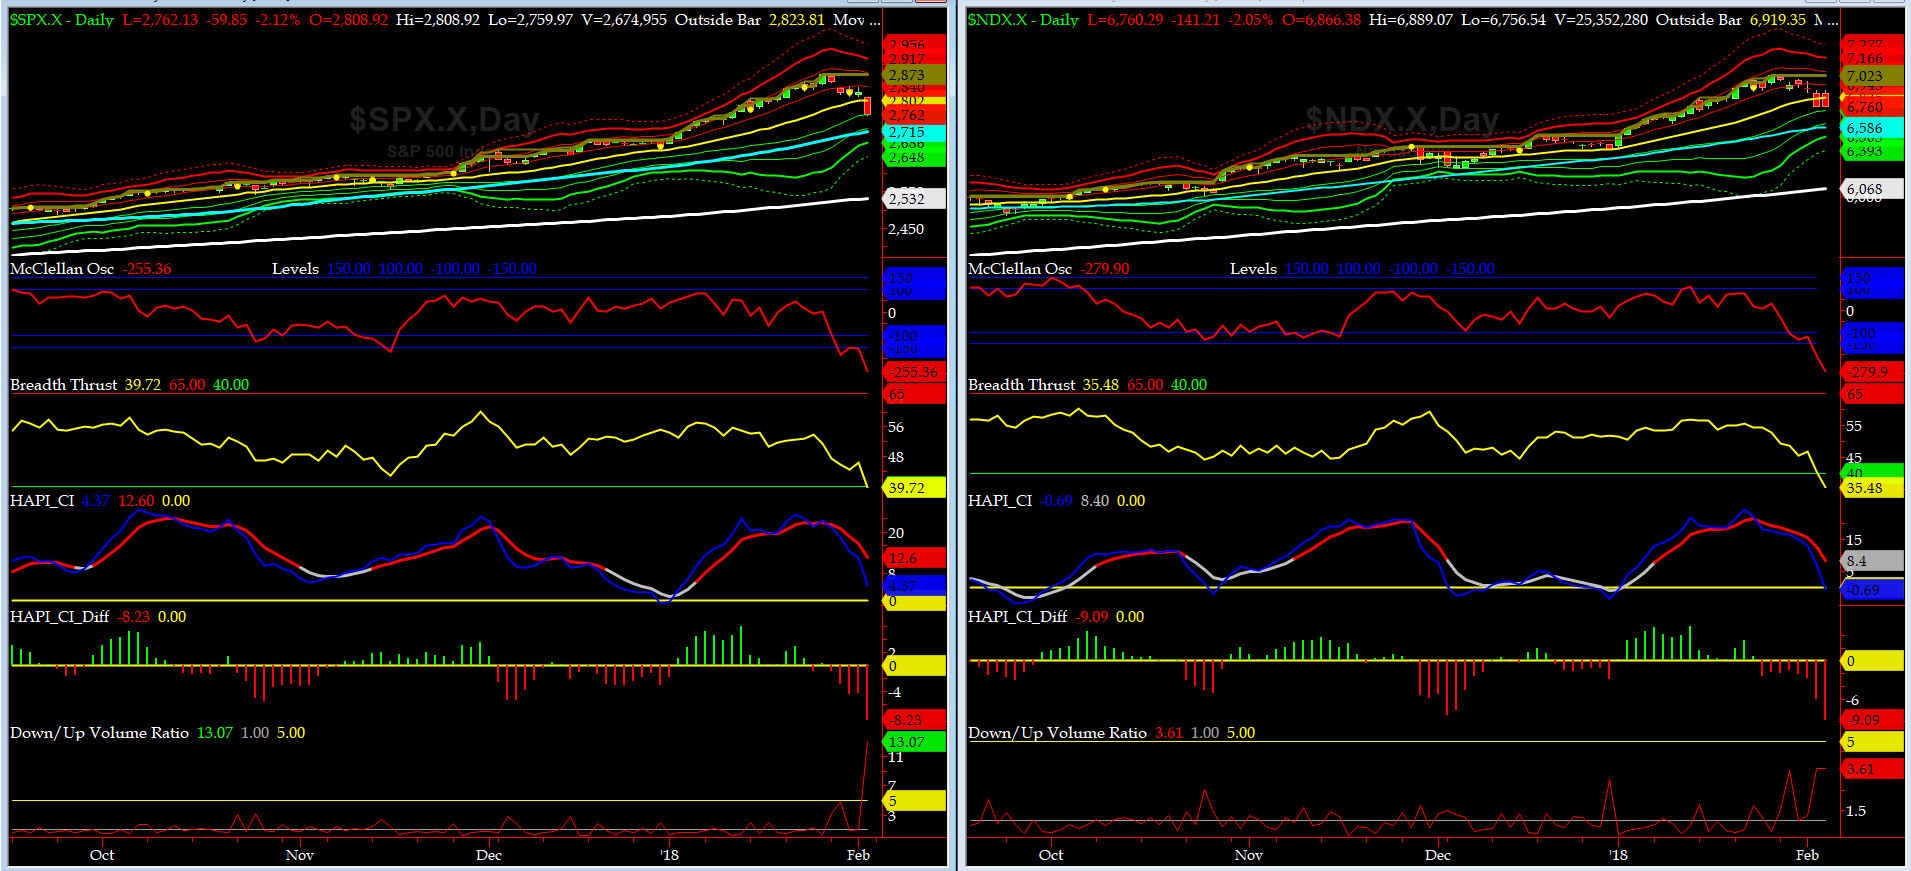
NYSE McClellan Oscillator = -255 (-150 is start of the O/S area; around -275 to -300 area or lower, we go into the �launch-pad� mode, over +150, we are in O/B area)
NYSE Breadth Thrust = 39.7 (40 is considered as oversold and 65 as overbought)
Just when we thought it was safe, the sharks showed up, circling our positions..... truth to be told, we welcome the return of volatility and expect that both our equity and bond markets will finally begin to show a sense of normalcy. Of course, this transition shall be violent, specially for the uninitiated.
MOVING FORWARD: NYSE Down to Up Volume Ratio hit 13+ which we have not seen since Sept 2016 (about 7 weeks before Presidential Elections). We do not think this is the bottom rather a small speed bump in a form of dead cat bounce.
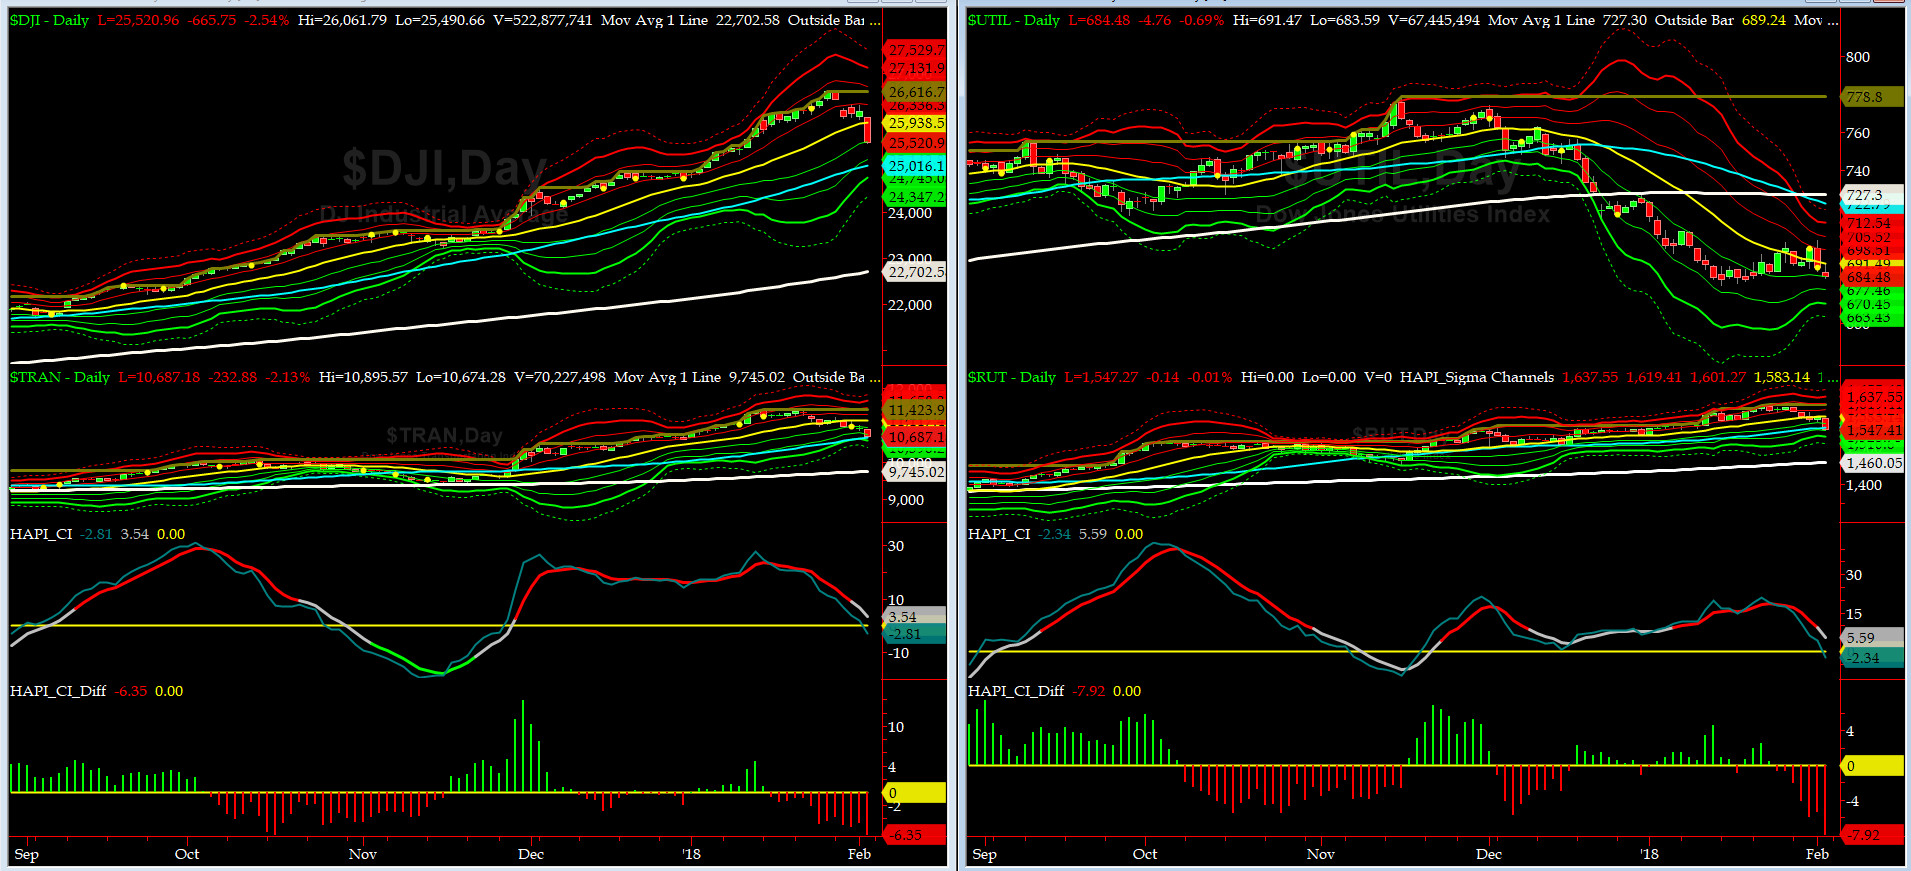
Canaries [in the Coal Mine] Chart for DJ TRAN & RUT Indices
200-Day MA DJ TRAN = 9745 or 9.7% above DJ TRAN (max observed in last 7 yrs = 20.2%, min = -20.3%)
200-Day MA RUT = 1460 or 6% above RUT (max observed in last 7 yrs = 21.3%, min = -22.6%)
DJ Transportation Index (proxy for economic conditions 6 to 9 months hence) took a huge dive this past week and stopped near its 50day MA .
Russell 2000 Small Caps Index (proxy for Risk ON/OFF) had a similar sell off but overshot its 50day MA. RISKY assets are being repriced on-the-run.
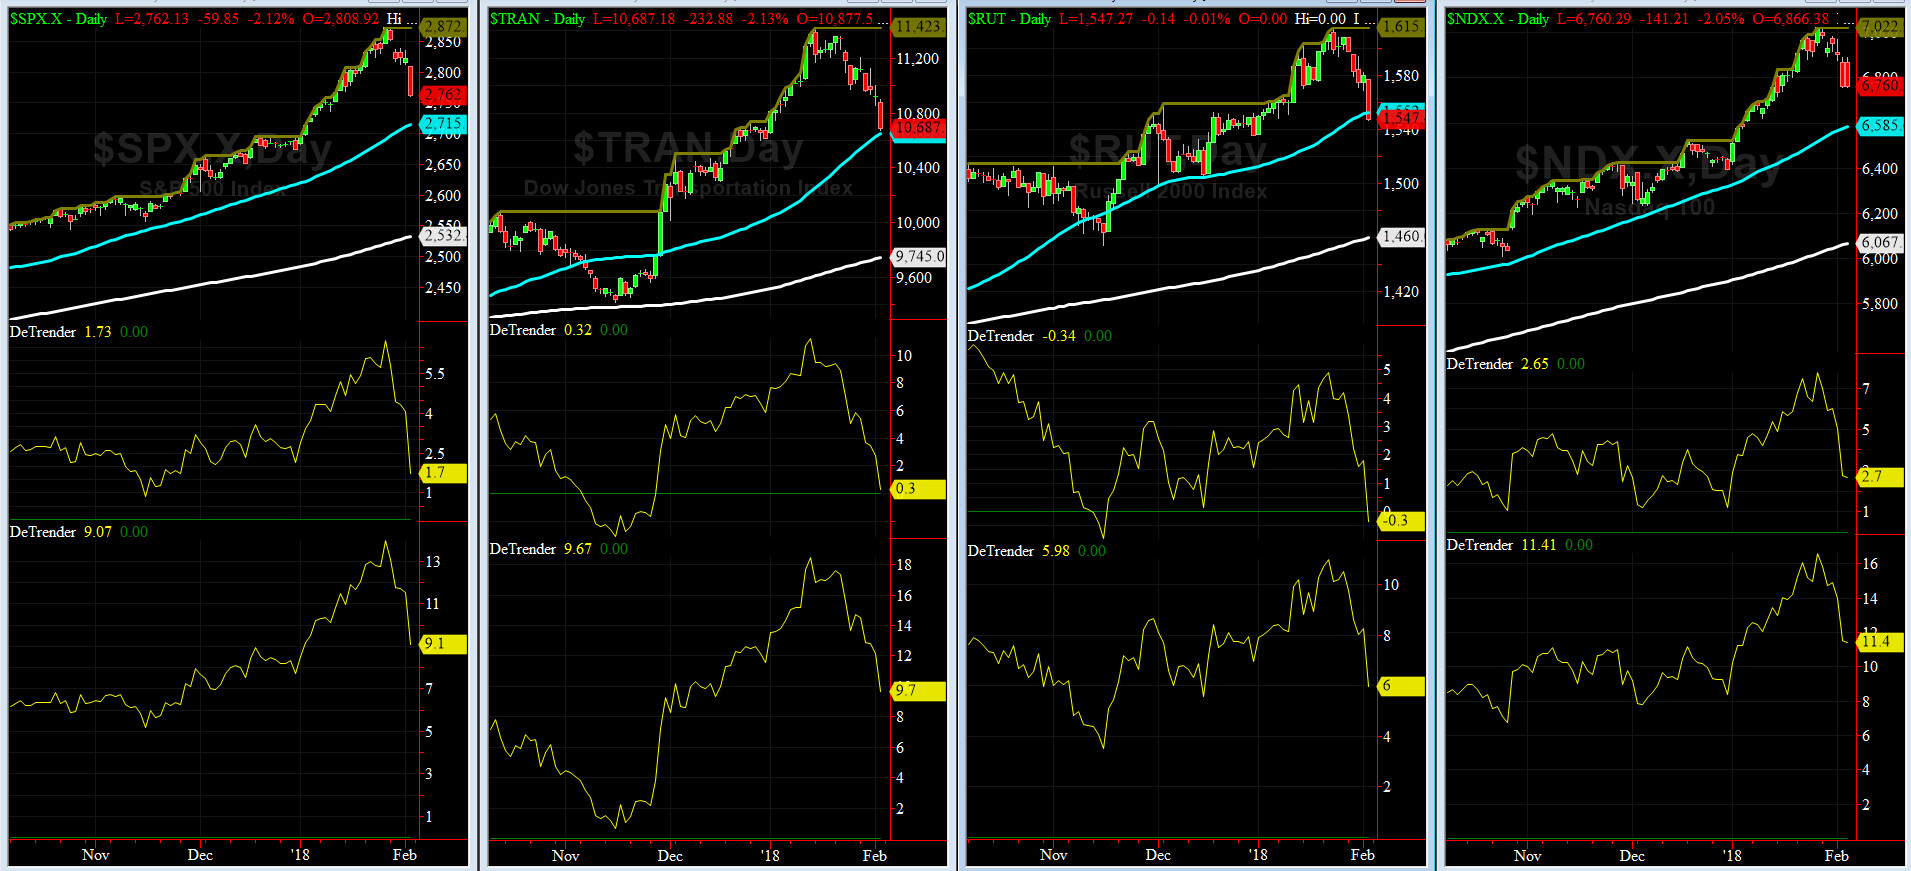
DeTrenders Charts for SPX, NDX, TRAN & RUT Indices
50-Day MA SPX = 2715 or 1.7% below SPX (max observed in last 7 yrs = +8.6%, min = -9.3%)
200-Day MA SPX = 2532 or 9.1% below SPX (max observed in last 7 yrs = 15.2%, min = -14%)
SEVEN of our EIGHT DeTrenders are in POSITIVE territory. The DeTrenders for DJ Tran & RUT will continue to be harbingers of future price behavior in broad indices.
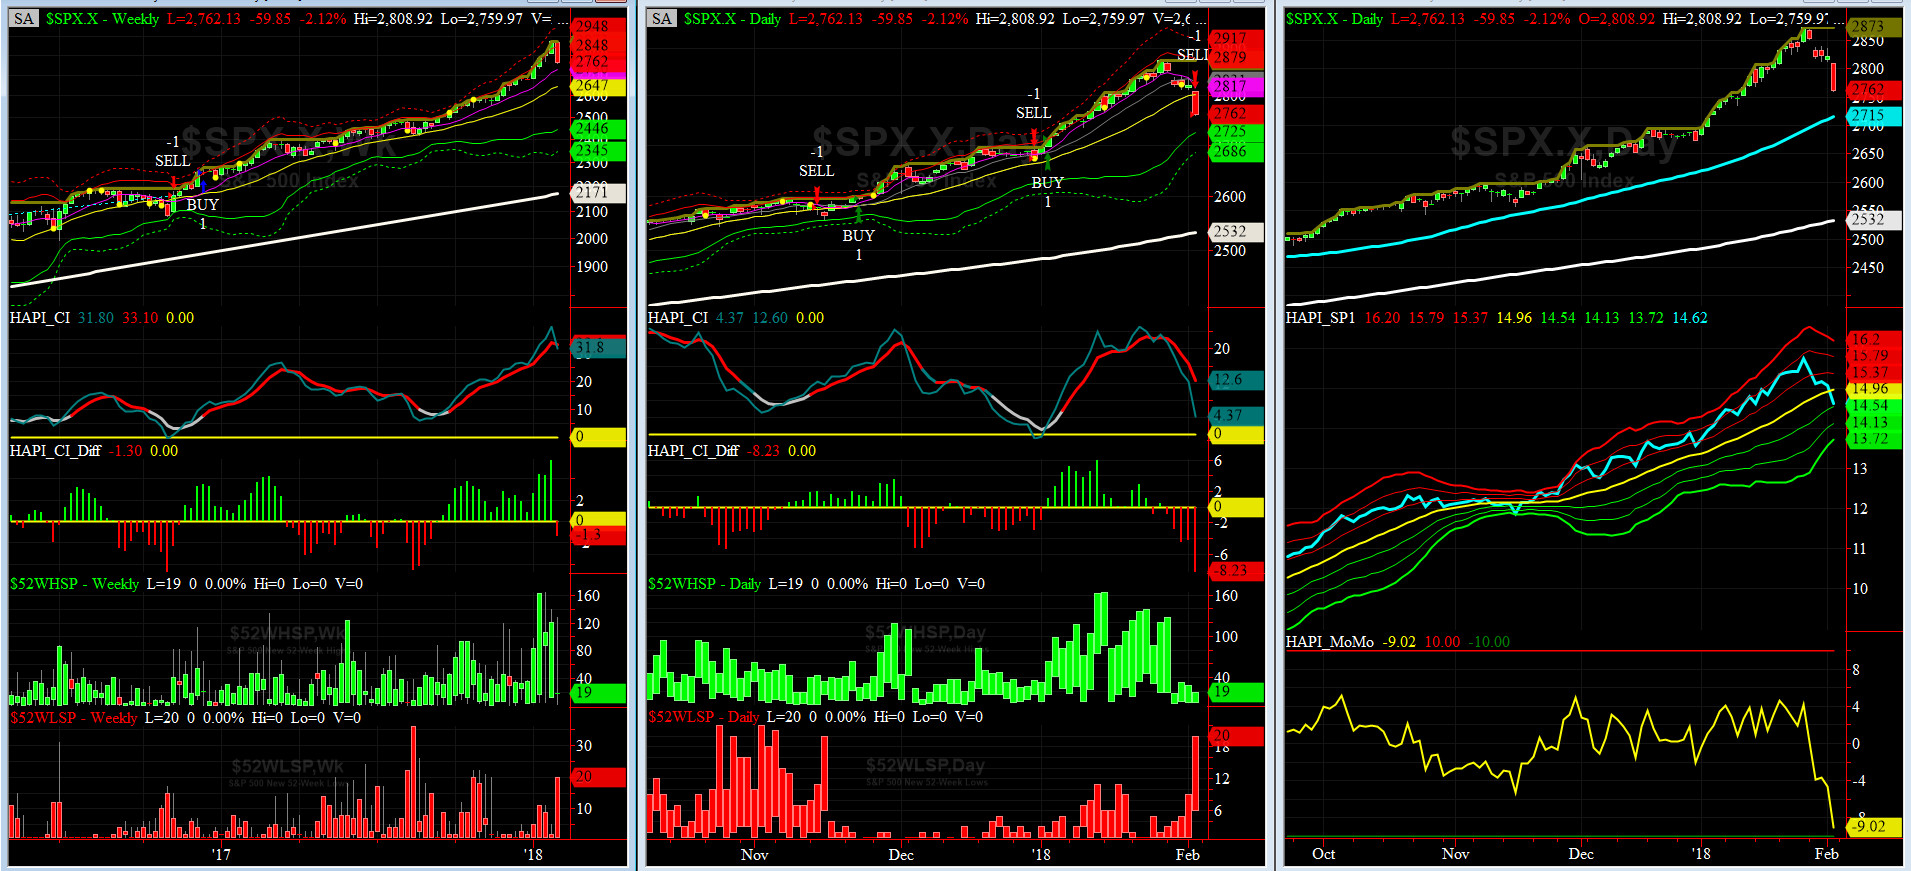
HA_SP1_Momo Chart
WEEKLY Timing Model = on a BUY Signal since Friday 12/16/16 CLOSE at 2258
DAILY Timing Model = on a SELL Signal since Friday 2/2/18 CLOSE at 2762
Max SPX 52wk-highs reading last week = 128 (over 120-140, the local maxima is in)
Max SPX 52wk-Lows reading last week = 20 (over 40-60, the local minima is in)
HA_SP1 closed near its -1 sigma channels
HA_Momo = -9 (reversals most likely occur above +10 or below -10)
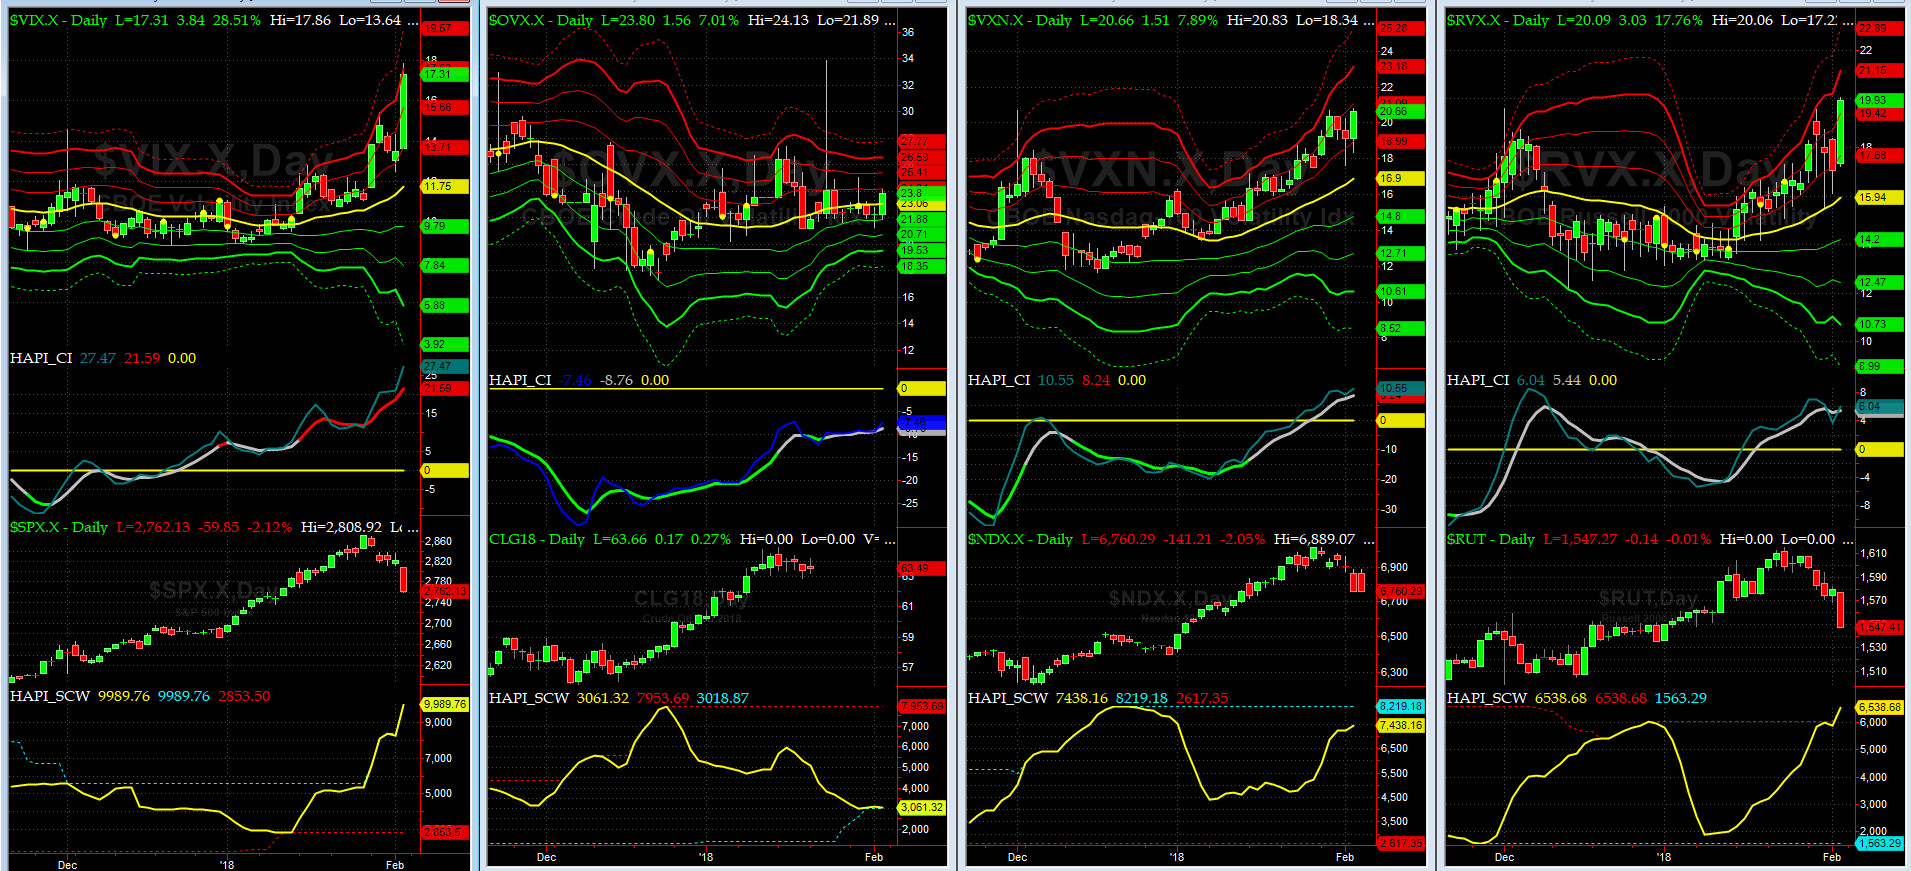
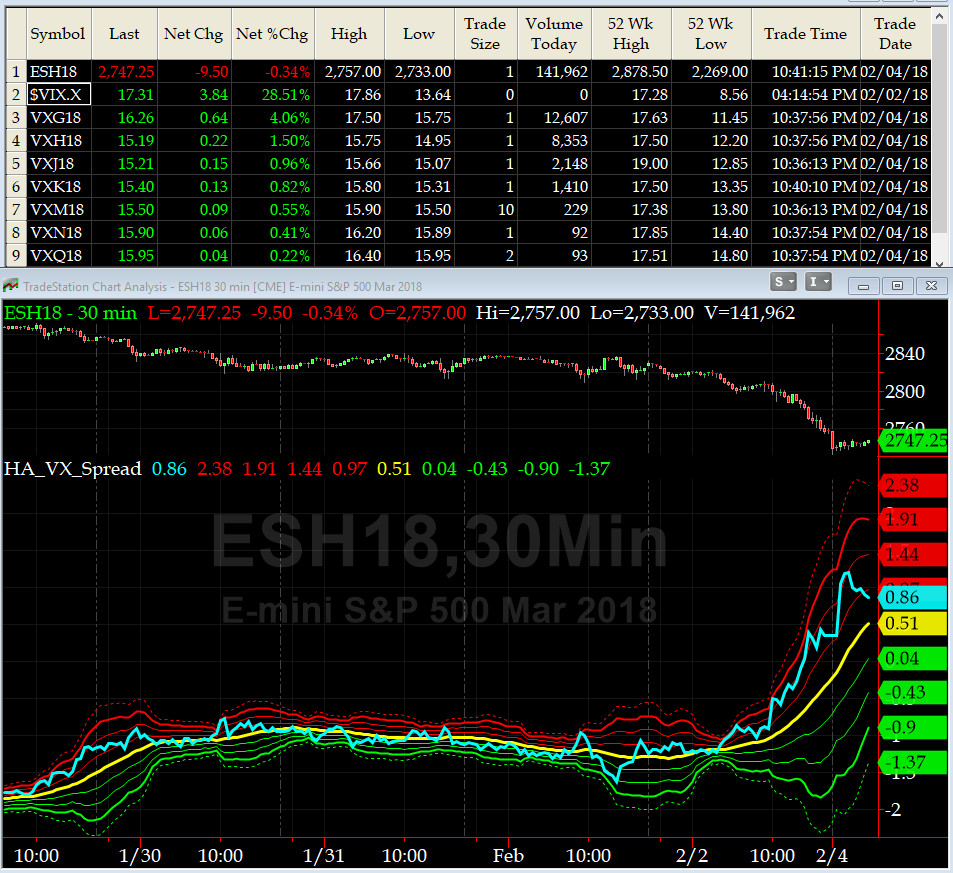
Vol of the Vols Chart
VIX currently stands at 17.3, at about its +3 sigma (remember it's the VIX volatility pattern aka "its sigma channels" that matters, and not the level of VIX itself (this is per Dr. Robert Whaley, a great mentor and inventor of original VIX, now called VXO). VIX usually peaks around a test of its +4 sigma).
We saw another tumultuous week for VIX and most likely, since have not seen the completion of this shockwave, our thinking says that we have not seen the bottom yet.
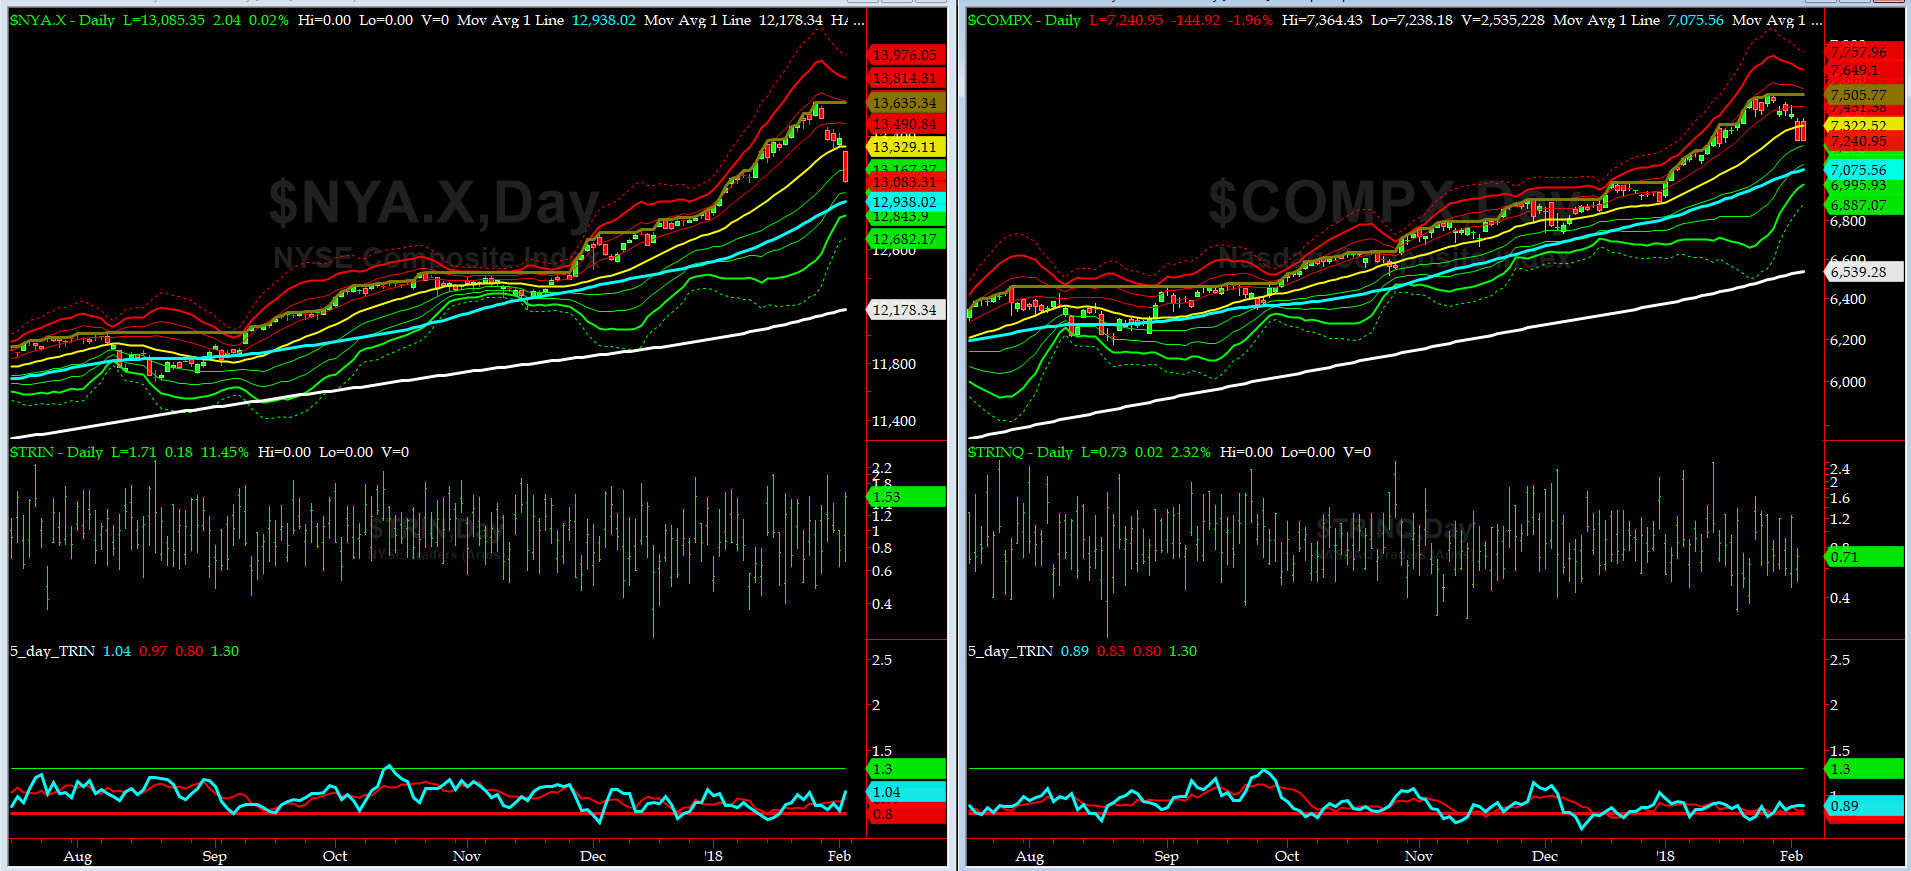
5-day TRIN & TRINQ Charts
Both NYSE & NASDAQ 5-day TRINs are trading in NEUTRAL zone.
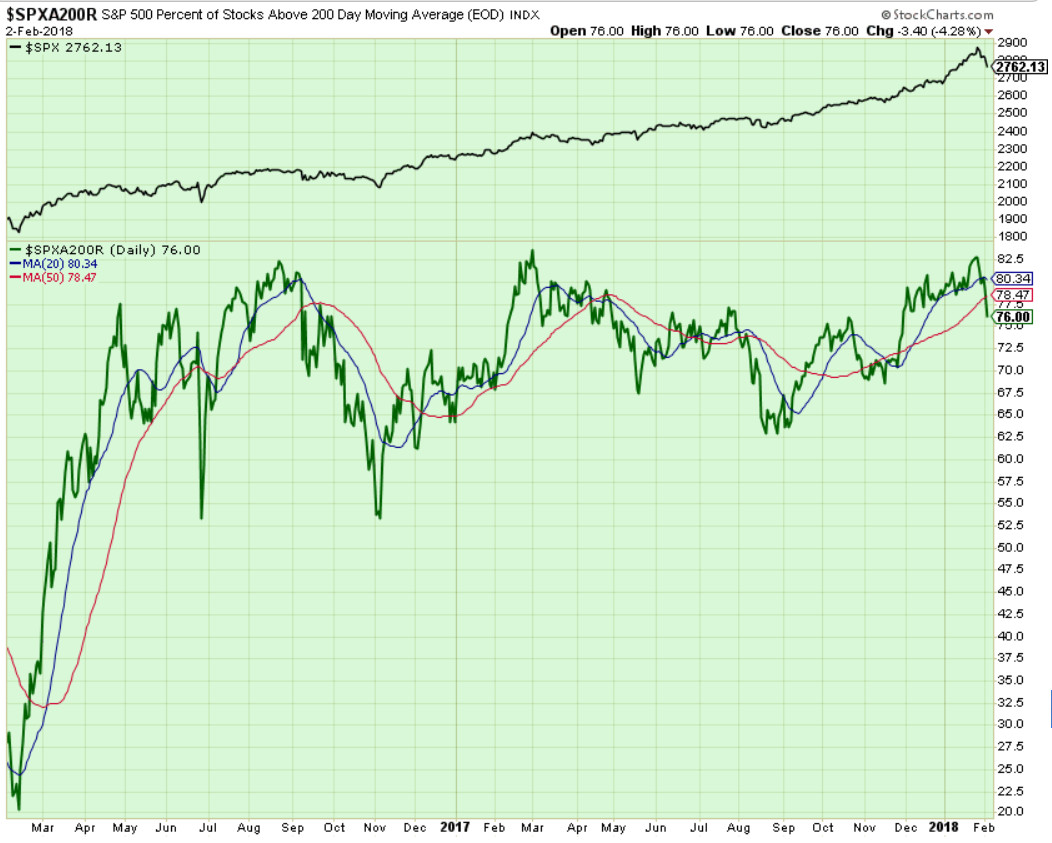
Components of SPX above their respective 200day MA Chart
This scoring indicator reversed hard this past week and dropped to 76, in line with price. NO SIGNAL HERE.
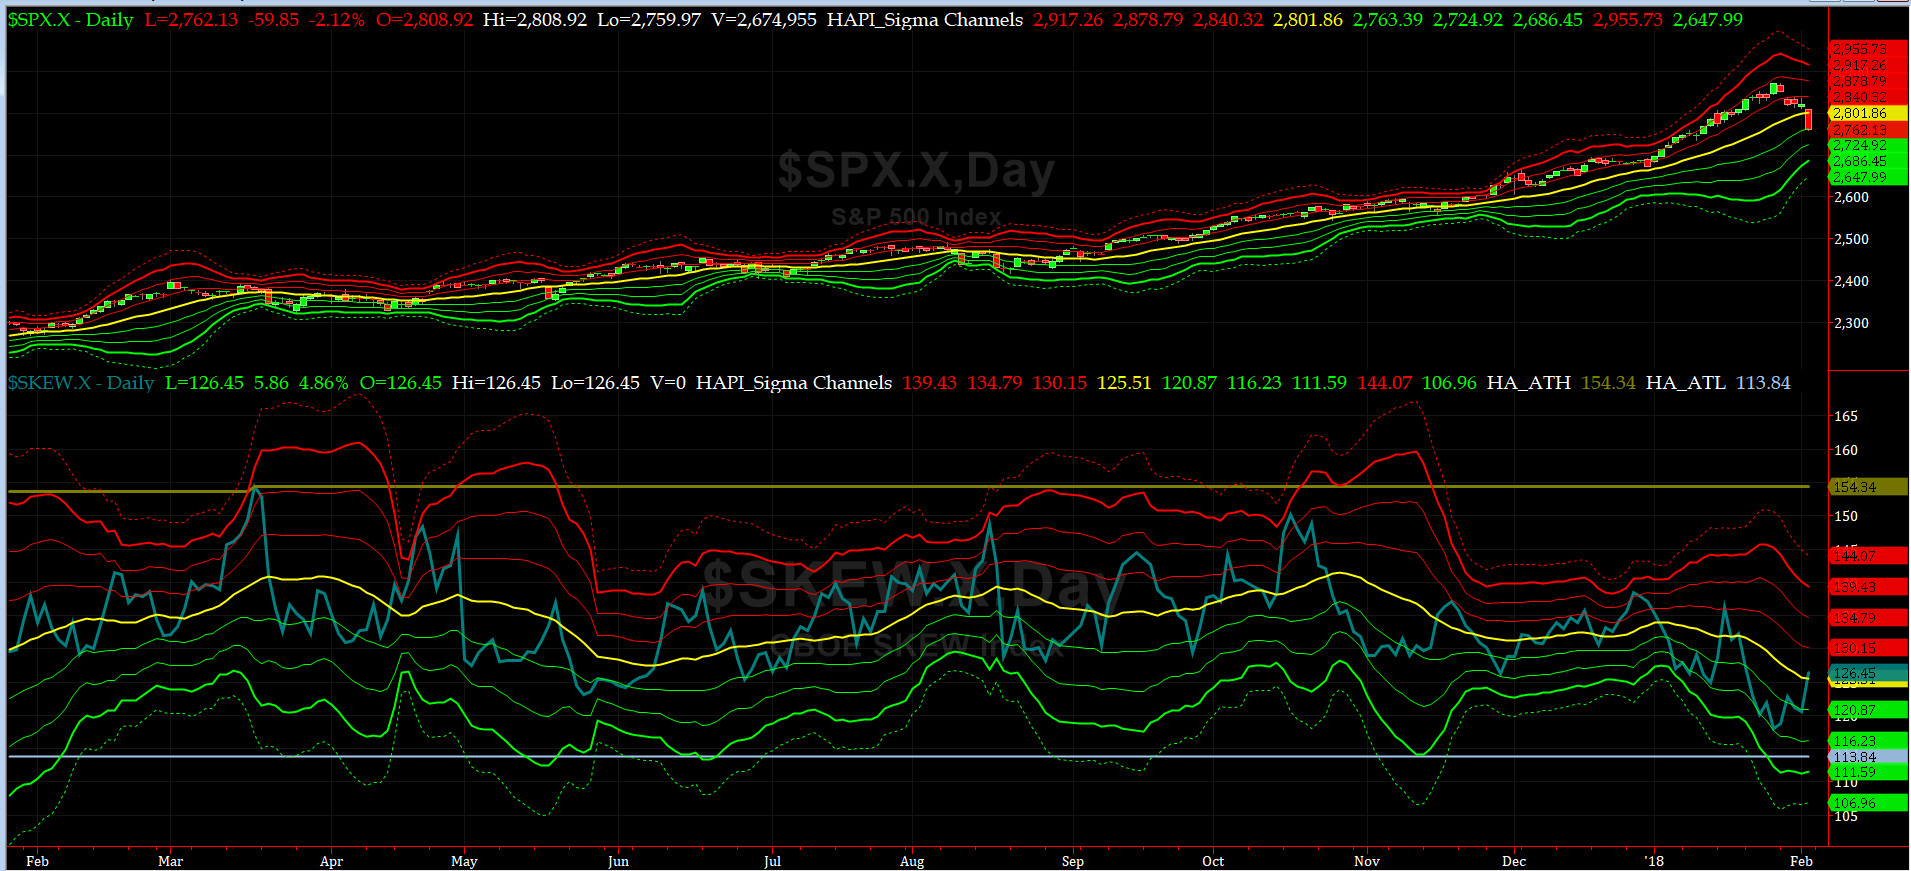
SPX SKEW (Tail Risk) Chart
Last week SPX SKEW (Tail Risk) closed at ~126, or about its zero sigma (normal = 120-125, range 100-150).
Is all quiet on the Eastern & Mid-Western Fronts? Smart Money not returning our calls!!
How to interpret the value of SPX SKEW? (from CBOE white paper on SKEW)

3-month VIX Futures Spread(VX) Chart
This popular timing indicator, now long Feb, short May VIX Futures again closed +0.35. Is the bottom in? well, may be but most likely, we should see a dead cat bounce and a retest.
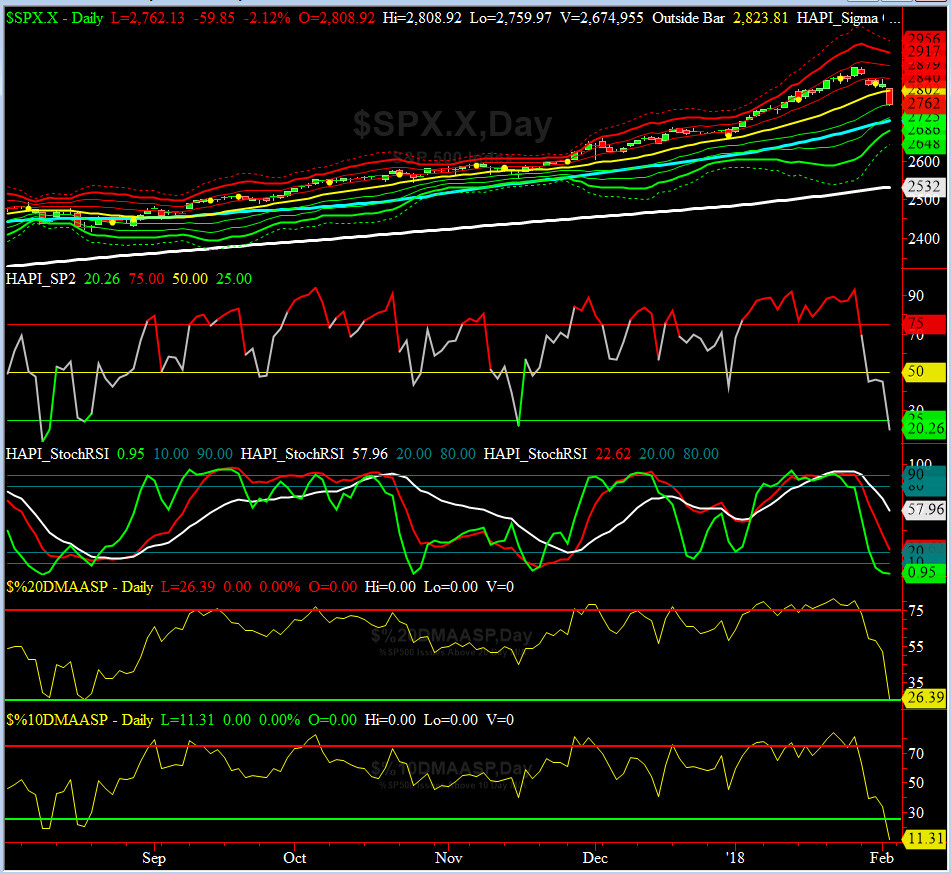
HA_SP2 Chart
HA_SP2 = 20.26 (Buy signal <= 25, Sell Signal >= 75)
This coveted timing indicator, having moved over 73 handle in just one week (have not seen this size move since Brexit) now says we are uber oversold.
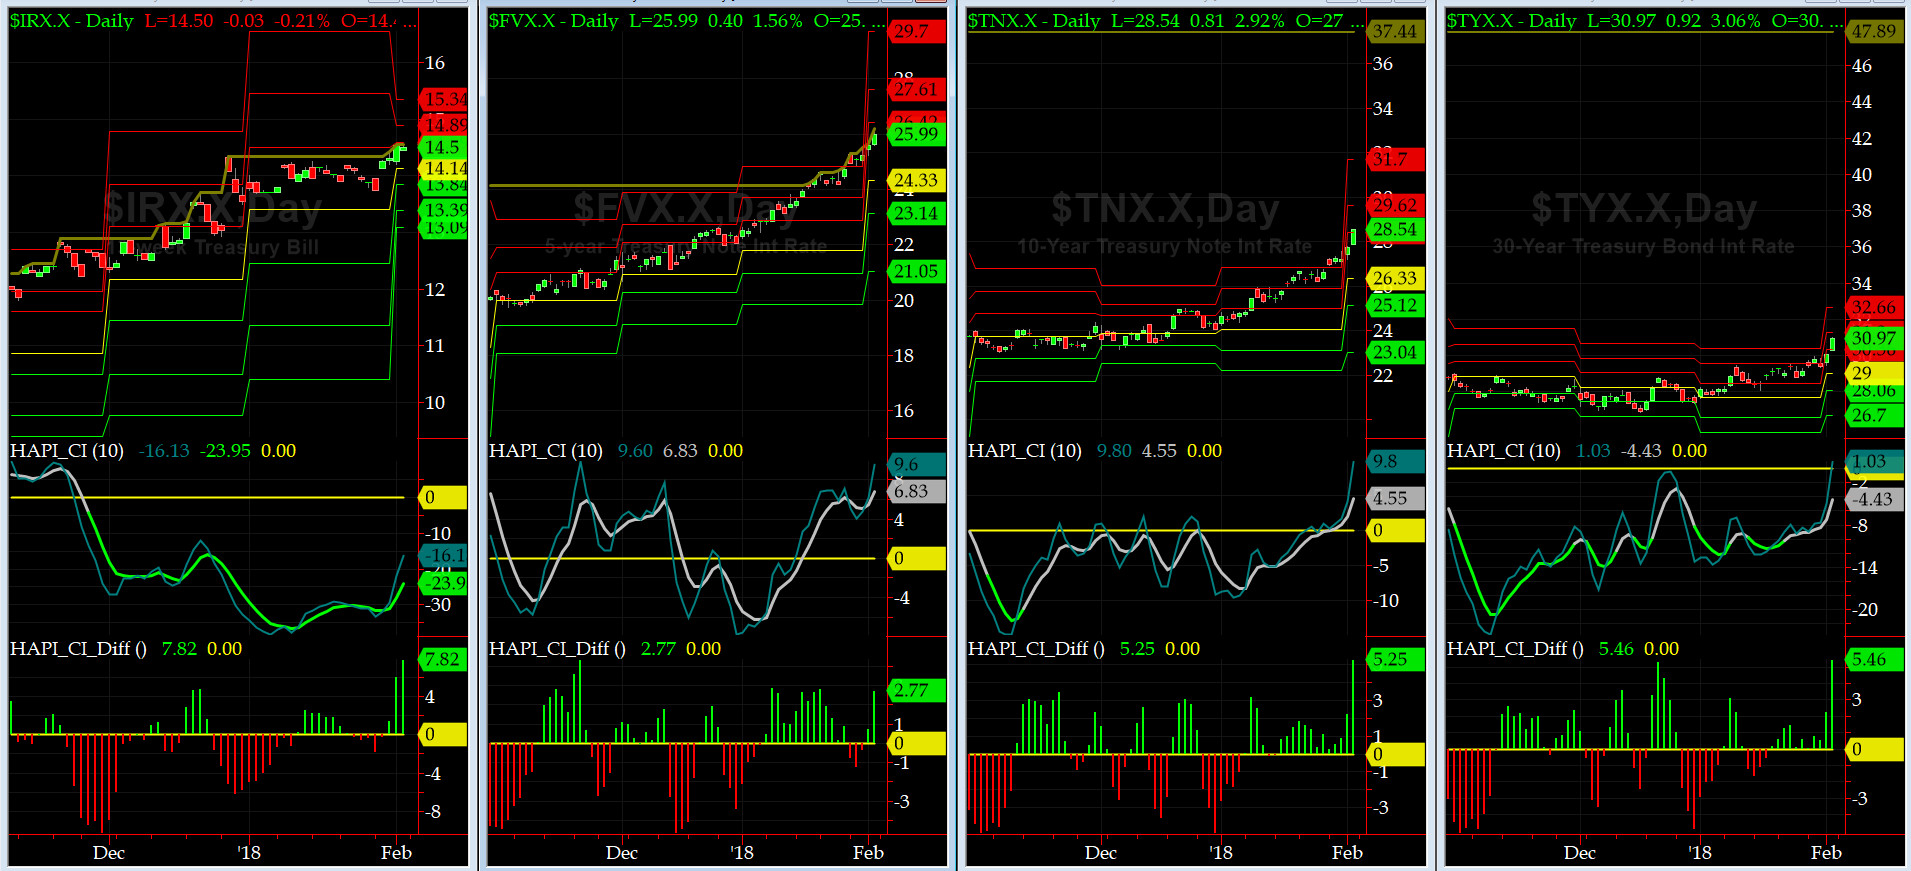
US Treasury T-Notes & T-Bonds Yields Chart
During this past week, the Treasury Curve sold off hard, specially after Jan NFP was out. Economy is on the mend and lenders want a tad more for their vig & our dear friend, Maury agrees.
Fari Hamzei
|


 Proactive Market Timing