|
Monday, February 19, 2018, 2230ET
Market Timing Charts, Analysis & Commentary for Issue #229
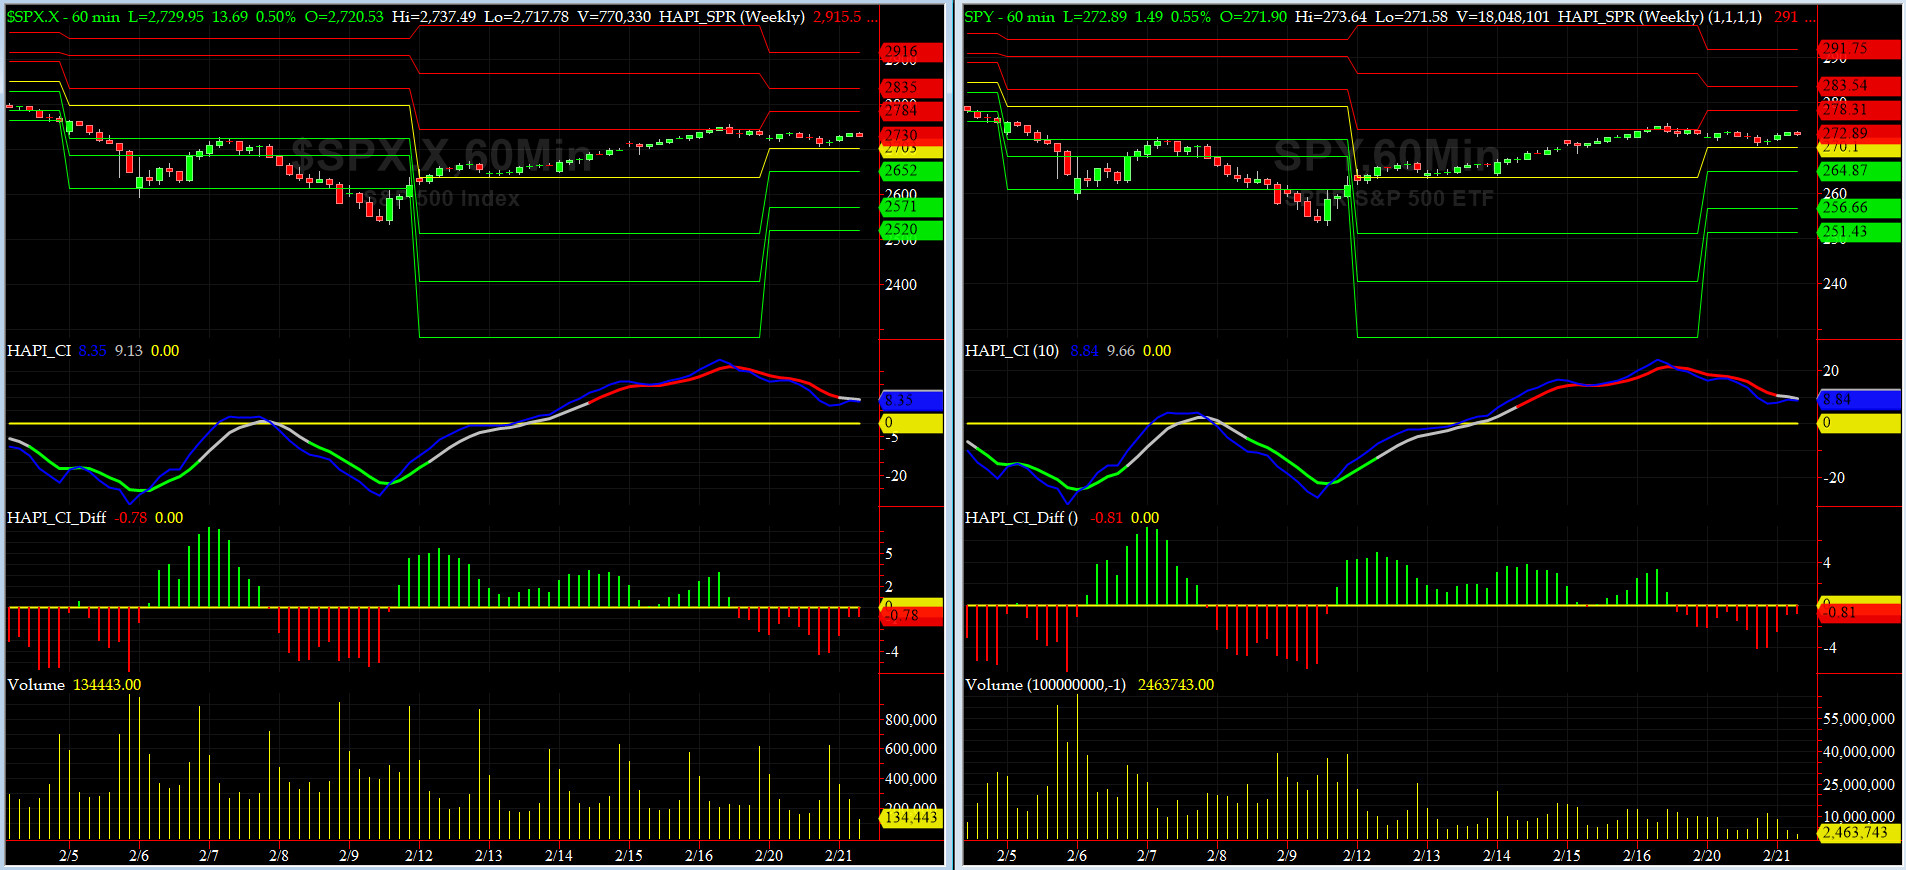
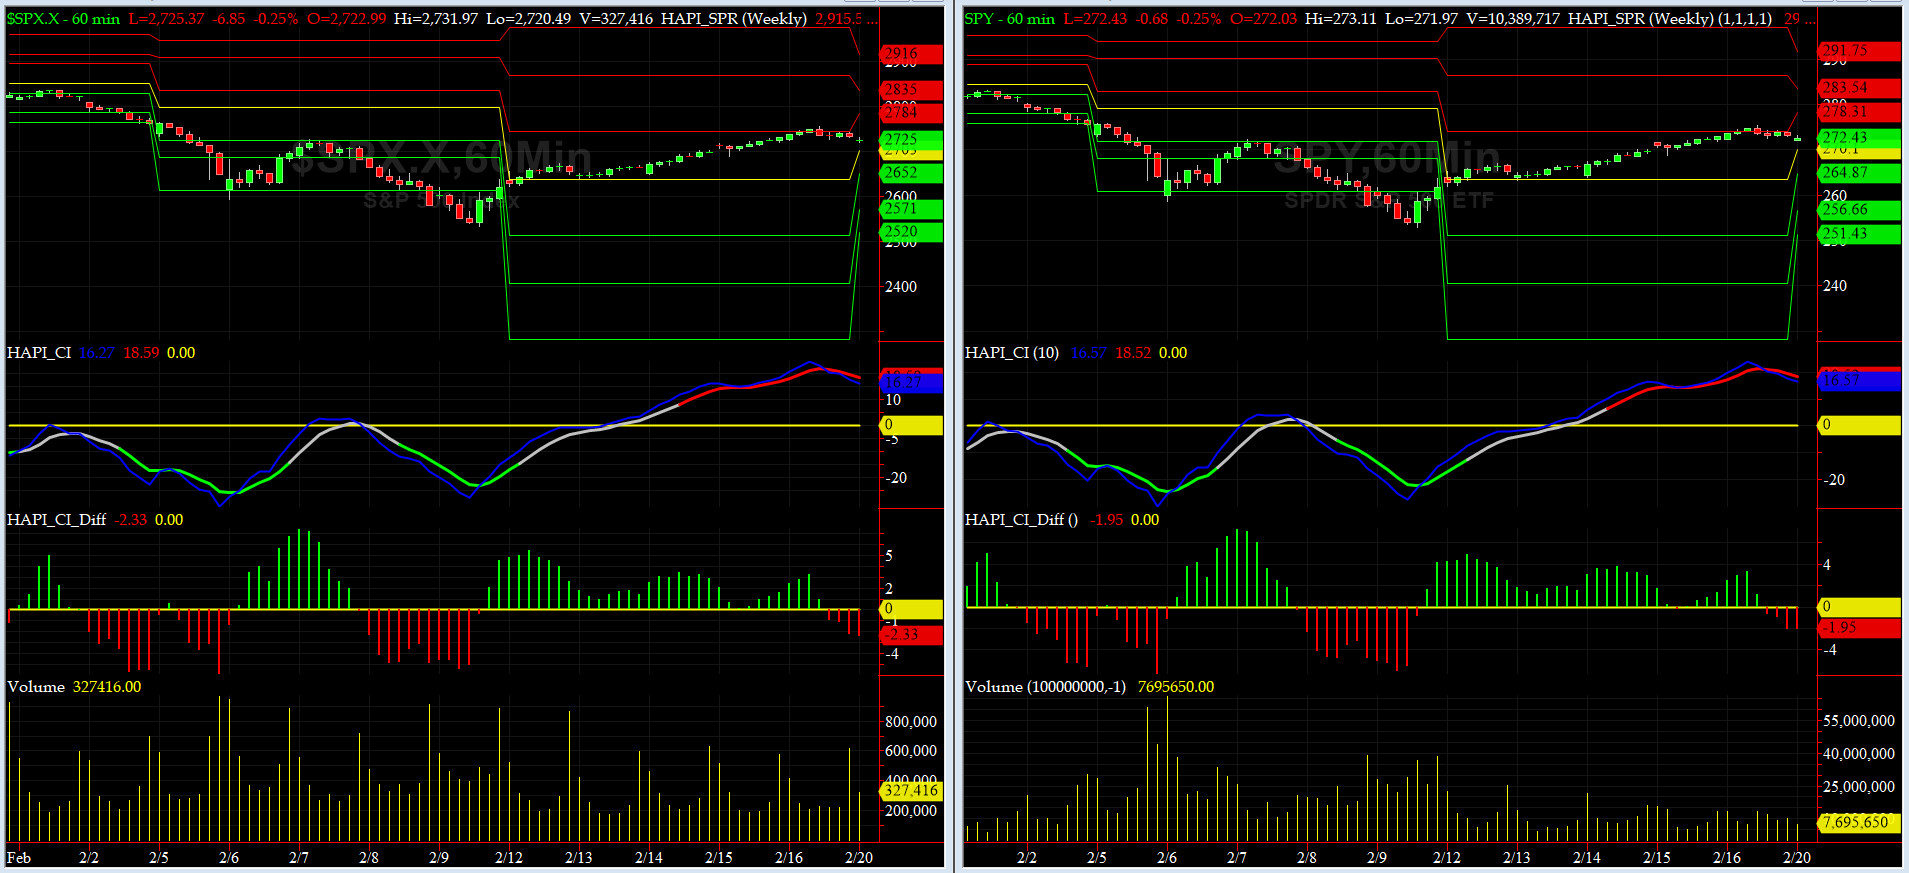
Timer Charts of S&P-500 Cash Index (SPX) + NASDAQ-100 Cash Index (NDX)
Most recent S&P-500 Cash Index (SPX): 2732.22 up +112.67 (up +4.3%) for the week ending on Friday, February 16, 2018, which closed about its zero sigma.
SPX ALL TIME INTRADAY HIGH = 2872.87 (reached on Friday, Jan 26, 2018)
SPX ALL TIME CLOSING HIGH = 2872.87 (reached on Friday, Jan 26, 2018)
Current DAILY +2 Sigma SPX = 2927 with WEEKLY +2 Sigma = 2846
Current DAILY 0 Sigma (20 day MA) SPX = 2751 with WEEKLY 0 Sigma = 2663
Current DAILY -2 Sigma SPX = 2574 with WEEKLY -2 Sigma = 2480
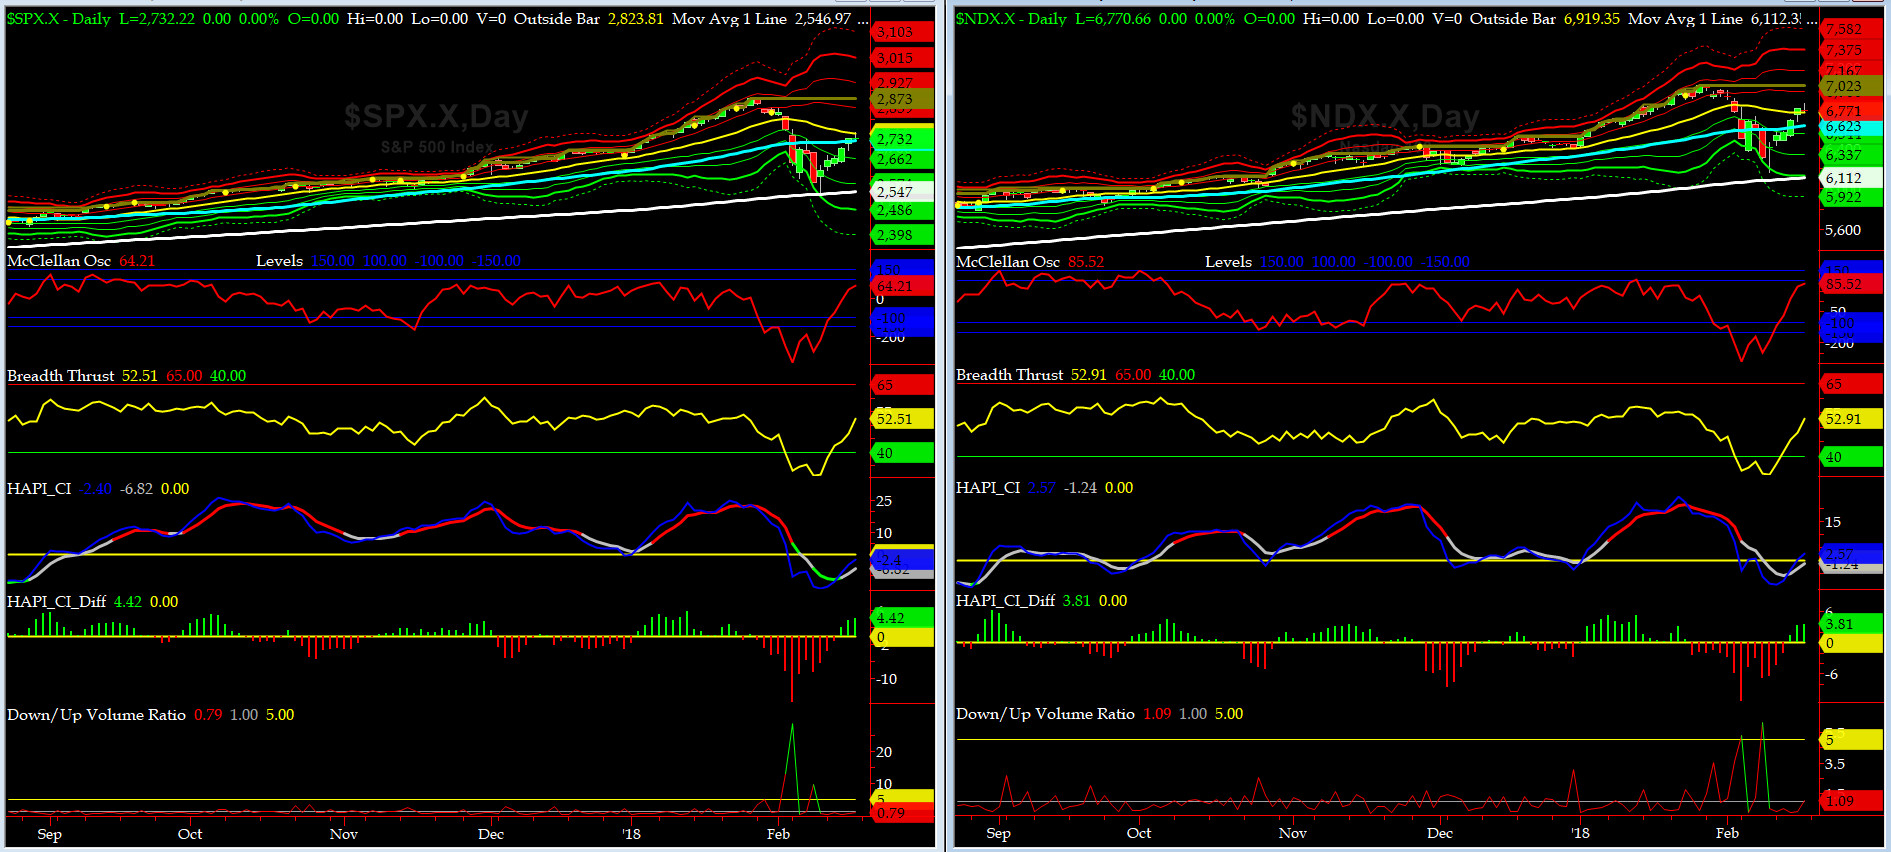
NYSE McClellan Oscillator = +64 (-150 is start of the O/S area; around -275 to -300 area or lower, we go into the �launch-pad� mode, over +150, we are in O/B area)
NYSE Breadth Thrust = 52.5 (40 is considered as oversold and 65 as overbought)
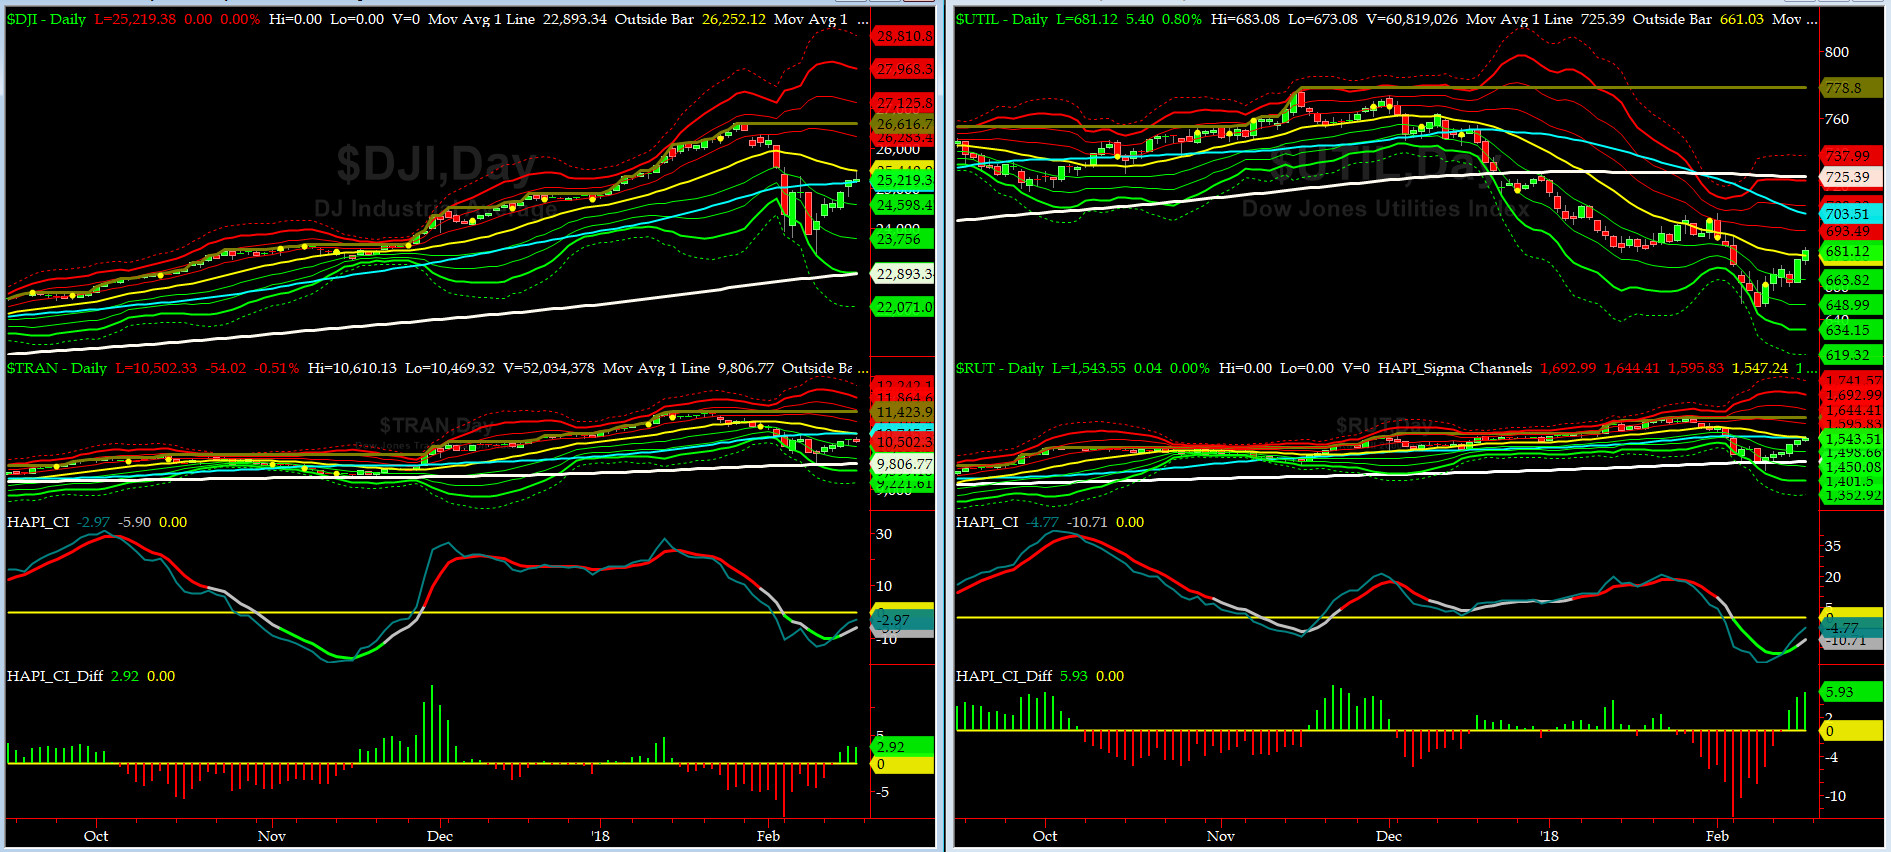
Canaries [in the Coal Mine] Chart for DJ TRAN & RUT Indices
200-Day MA DJ TRAN = 9806 or 7.1% above DJ TRAN (max observed in last 7 yrs = 20.2%, min = -20.3%)
200-Day MA RUT = 1465 or 5.3% above RUT (max observed in last 7 yrs = 21.3%, min = -22.6%)
DJ Transportation Index (proxy for economic conditions 6 to 9 months hence) had a huge week and rallied close to its 50Day bar after having bounced off its 200Day MA the Friday before.
Russell 2000 Small Caps Index (proxy for Risk ON/OFF, in like fashion, rallied hard from below its 200Dayt MA and rose to a tad above its 50Day MA. RISKY assets are coming back in vogue.
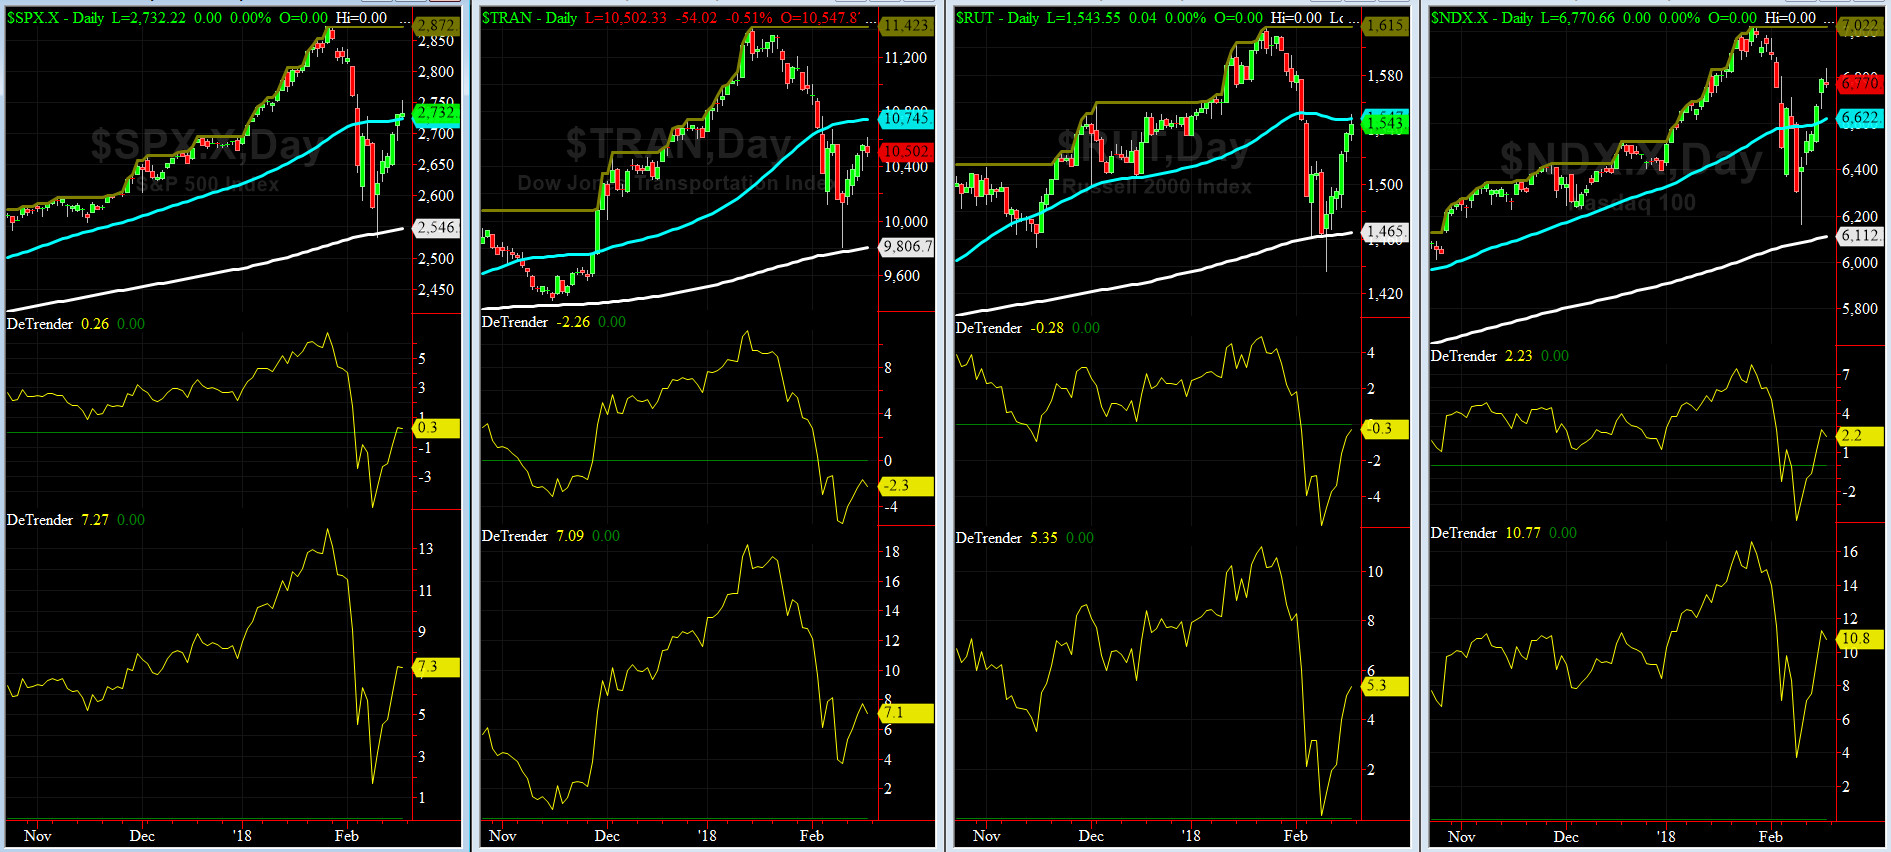
DeTrenders Charts for SPX, NDX, TRAN & RUT Indices
50-Day MA SPX = 2732 or 0.3% below SPX (max observed in last 7 yrs = +8.6%, min = -9.3%)
200-Day MA SPX = 2546 or 7.3% below SPX (max observed in last 7 yrs = 15.2%, min = -14%)
SIX of our EIGHT DeTrenders are in POSITIVE territory. The DeTrenders for DJ Tran & RUT will continue to be harbingers of future price behavior in broad indices.
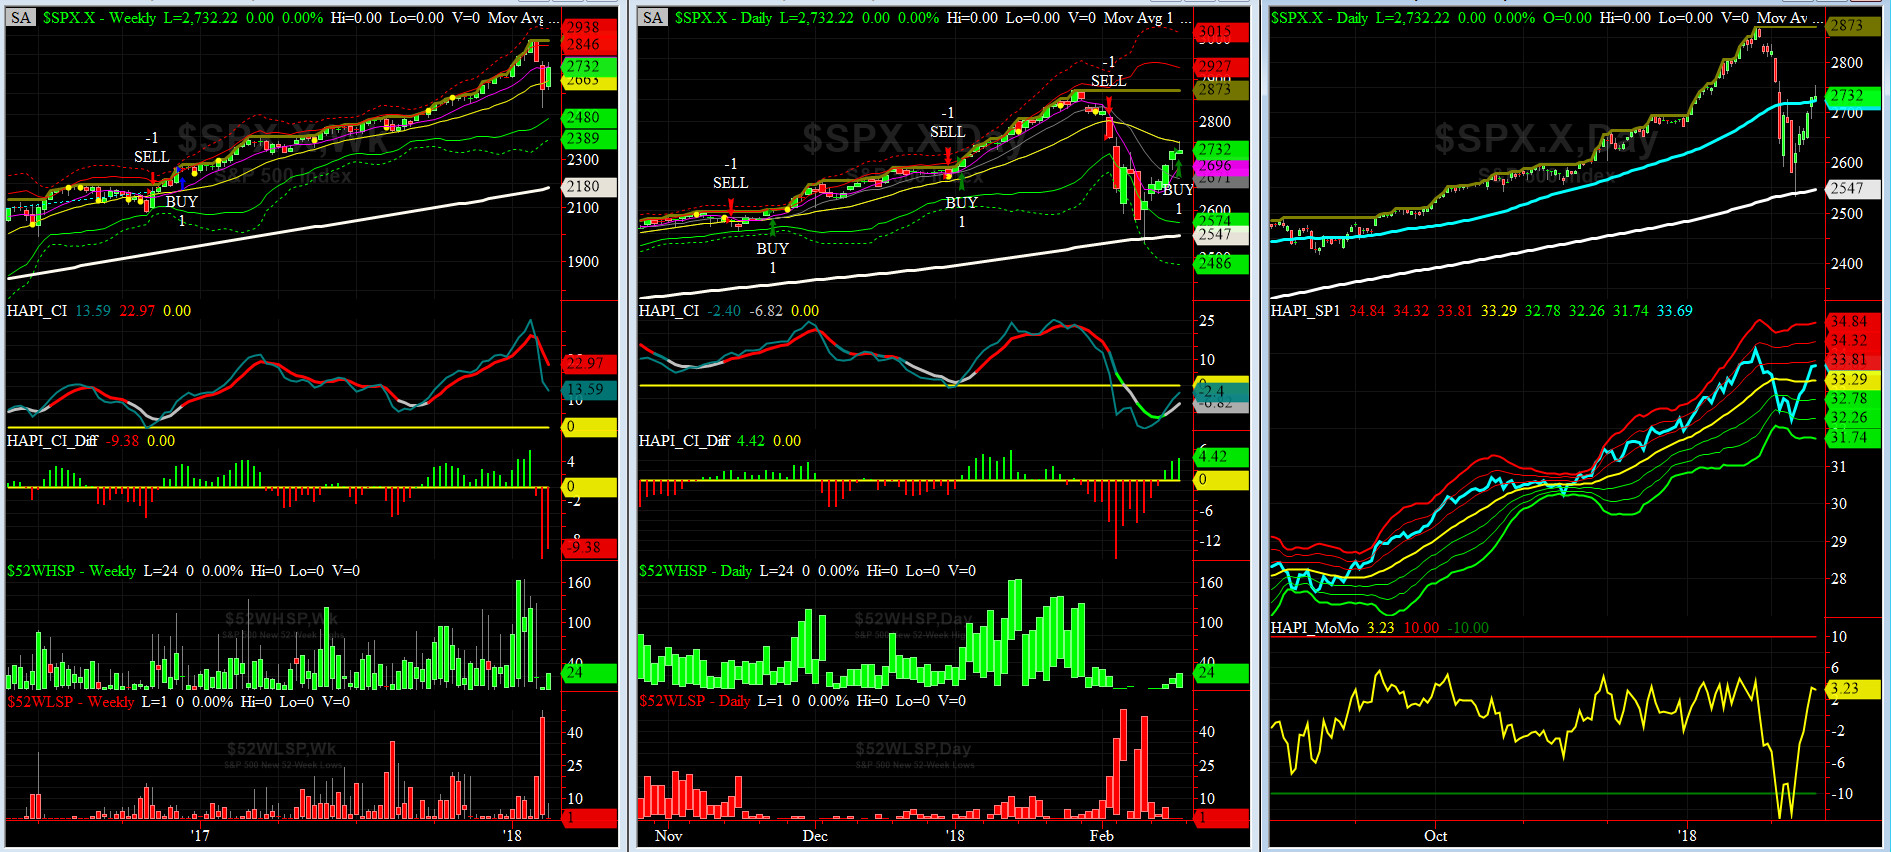
HA_SP1_Momo Chart
WEEKLY Timing Model = on a BUY Signal since Friday 12/16/16 CLOSE at 2258
DAILY Timing Model = on a BUY Signal since Friday 2/16/18 CLOSE at 2732
Max SPX 52wk-highs reading last week = 24 (over 120-140, the local maxima is in)
Max SPX 52wk-Lows reading last week = 8 (over 40-60, the local minima is in)
HA_SP1 closed near its +1 sigma channels
HA_Momo = +3.2 (reversals most likely occur above +10 or below -10)
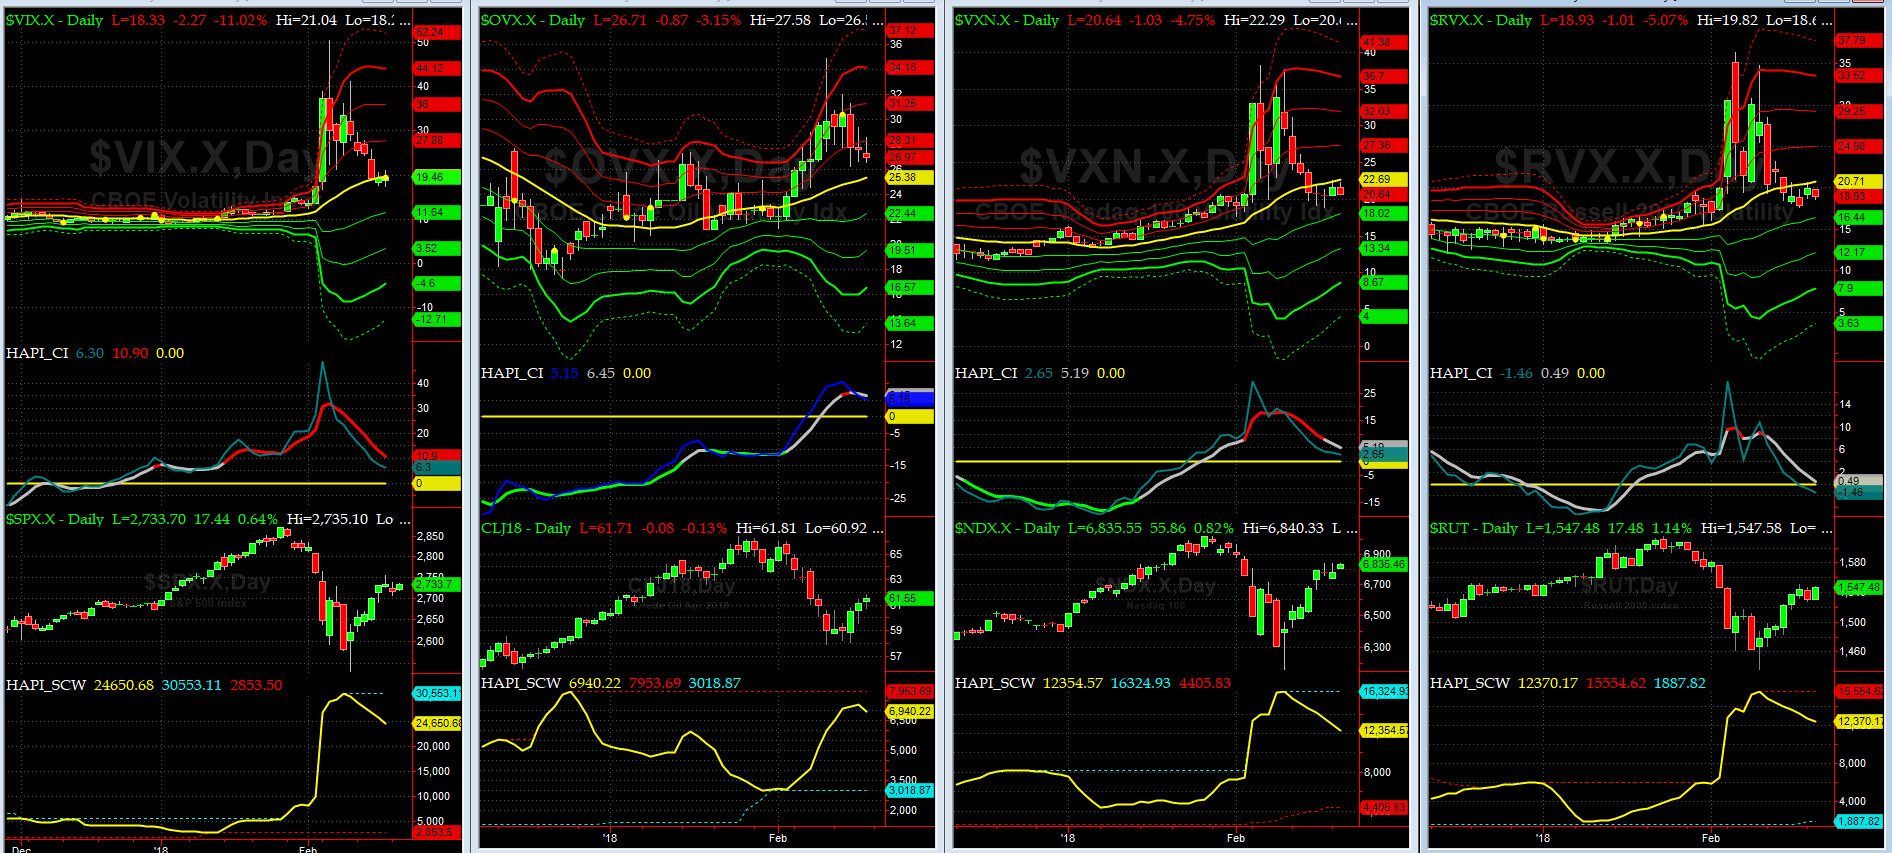
Vol of the Vols Chart
VIX currently stands at 19.5, at about its zero sigma (remember it's the VIX volatility pattern aka "its sigma channels" that matters, and not the level of VIX itself (this is per Dr. Robert Whaley, a great mentor and inventor of original VIX, now called VXO). VIX usually peaks around a test of its +4 sigma).
Bottom was in Feb 9th with lower high in spot VIX and we saw a strong contango in VX Futures.

5-day TRIN & TRINQ Charts
Both NYSE & NASDAQ 5-day TRINs are trading in SELL zone now.
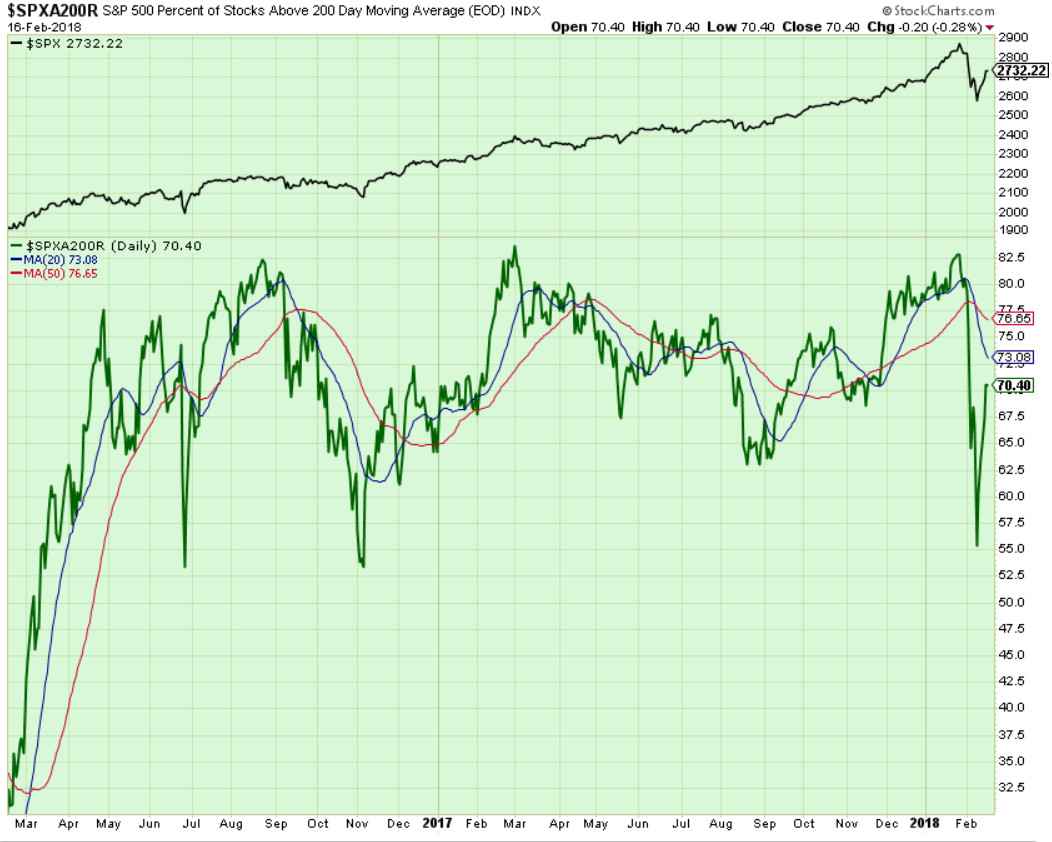
Components of SPX above their respective 200day MA Chart
This scoring indicator reversed up this past week and rallied hard from 55 to almost 71. NO SIGNAL HERE.
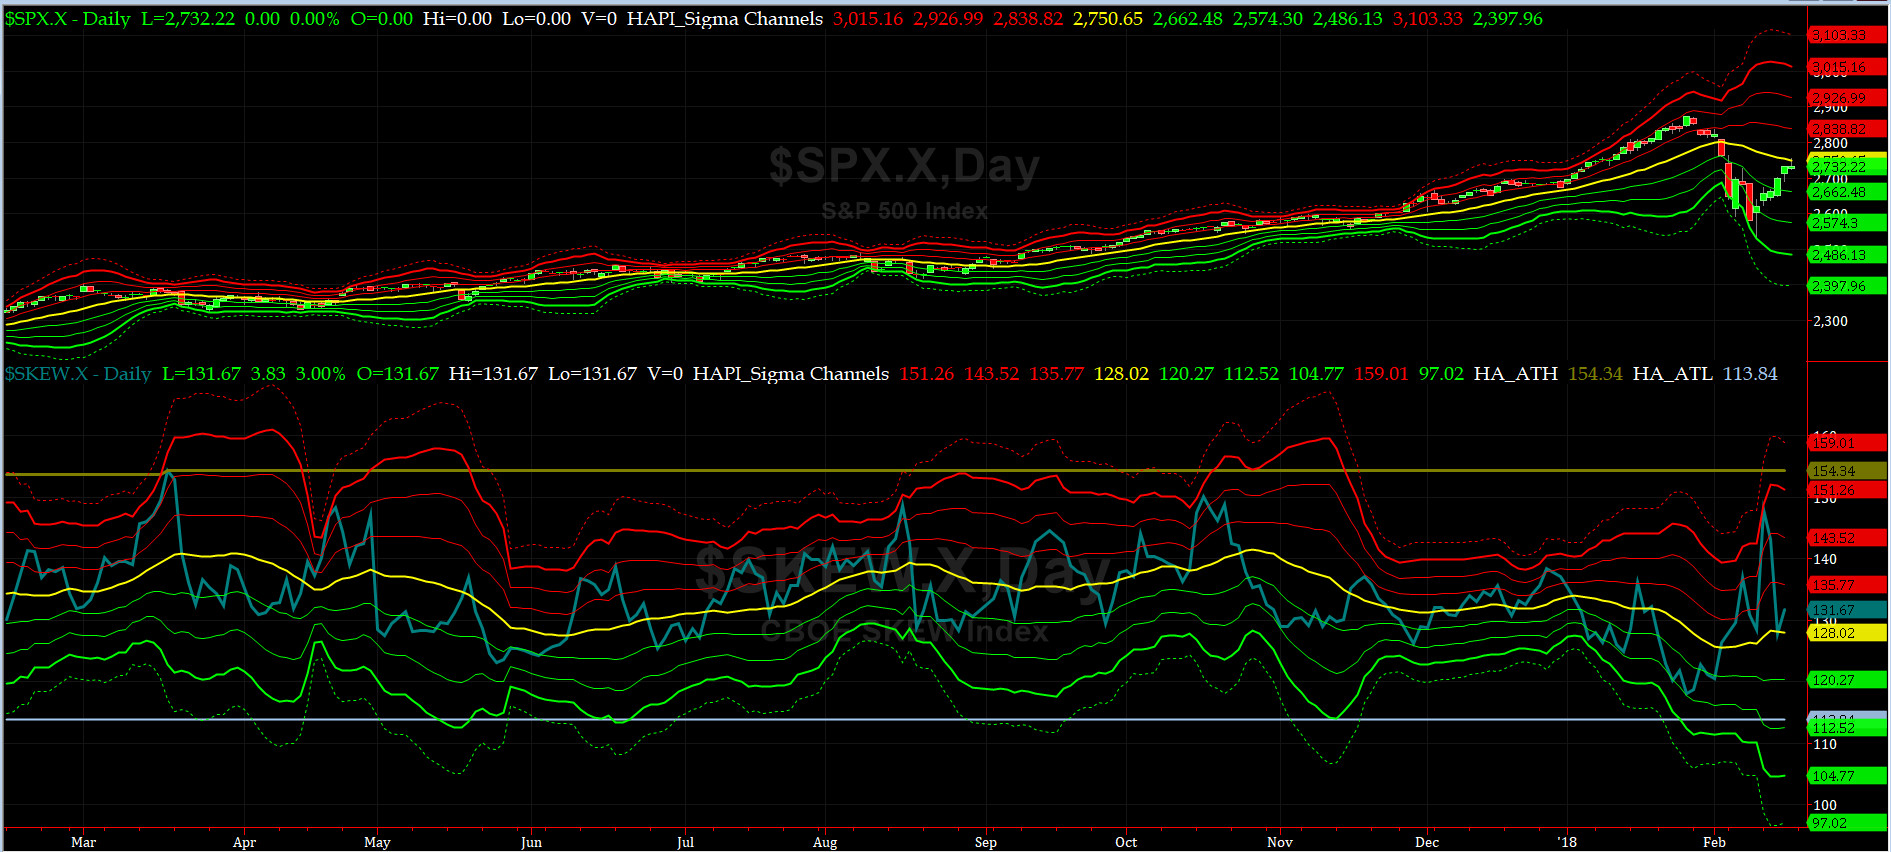
SPX SKEW (Tail Risk) Chart
Last week SPX SKEW (Tail Risk) closed at ~132, or about its zero sigma (normal = 120-125, range 100-150).
Is all quiet on the Eastern & Mid-Western Fronts? Smart Money is drinking more tea now, and reading more Rumi (much like our own @Capt_Tiko, after he covered his Short BitCoin Futures).
How to interpret the value of SPX SKEW? (from CBOE white paper on SKEW)

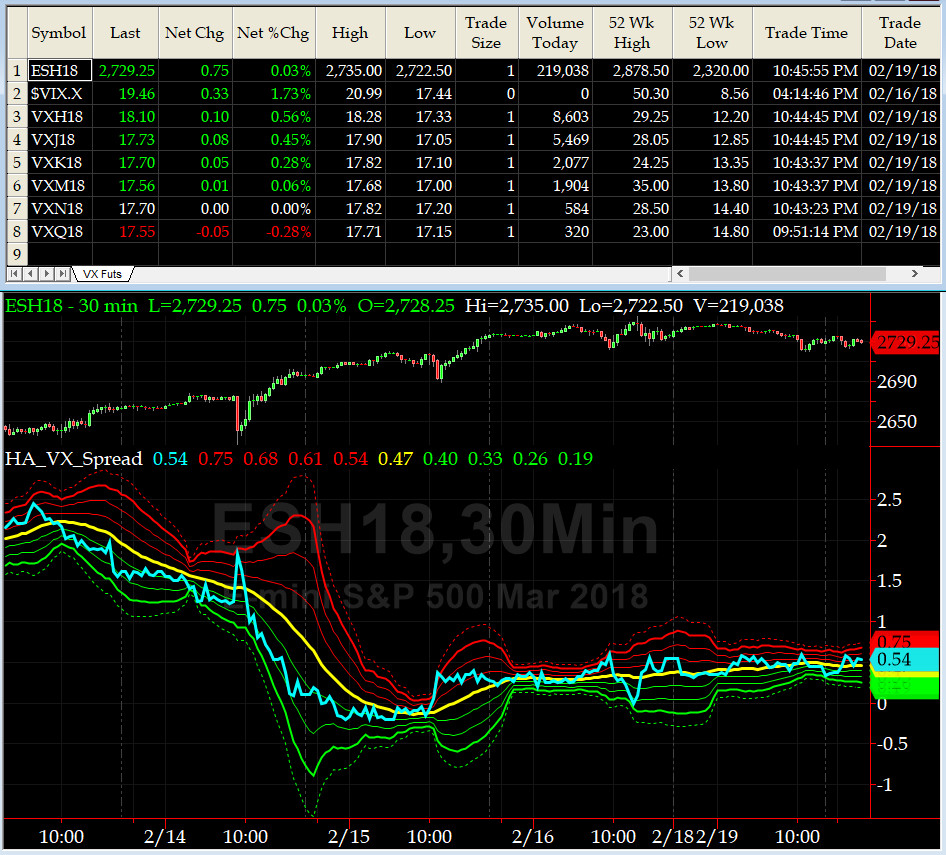
3-month VIX Futures Spread(VX) Chart
This popular timing indicator, now long March, short June VIX Futures again closed +0.45. Is the bottom in? we still think that most likely, we are seeing a dead cat bounce and then a retest.
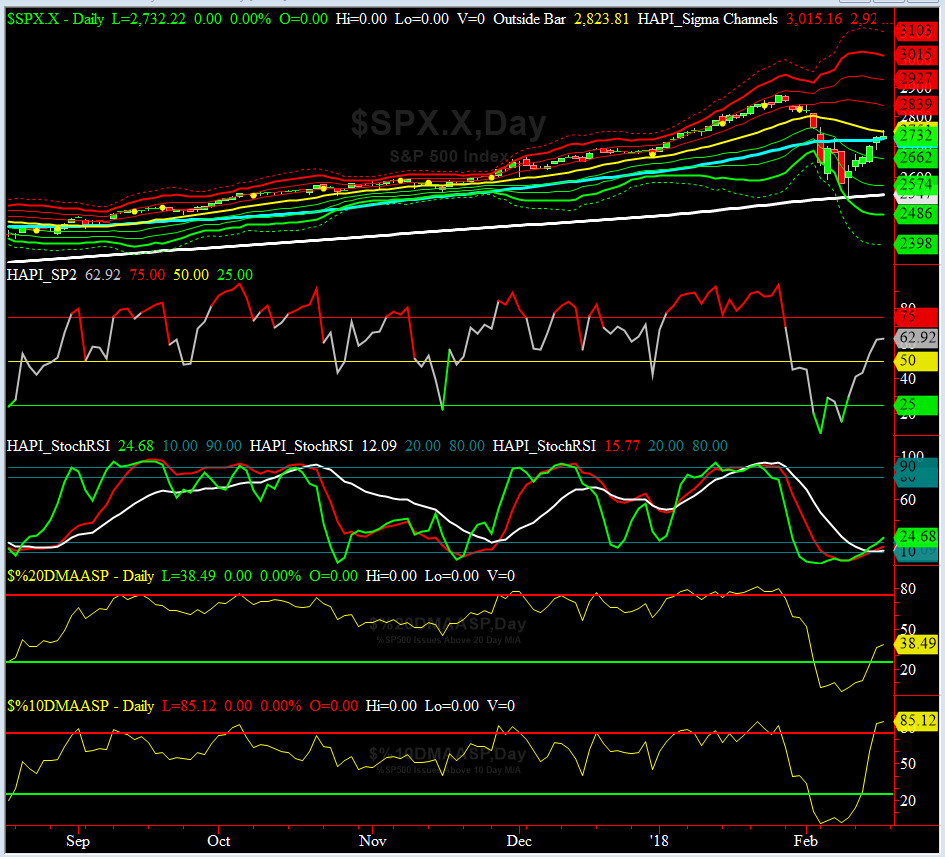
HA_SP2 Chart
HA_SP2 = 62.92 (Buy signal <= 25, Sell Signal >= 75)
This coveted timing indicator is now in NEUTRAL zone.
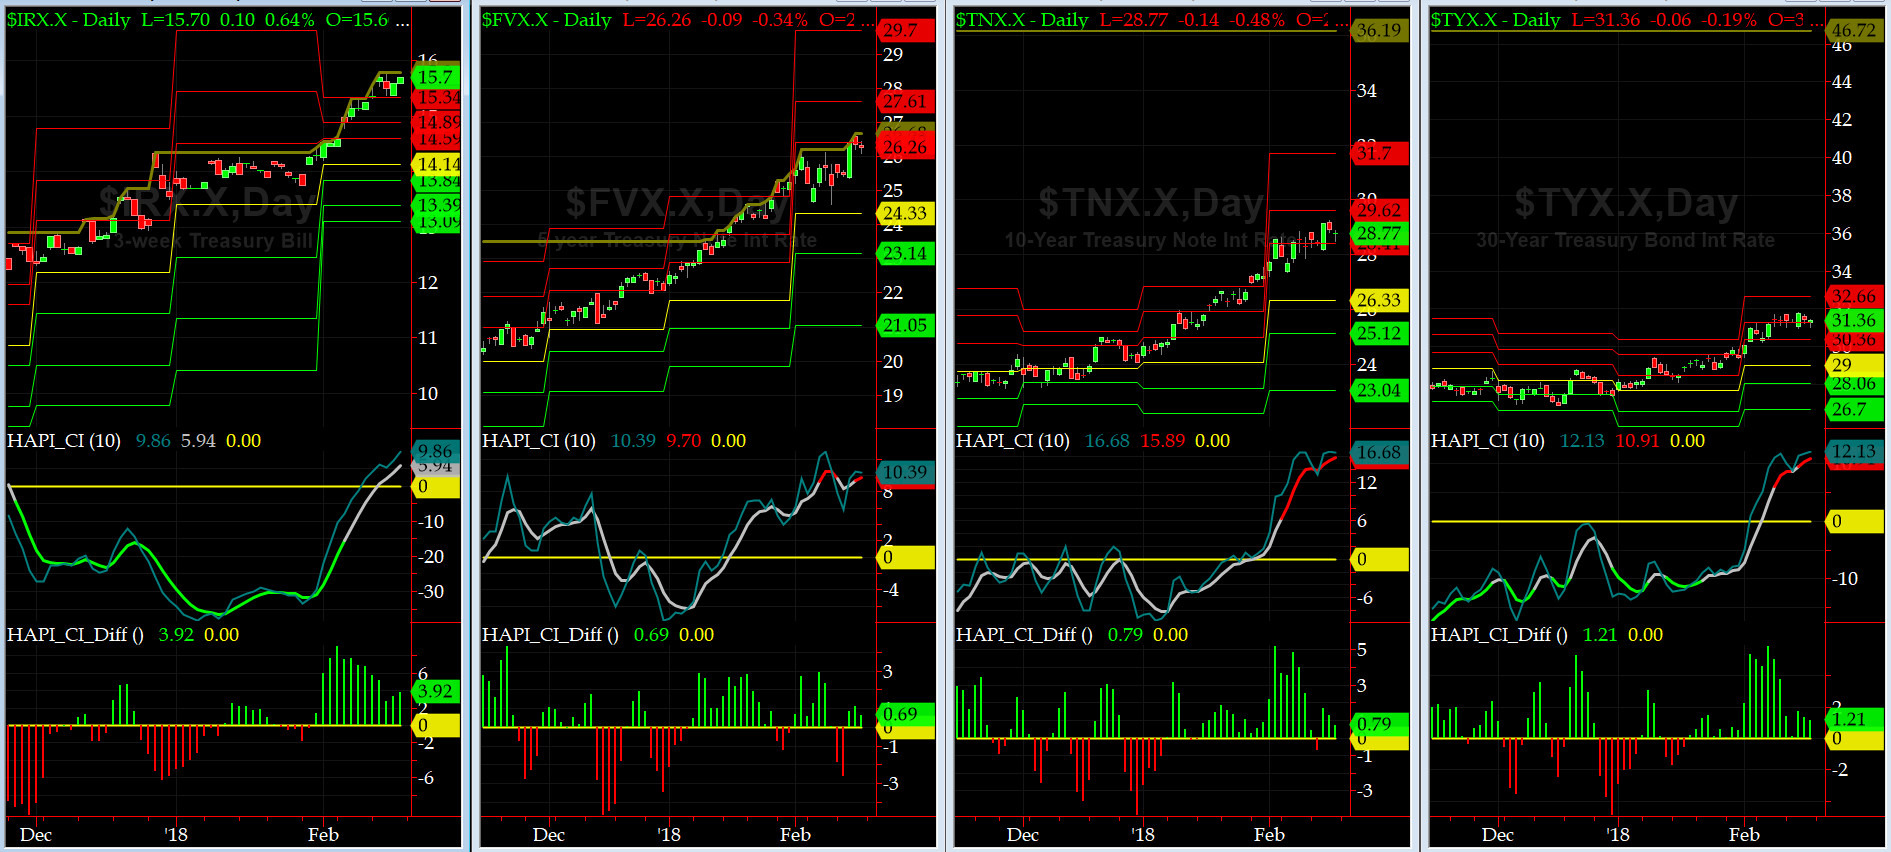
US Treasury T-Notes & T-Bonds Yields Chart
During this past week, our dear friends at Maury & Co, demanded more vig and the Treasury Curve sold off more, specially on the front-end of the Curve.
Fari Hamzei
|


 Proactive Market Timing