|
Sunday, April 1, 2018, 1300ET
Market Timing Charts, Analysis & Commentary for Issue #234
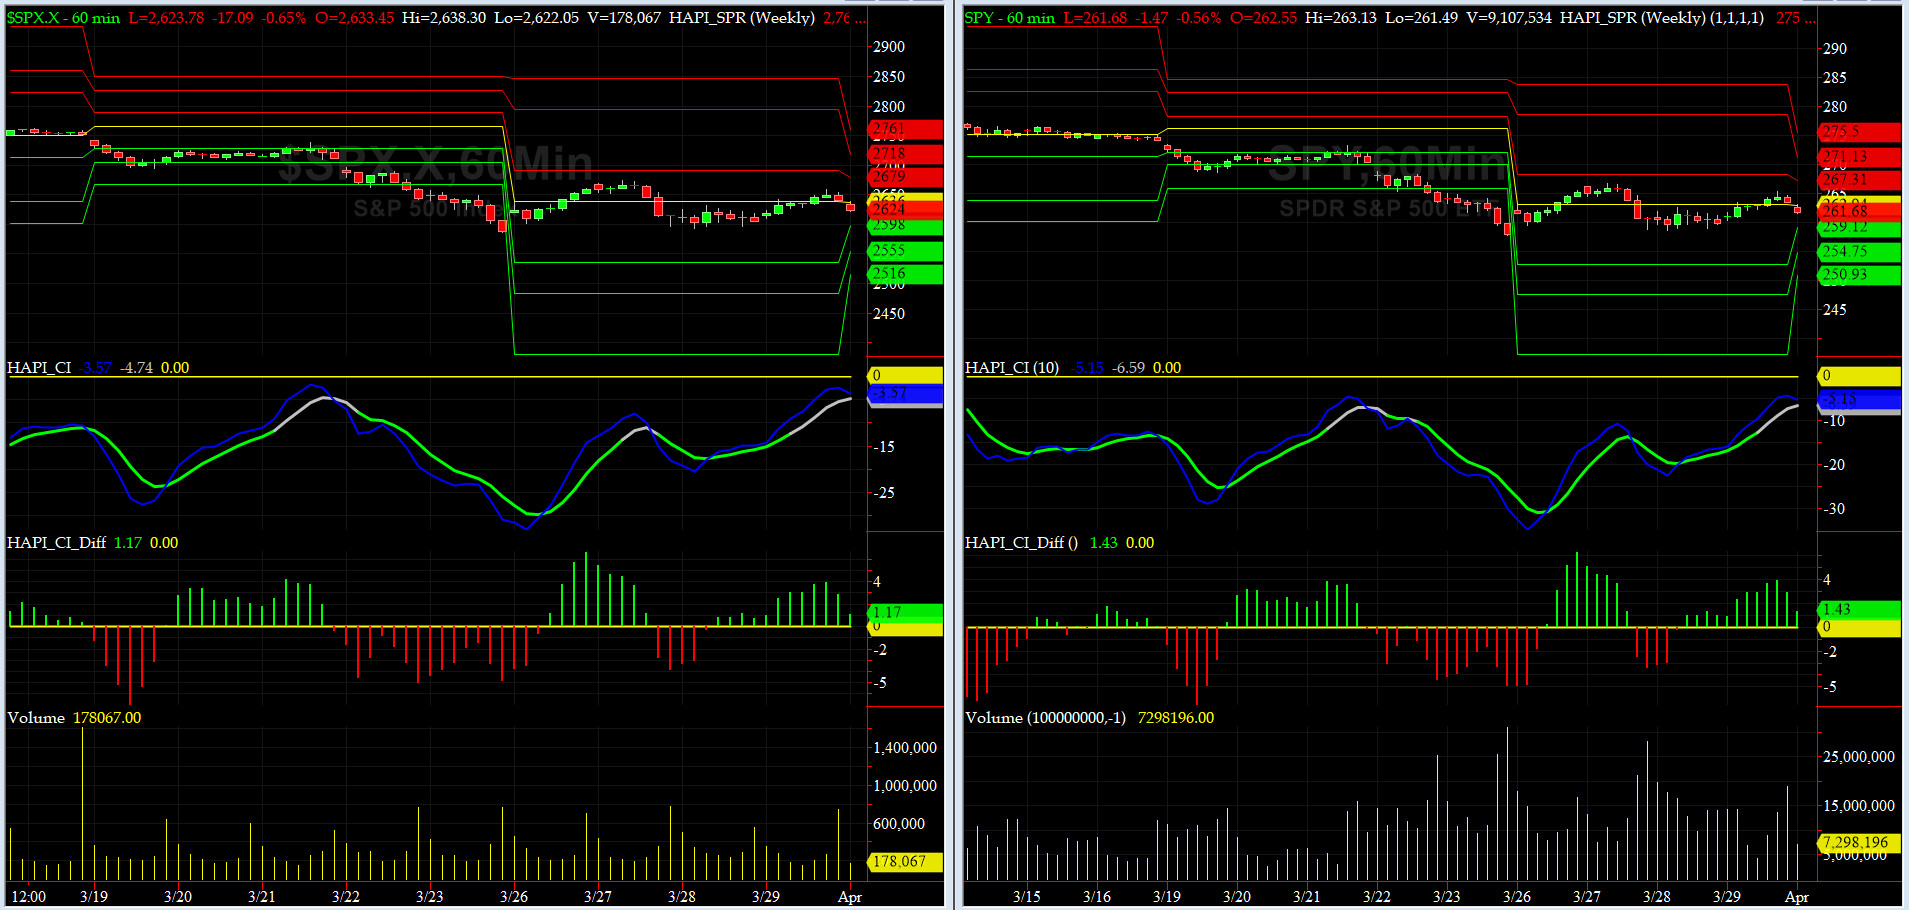
Timer Charts of S&P-500 Cash Index (SPX) + NASDAQ-100 Cash Index (NDX)
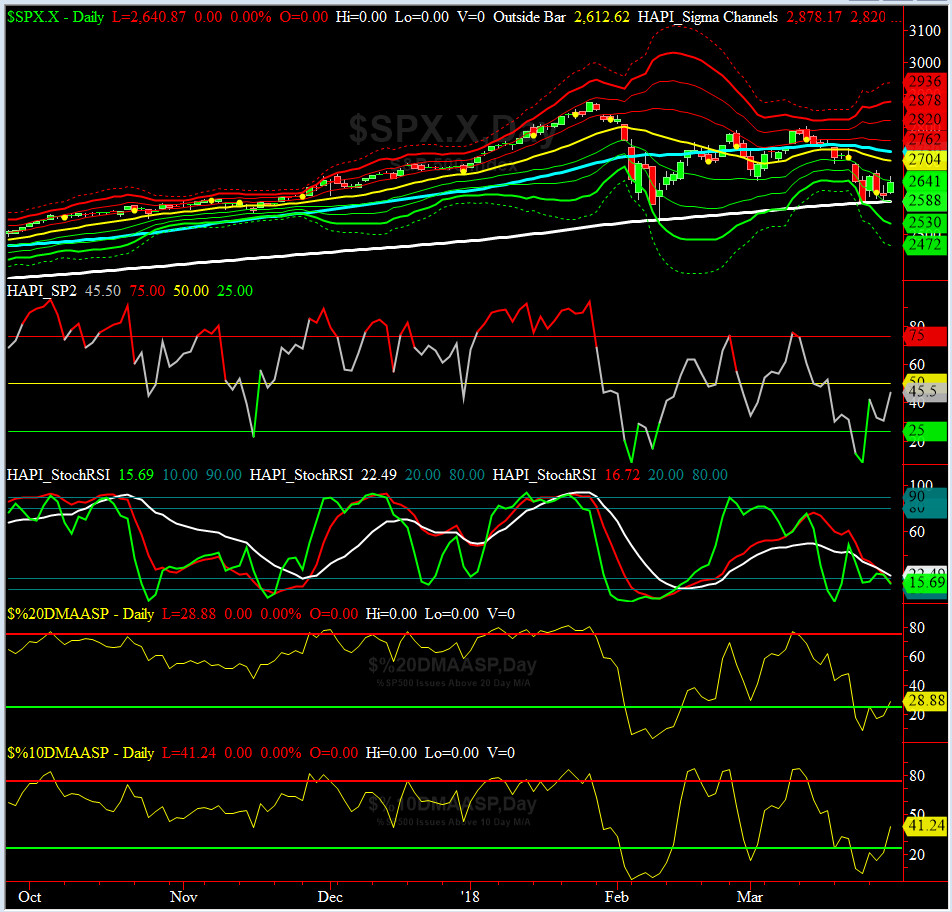
Most recent S&P-500 Cash Index (SPX): 2640.87 up 52.61 (up +2.03%) for the week ending on Thursday, March 29, 2018, which closed at its -1 sigma.
SPX ALL TIME INTRADAY HIGH = 2872.87 (reached on Friday, Jan 26, 2018)
SPX ALL TIME CLOSING HIGH = 2872.87 (reached on Friday, Jan 26, 2018)
Current DAILY +2 Sigma SPX = 2820 with WEEKLY +2 Sigma = 2873
Current DAILY 0 Sigma (20 day MA) SPX = 2704 with WEEKLY 0 Sigma = 2702
Current DAILY -2 Sigma SPX = 2588 with WEEKLY -2 Sigma = 2545
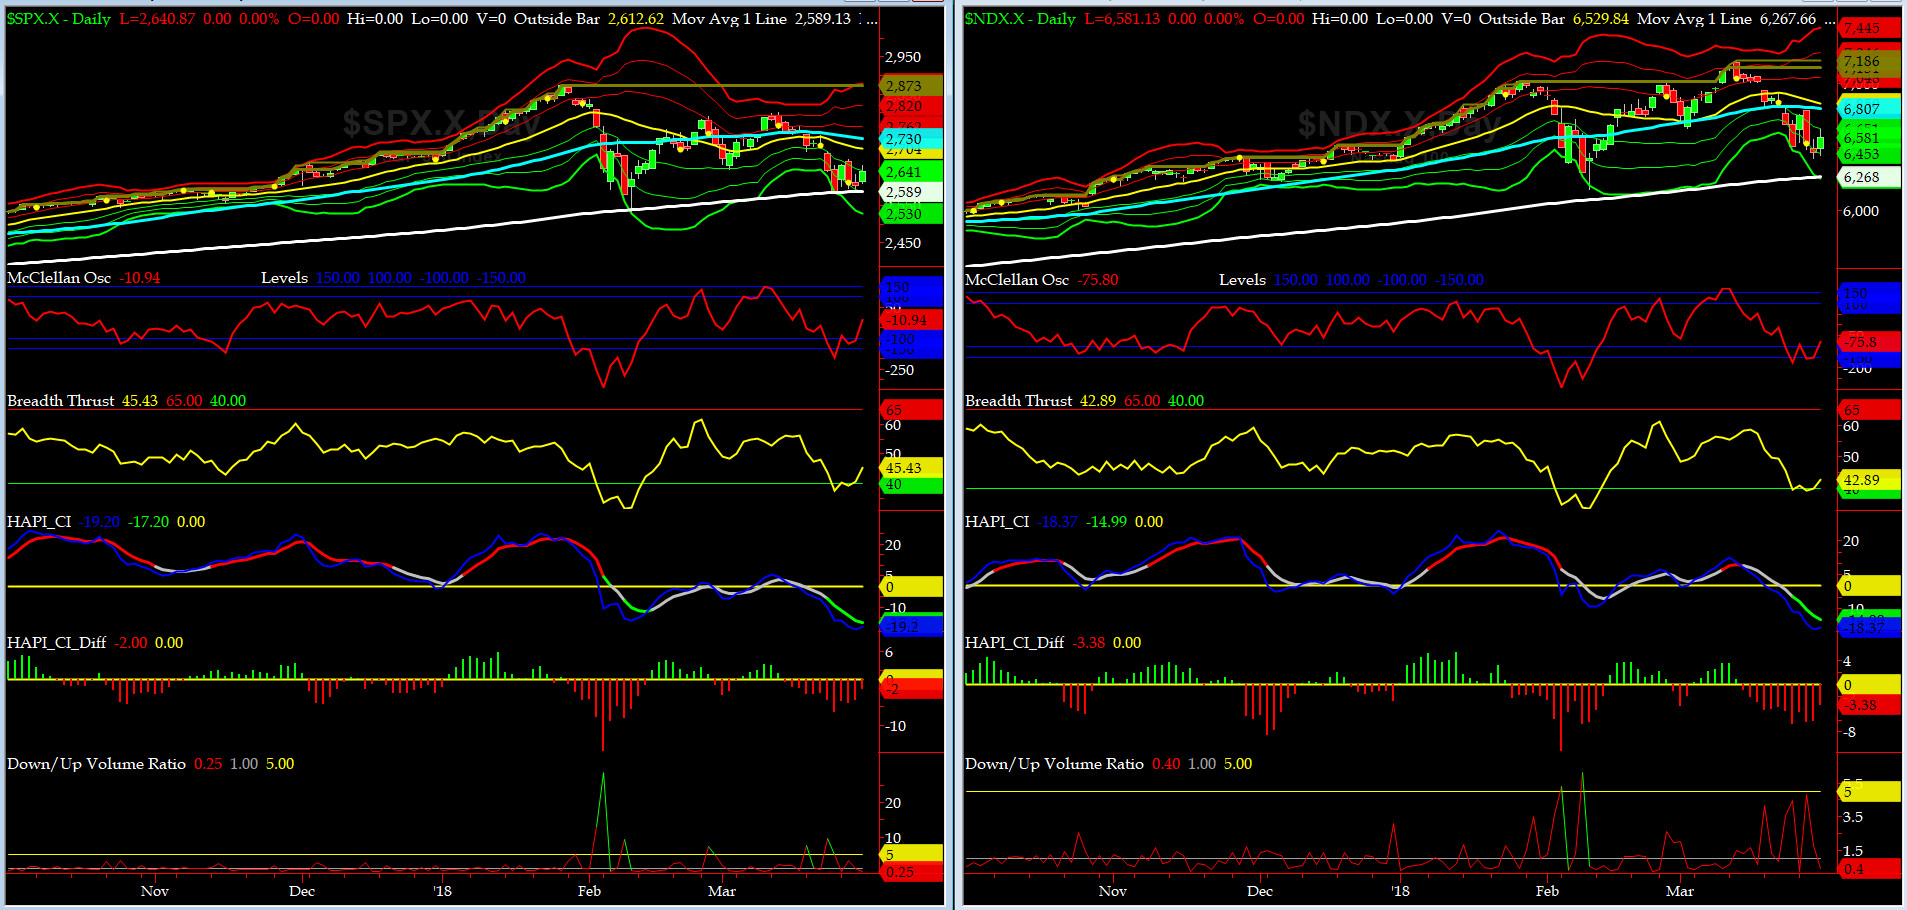
NYSE McClellan Oscillator = -11 (-150 is start of the O/S area; around -275 to -300 area or lower, we go into the �launch-pad� mode, over +150, we are in O/B area)
NYSE Breadth Thrust = 45.4 (40 is considered as oversold and 65 as overbought)
Most probably we have seen the SPX lows on this shock wave, but as always, only time will tell (and we shall see it in our rear-view mirror).

Canaries [in the Coal Mine] Chart for DJ TRAN & RUT Indices
200-Day MA DJ TRAN = 9994 or 4% above DJ TRAN (max observed in last 7 yrs = 20.2%, min = -20.3%)
200-Day MA RUT = 1487 or 2.8% above RUT (max observed in last 7 yrs = 21.3%, min = -22.6%)
DJ Transportation Index (proxy for economic conditions 6 to 9 months hence) had another struggling week, and so far has been stuck between 50 bar and 200 bar for seven weeks now. It won't stay here forever. A breakout or breakdown here shall be a huge tell (Grumpino calls that "a Bigly Tell," if only he could read a chart LOL).
Russell 2000 Small Caps Index (proxy for Risk ON/OFF) could not hold over its 50-day MA for more than 2 weeks and it is trading below. RISKY wants to get back ON but seems a tad "dazed and confused" in the holy words of LedZepp.
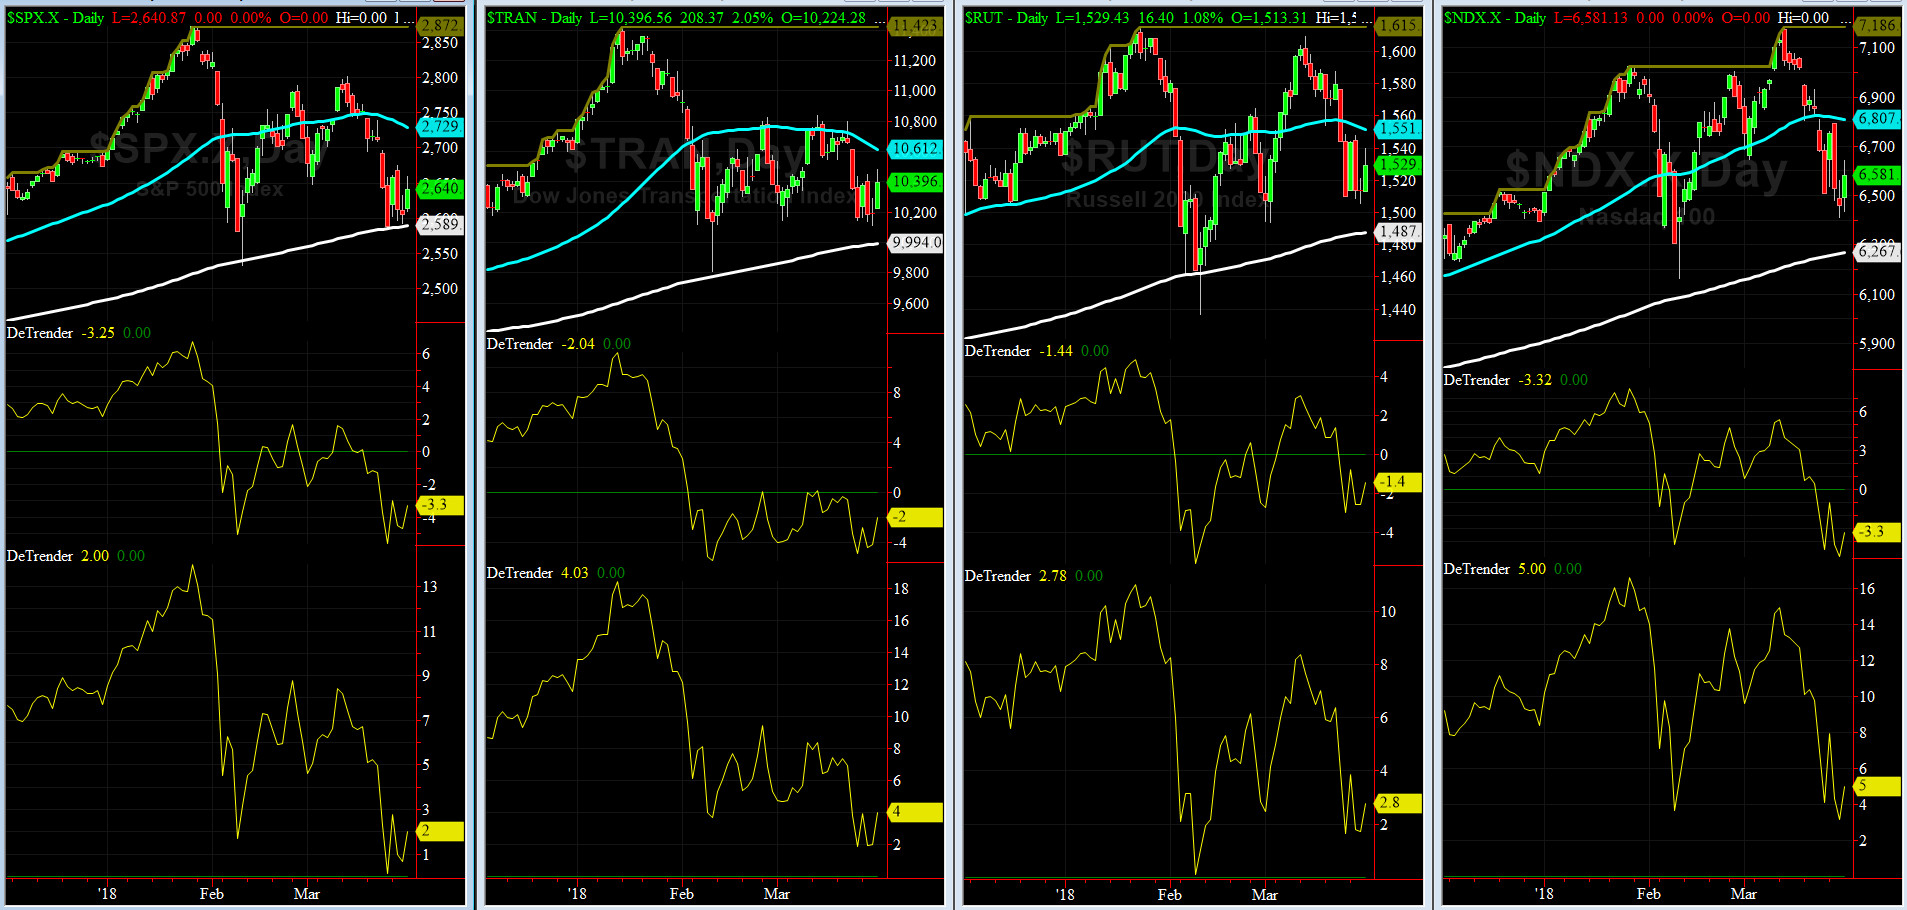
DeTrenders Charts for SPX, NDX, TRAN & RUT Indices
50-Day MA SPX = 2729 or 3.3% above SPX (max observed in last 7 yrs = +8.6%, min = -9.3%)
200-Day MA SPX = 2589 or 2% below SPX (max observed in last 7 yrs = 15.2%, min = -14%)
Now, FOUR of our EIGHT DeTrenders ended up in POSITIVE territory. The DeTrenders for DJ Tran & RUT will continue to be harbingers of future price behavior in broad indices.
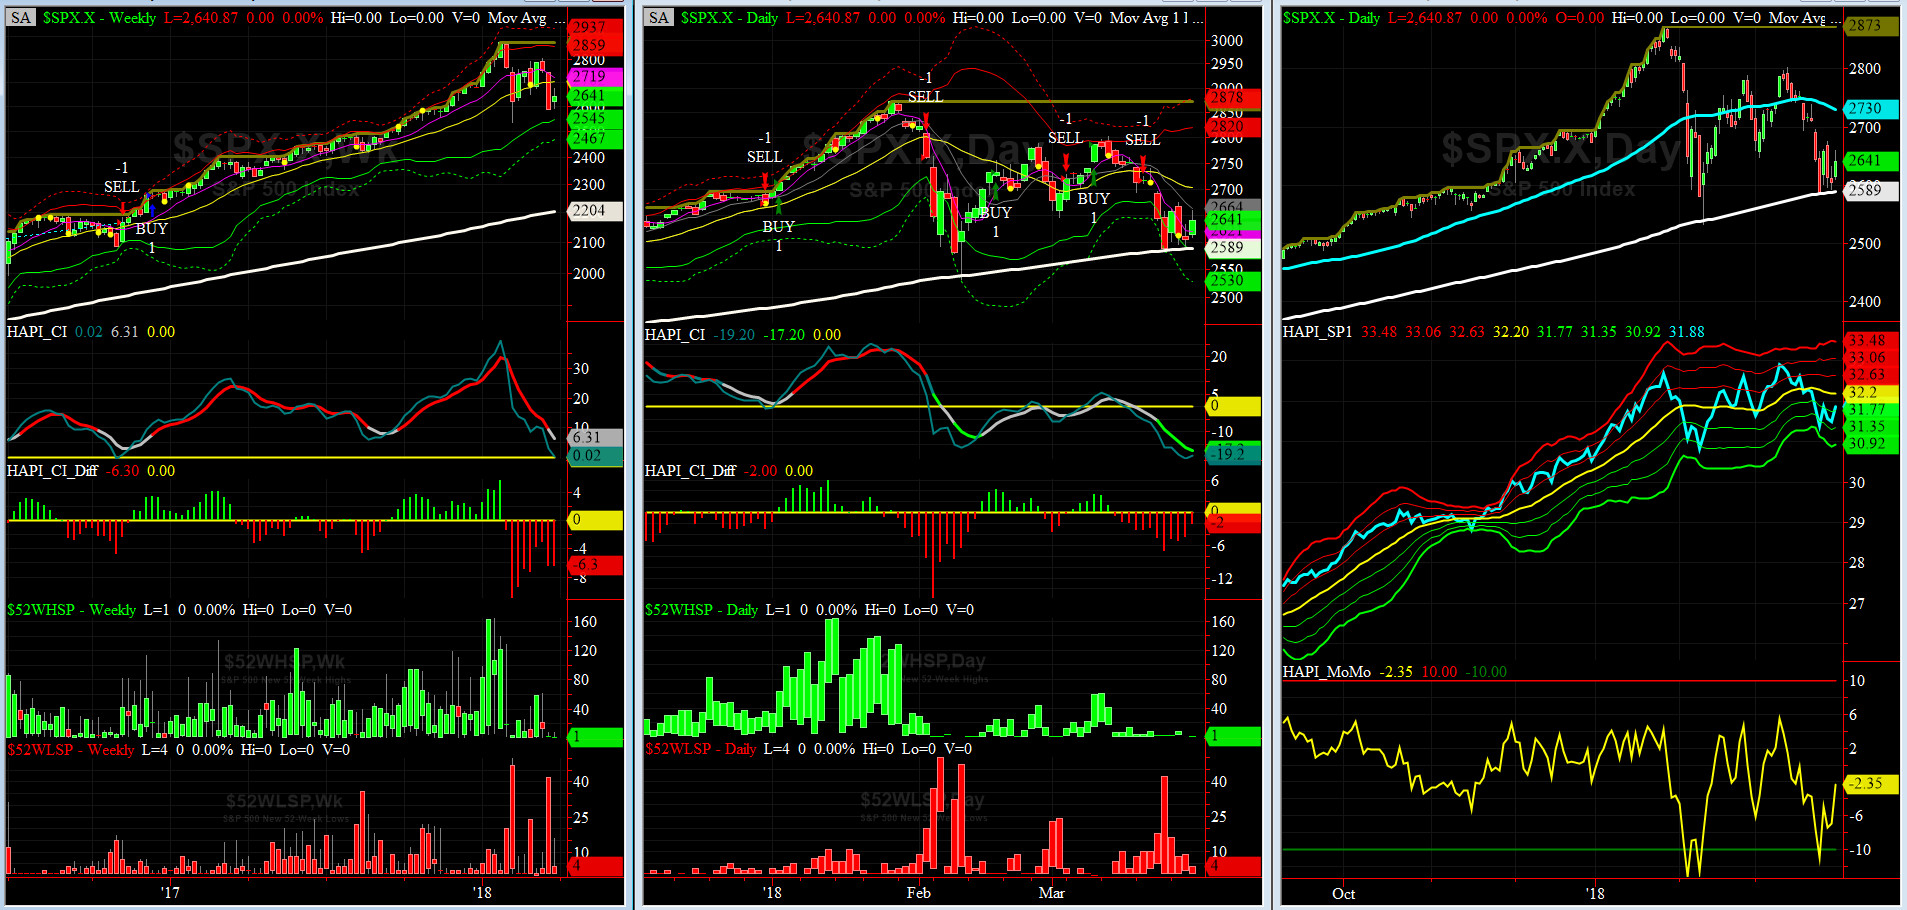
HA_SP1_Momo Chart
WEEKLY Timing Model = on a BUY Signal since Friday 12/16/16 CLOSE at 2258
DAILY Timing Model = on a SELL Signal since Tuesday 3/20/18 CLOSE at 2716
Max SPX 52wk-highs reading last week = 8 (over 120-140, the local maxima is in)
Max SPX 52wk-Lows reading last week = 16 (over 40-60, the local minima is in)
HA_SP1 closed above its -1 sigma channels
HA_Momo = -2.35 (reversals most likely occur above +10 or below -10)
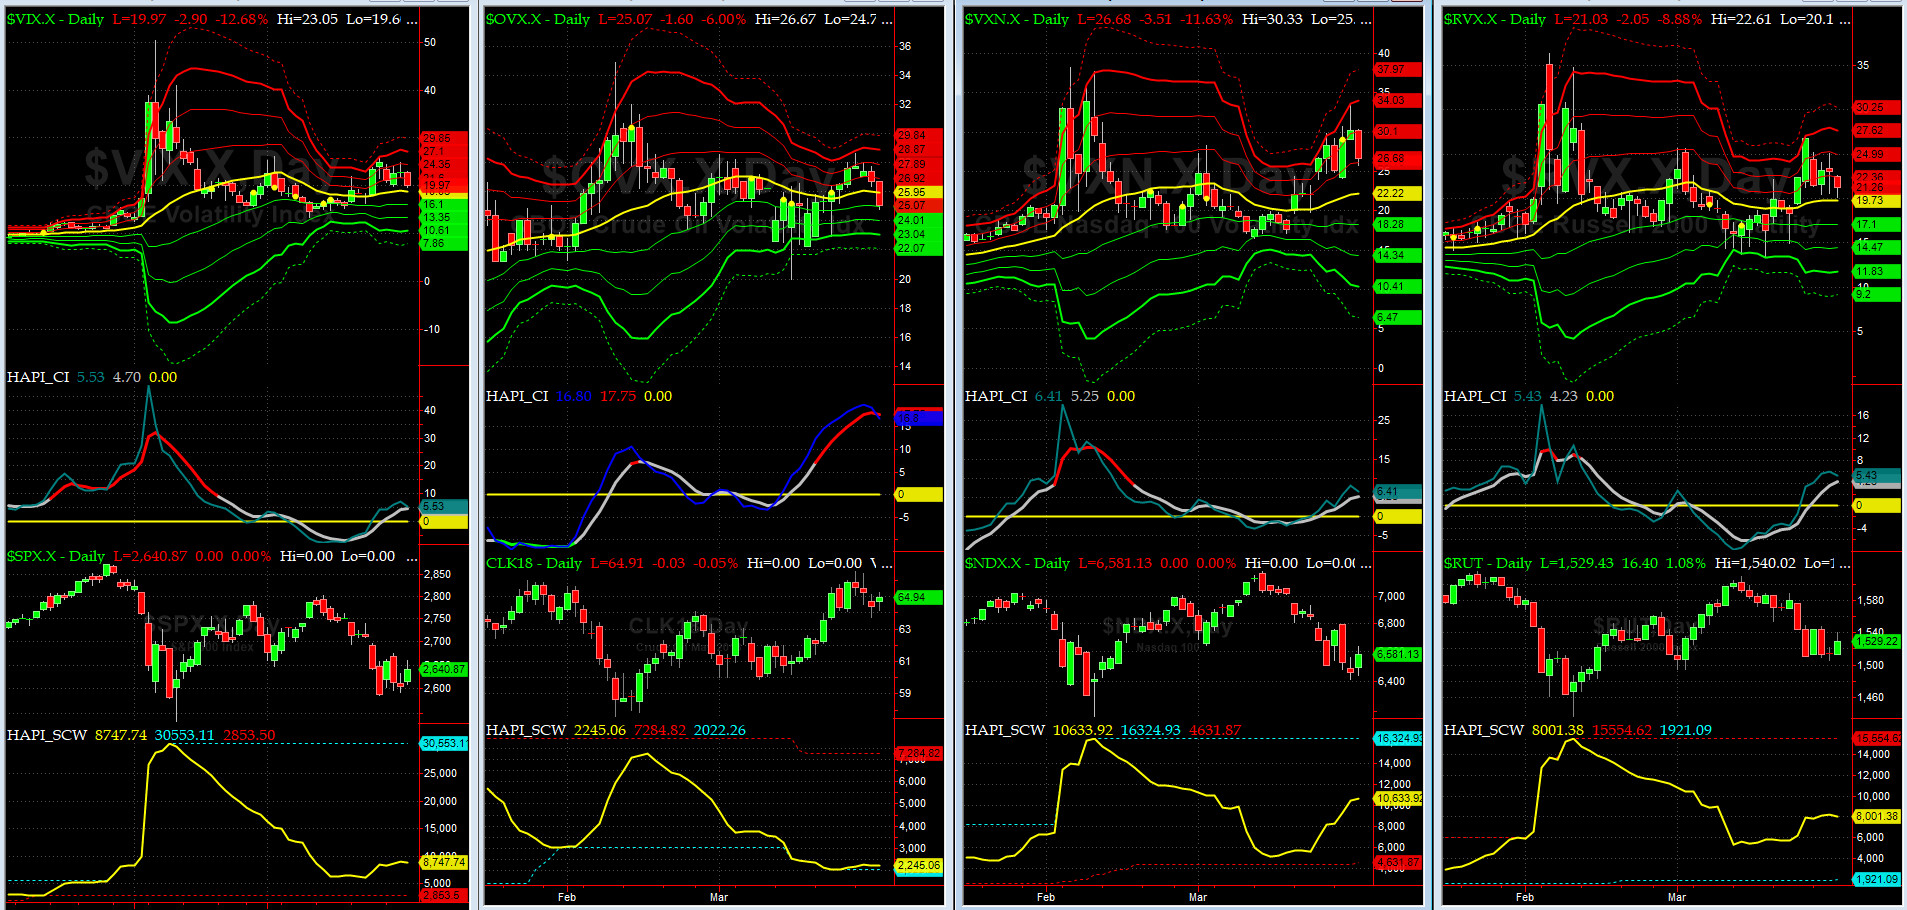
Vol of the Vols Chart
VIX currently stands at 19.97, at about its zero sigma (remember it's the VIX volatility pattern aka "its sigma channels" that matters, and not the level of VIX itself (this is per Dr. Robert Whaley, a great mentor and inventor of original VIX, now called VXO). VIX usually peaks around a test of its +4 sigma).
The mild Contango in the VIX Futures says we are near a trade able low or just above it. STAY VIGILANT......
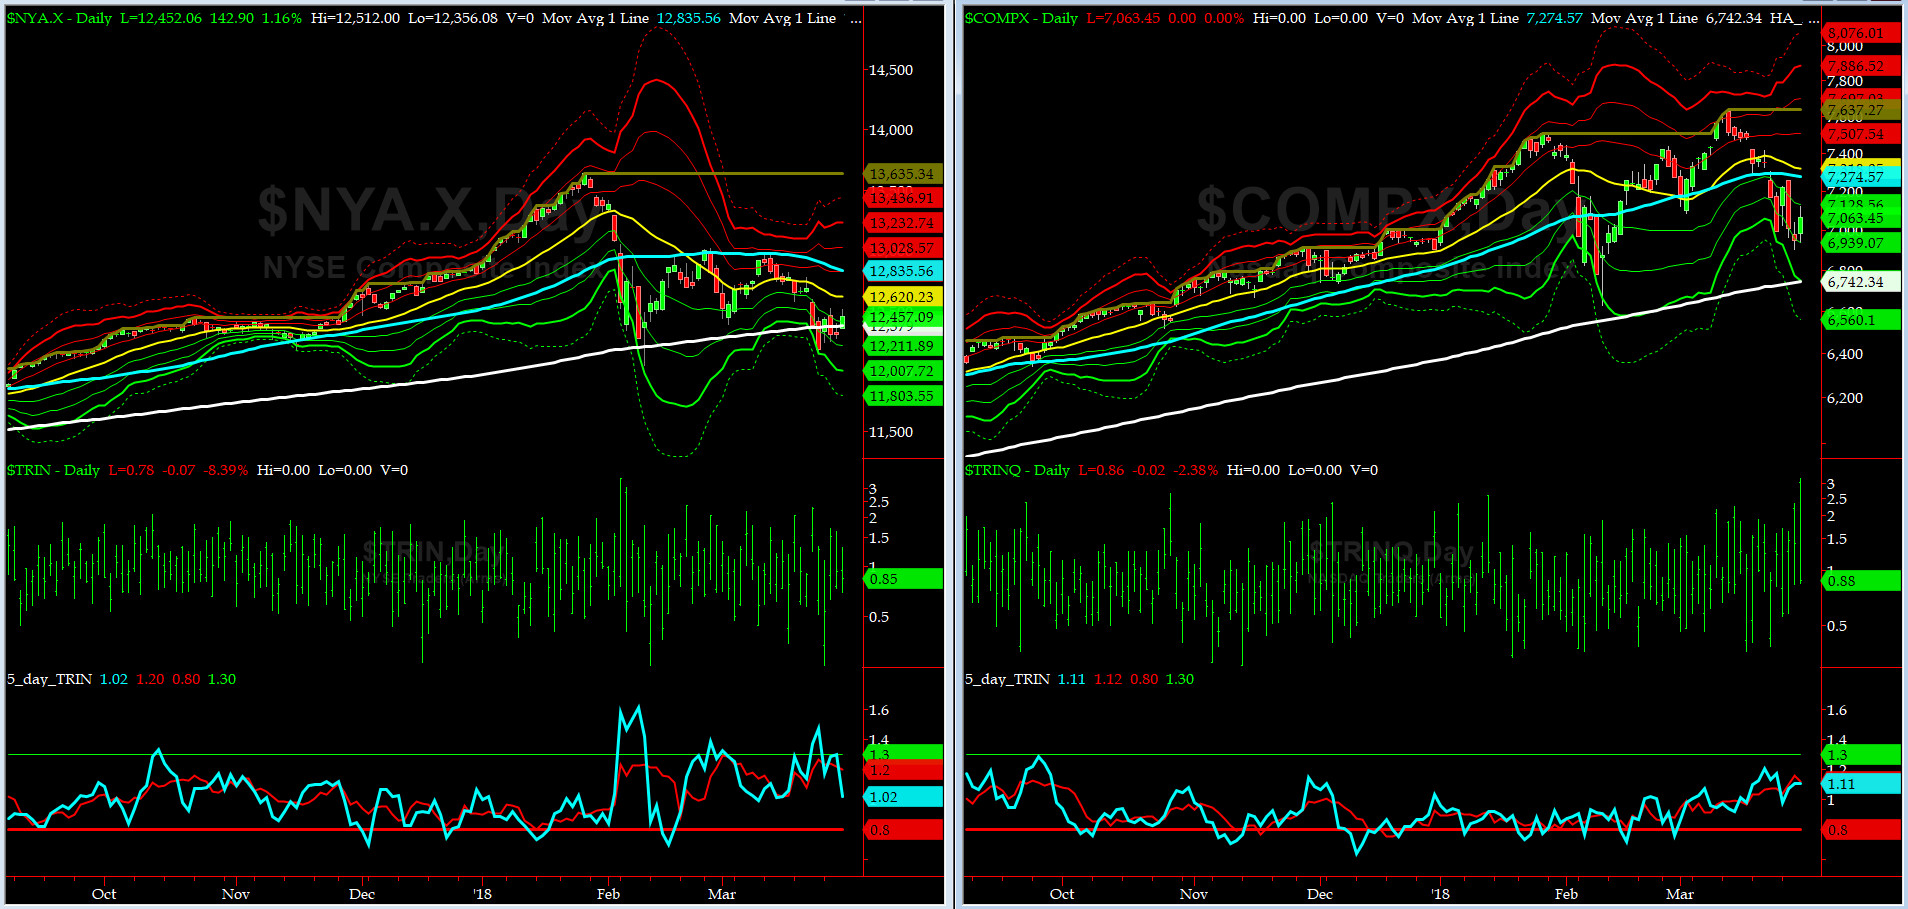
5-day TRIN & TRINQ Charts
Both NYSE & NASDAQ 5-day TRIN were near a BUY Zone but now moving back into NEUTRAL zones.

Components of SPX above their respective 200day MA Chart
This scoring indicator rallied hard from 51% to 58%. The 50% line-in-the-sand was not breached and we think of that as a positive development.
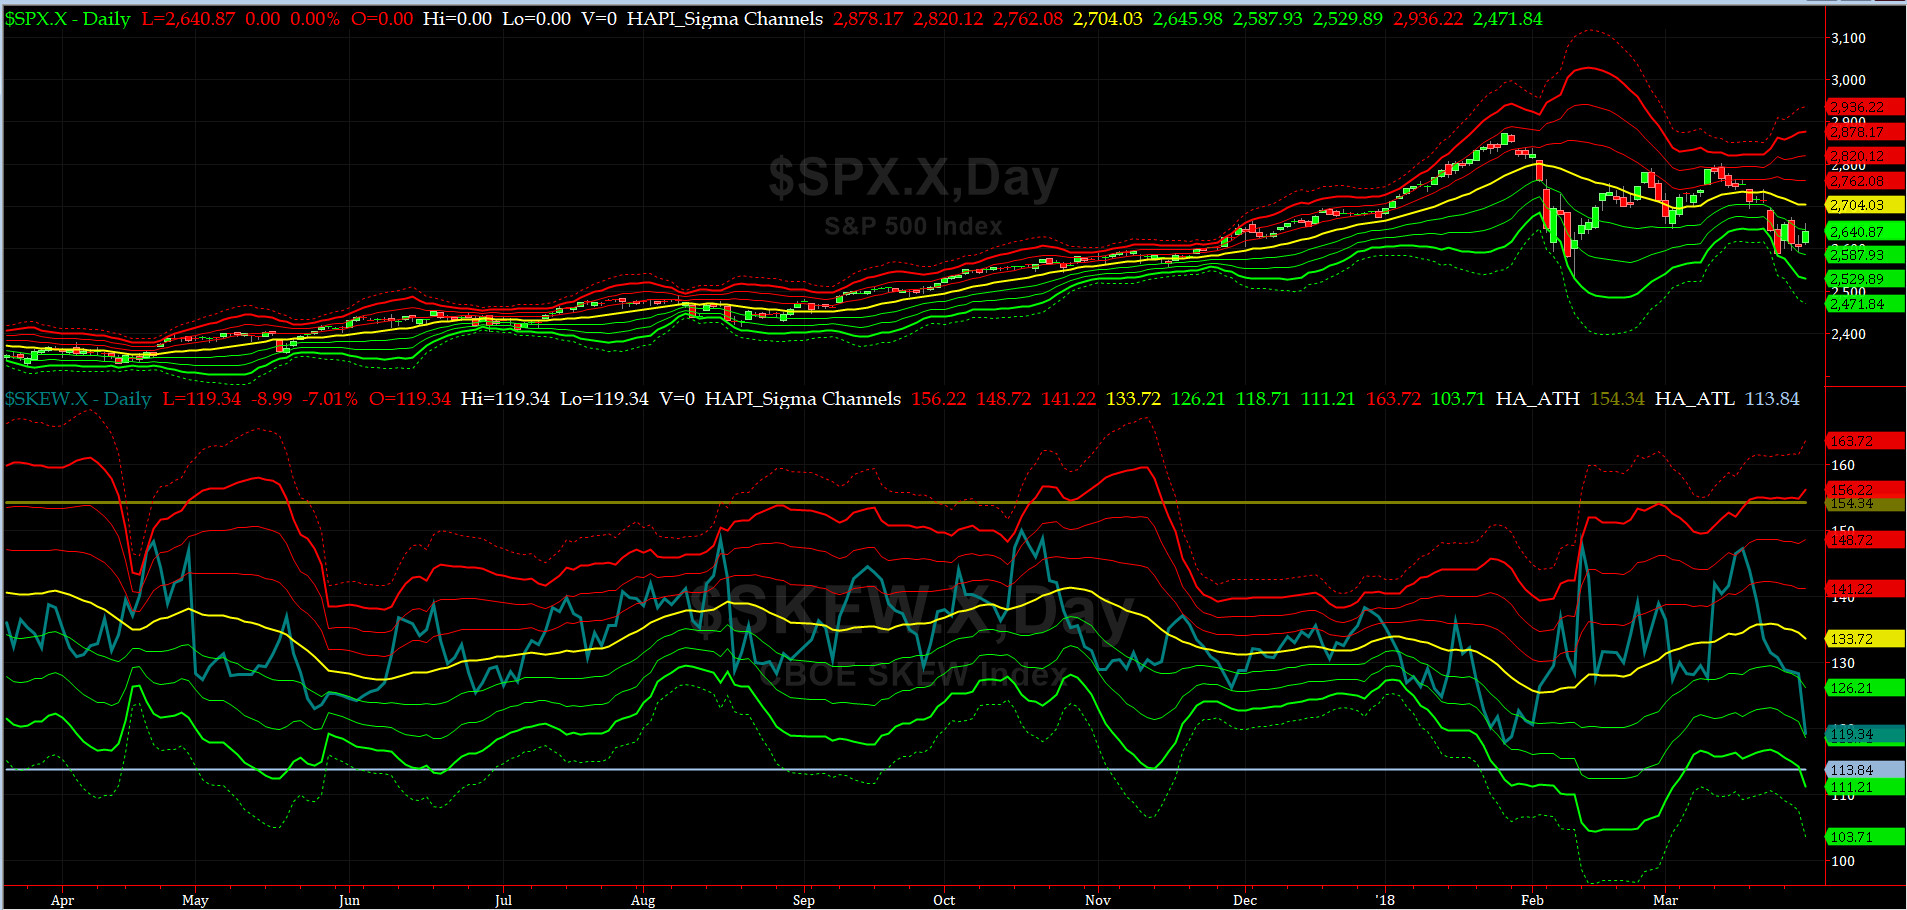
SPX SKEW (Tail Risk) Chart
Last week SPX SKEW (Tail Risk) closed at ~119.34, or about its -2 sigma (normal = 120-125, range 100-150).
Is all quiet on the Eastern & Mid-Western Fronts? Smart Money says YES, BIGLY......lol
How to interpret the value of SPX SKEW? (from CBOE white paper on SKEW)

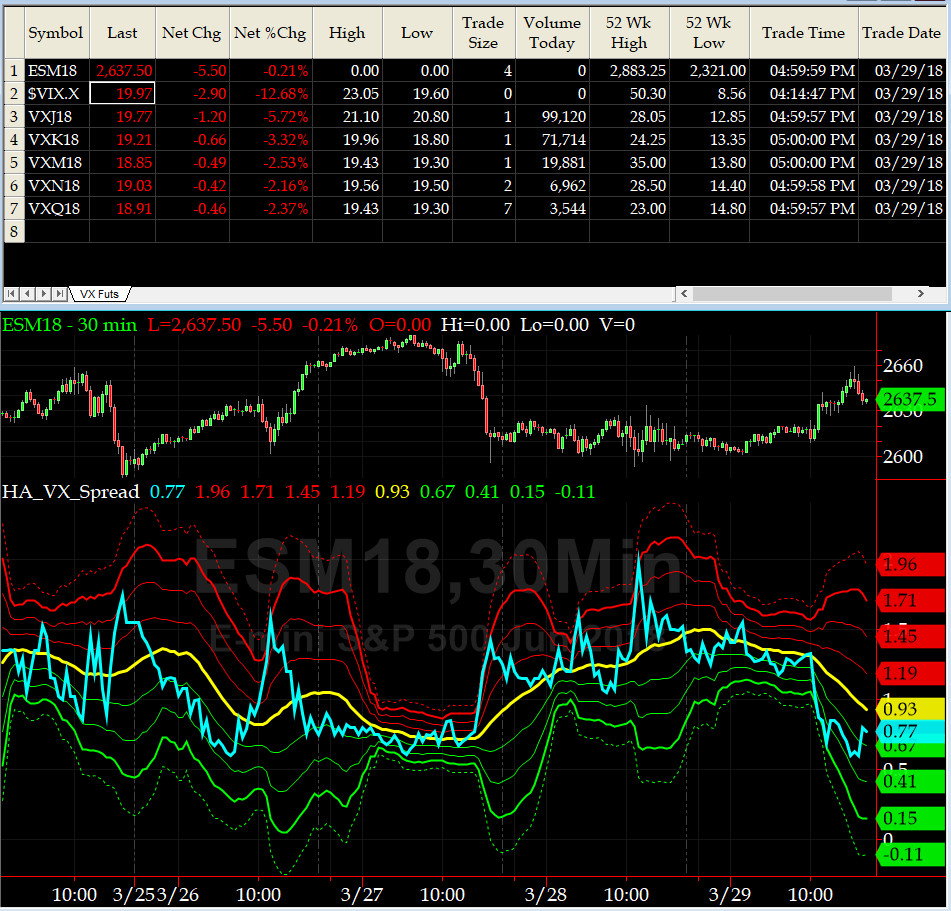
3-month VIX Futures Spread(VX) Chart
This popular timing indicator, now long April, short July VIX Futures near +0.75. Is the bottom in? @Capt_Tiko says YES.
HA_SP2 Chart
HA_SP2 = 45.5 (Buy signal <= 25, Sell Signal >= 75)
This coveted prop indicator gave us a great signal last week..... LONG LIVE SP2....next major target past 50 (we should/may vacillate at 50 first) is 75.
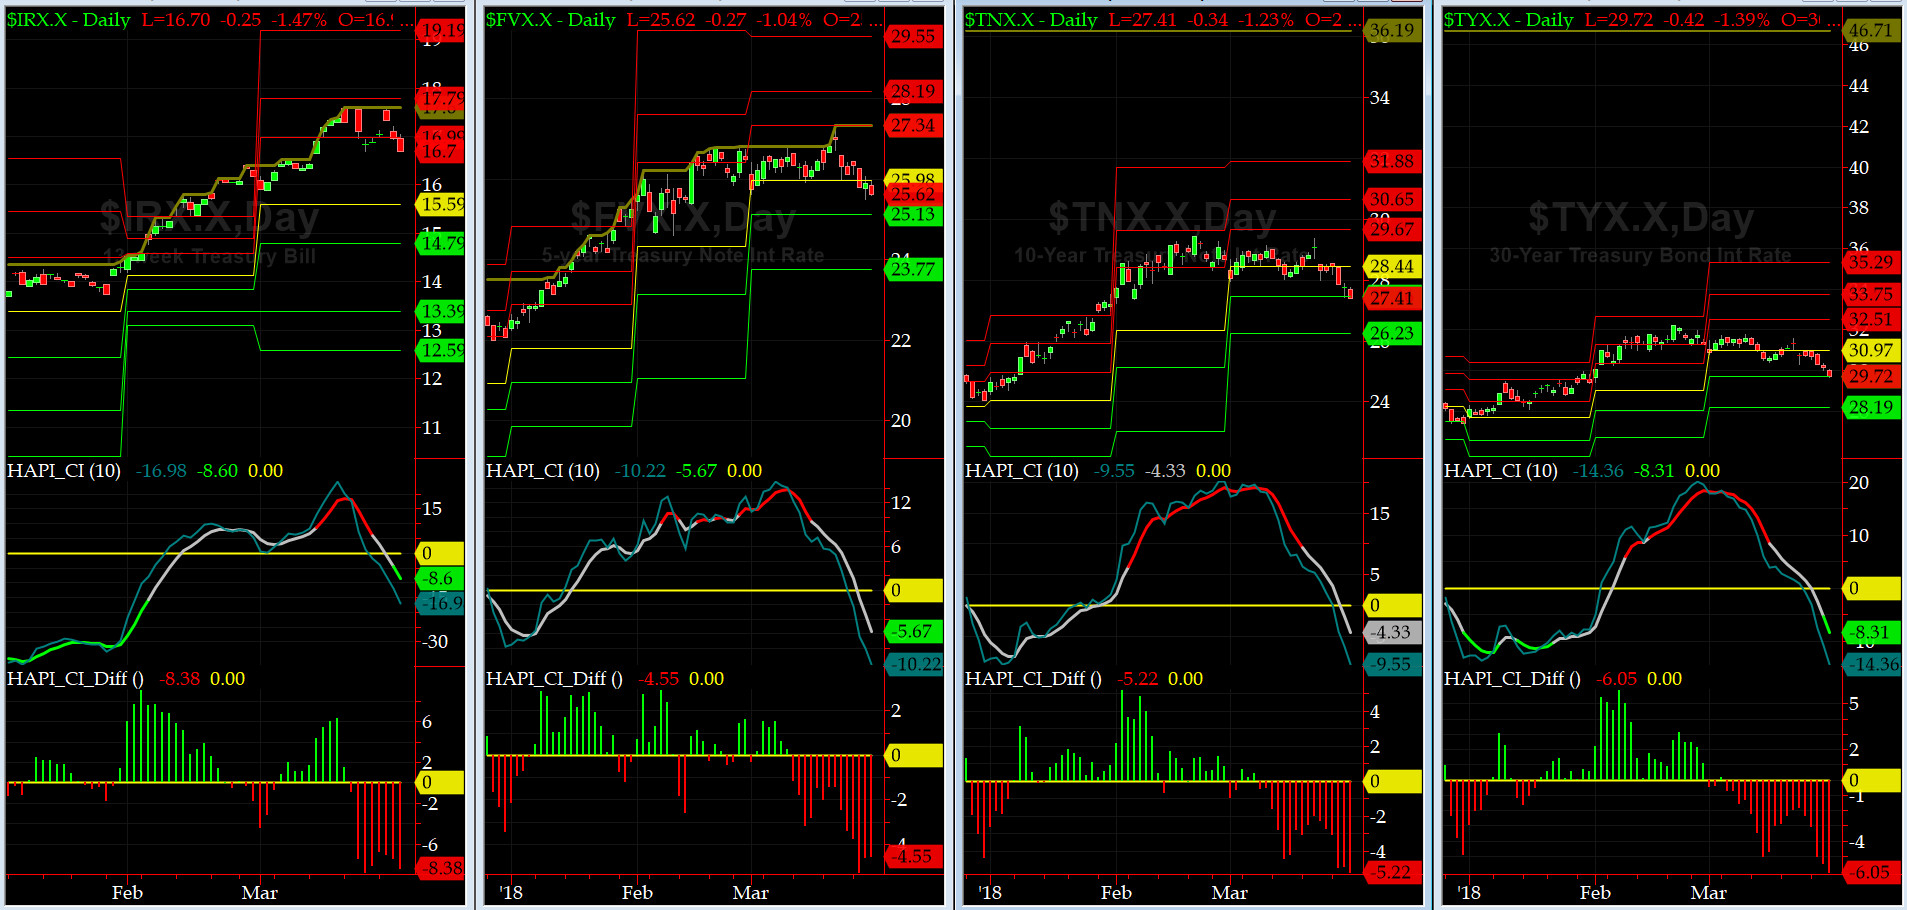
US Treasury T-Notes & T-Bonds Yields Chart
The Flight-to-Safety Trade was back this past week.... as mentioned here before, our dear friends at Maury & Co. are no longer smiling.
Fari Hamzei
|


 Proactive Market Timing