|
Sunday, April 15, 2018, 2130ET
Market Timing Charts, Analysis & Commentary for Issue #236
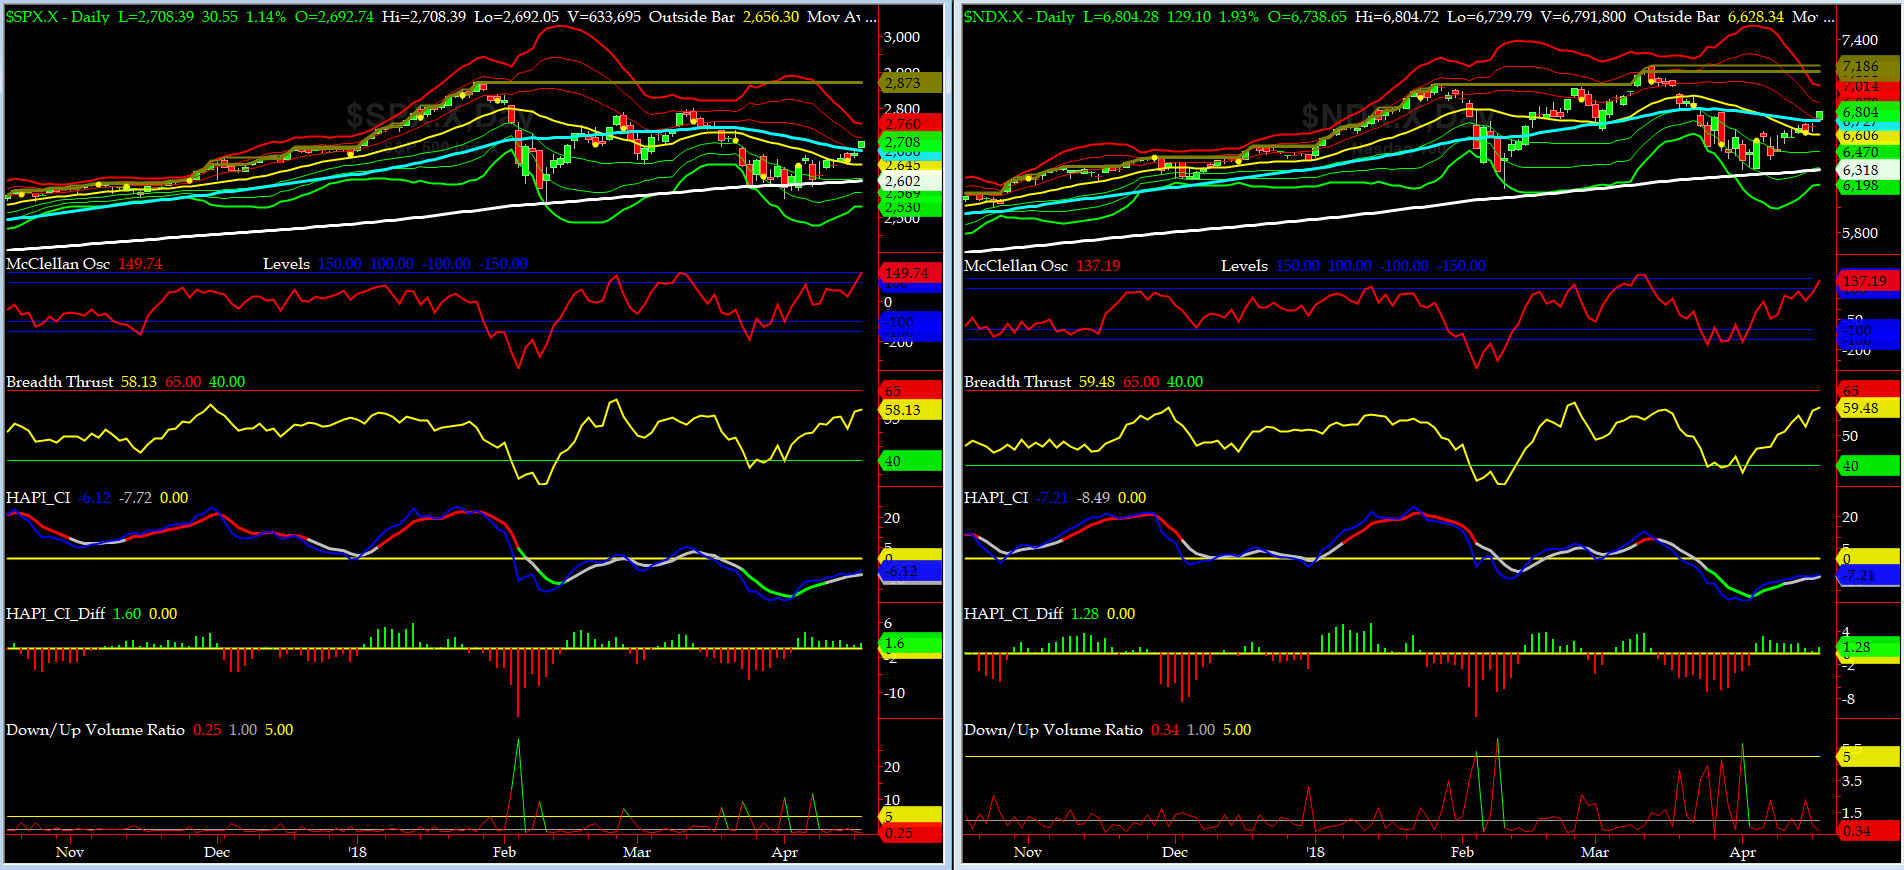
Timer Charts of S&P-500 Cash Index (SPX) + NASDAQ-100 Cash Index (NDX)
Most recent S&P-500 Cash Index (SPX): 2604.47 up +51.83 (up +2%) for the week ending on Friday, April 13, 2018, which closed just above its zero sigma.
SPX ALL TIME INTRADAY HIGH = 2872.87 (reached on Friday, Jan 26, 2018)
SPX ALL TIME CLOSING HIGH = 2872.87 (reached on Friday, Jan 26, 2018)
Current DAILY +2 Sigma SPX = 2739 with WEEKLY +2 Sigma = 2854
Current DAILY 0 Sigma (20 day MA) SPX = 2649 with WEEKLY 0 Sigma = 2706
Current DAILY -2 Sigma SPX = 2560 with WEEKLY -2 Sigma = 2559
NYSE McClellan Oscillator = +28 (-150 is start of the O/S area; around -275 to -300 area or lower, we go into the �launch-pad� mode, over +150, we are in O/B area)
NYSE Breadth Thrust = 51.4 (40 is considered as oversold and 65 as overbought)
This past week, we got 5 green CI Diffs -- we have not seen that since mid February. Vols are dropping as we enter 2018 Q1 Earnings Season.
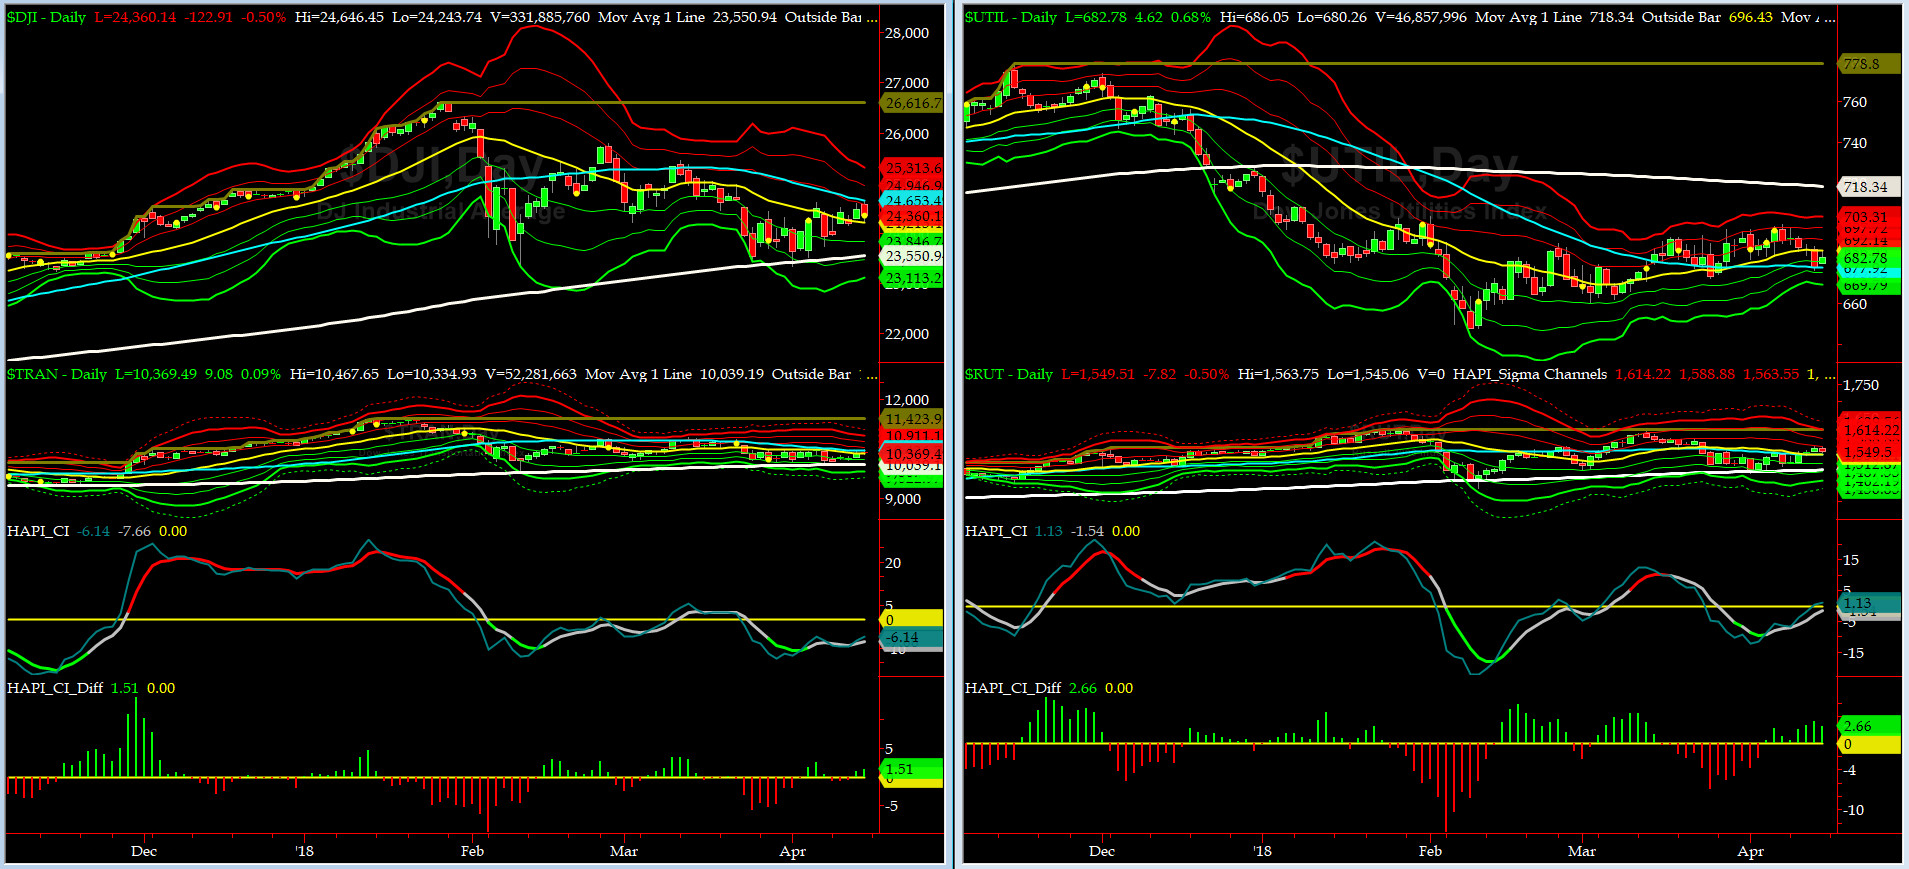
Canaries [in the Coal Mine] Chart for DJ TRAN & RUT Indices
200-Day MA DJ TRAN = 10039 or 3.3% below DJ TRAN (max observed in last 7 yrs = 20.2%, min = -20.3%)
200-Day MA RUT = 1493 or 3.7% below RUT (max observed in last 7 yrs = 21.3%, min = -22.6%)
DJ Transportation Index (proxy for economic conditions 6 to 9 months hence) had yet another struggling week, but finally made a test of (albeit lower) of its 50-day MA. We should punch thru this level later on this week.
Russell 2000 Small Caps Index (proxy for Risk ON/OFF) did punch thru its 50-day MA. RISK is slowly coming back to our markets.
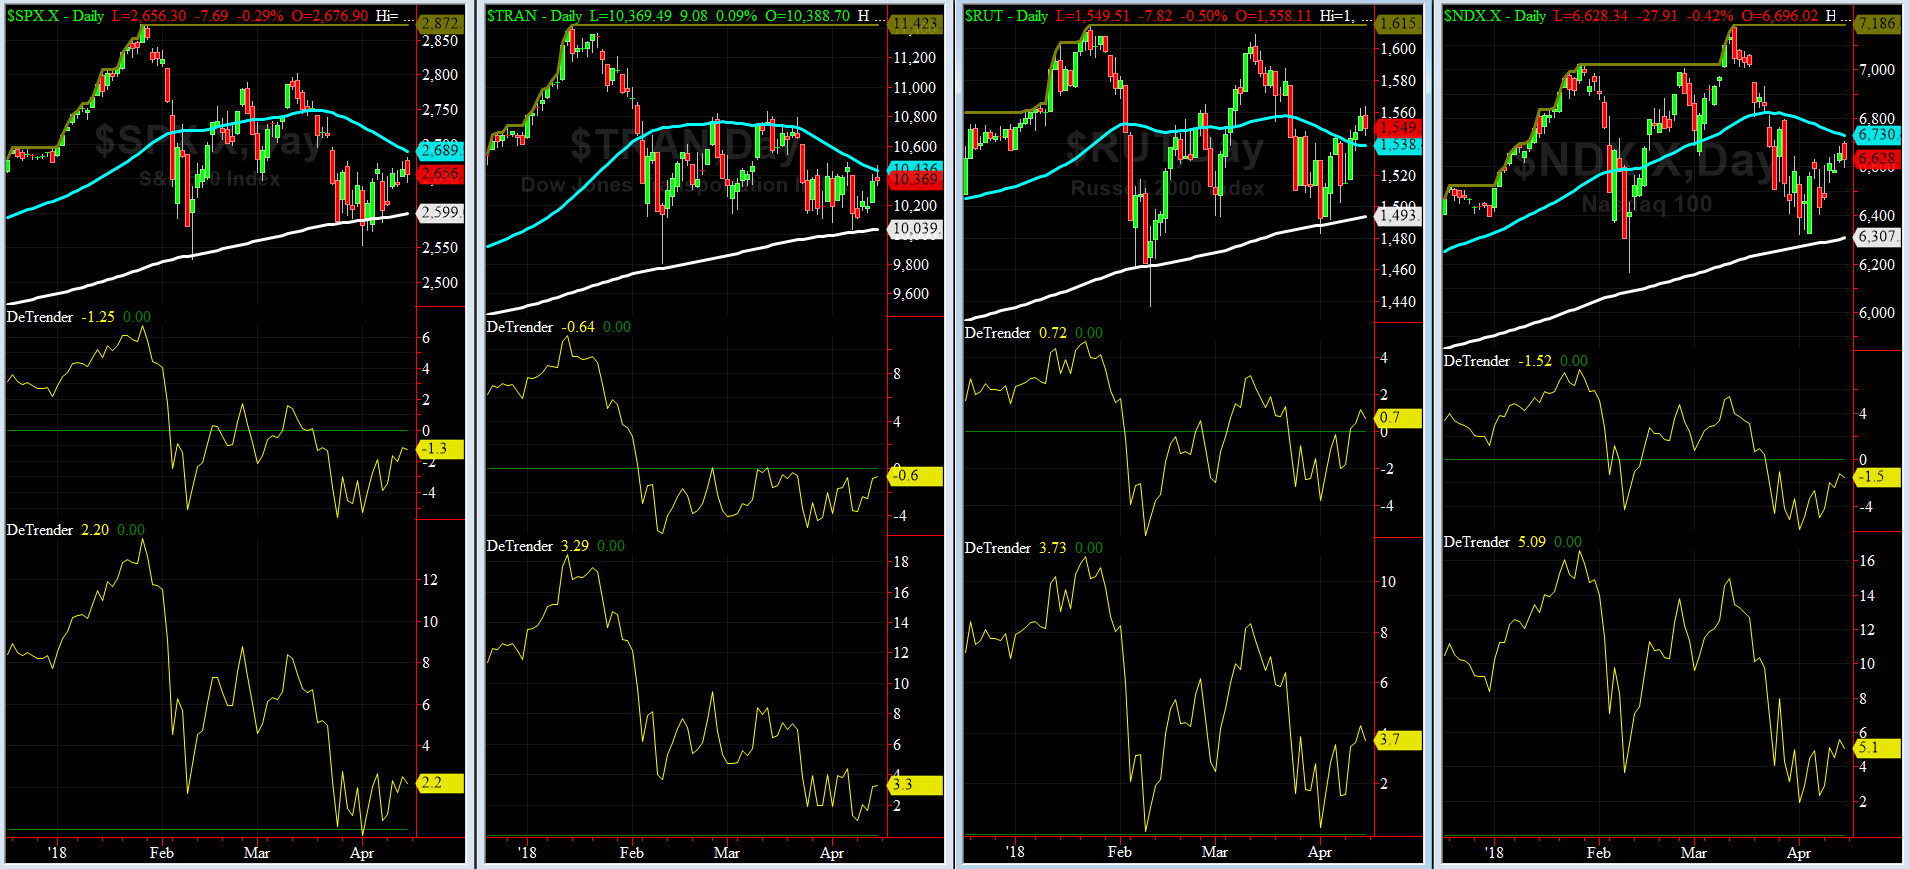
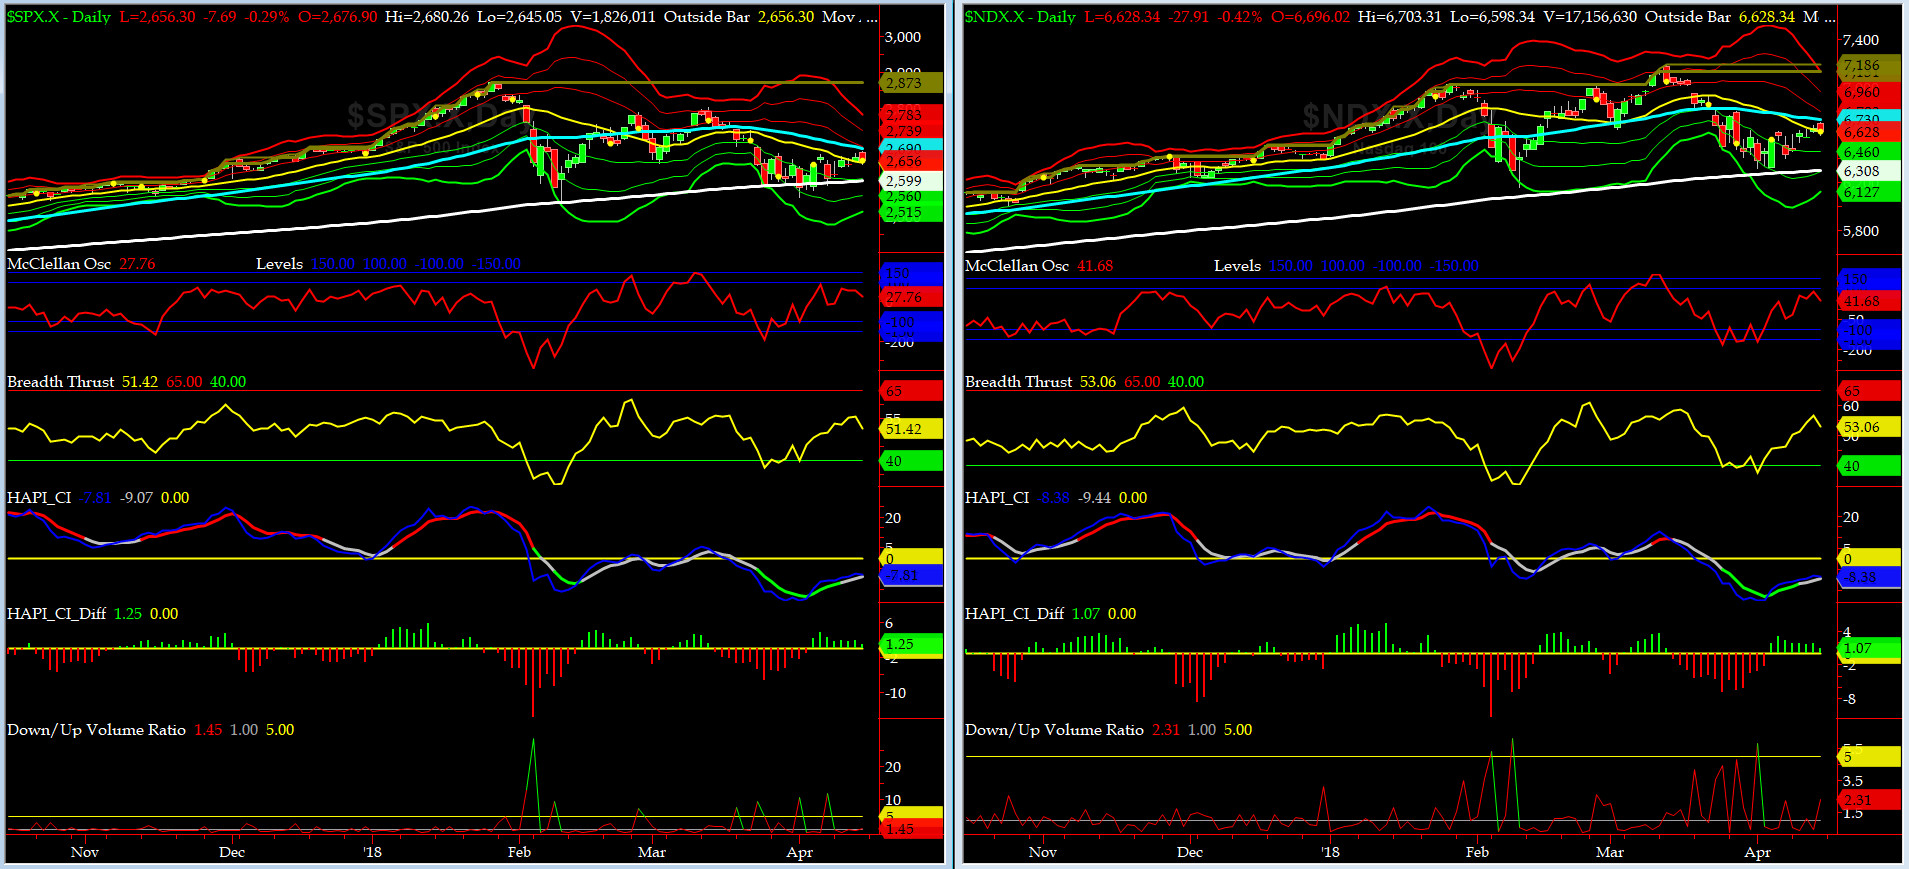
DeTrenders Charts for SPX, NDX, TRAN & RUT Indices
50-Day MA SPX = 2709 or 3.9% above SPX (max observed in last 7 yrs = +8.6%, min = -9.3%)
200-Day MA SPX = 2593 or 0.4% below SPX (max observed in last 7 yrs = 15.2%, min = -14%)
THREE of our EIGHT DeTrenders remain in POSITIVE territory. The DeTrenders for DJ Tran & RUT will continue to be harbingers of future price behavior in broad indices.
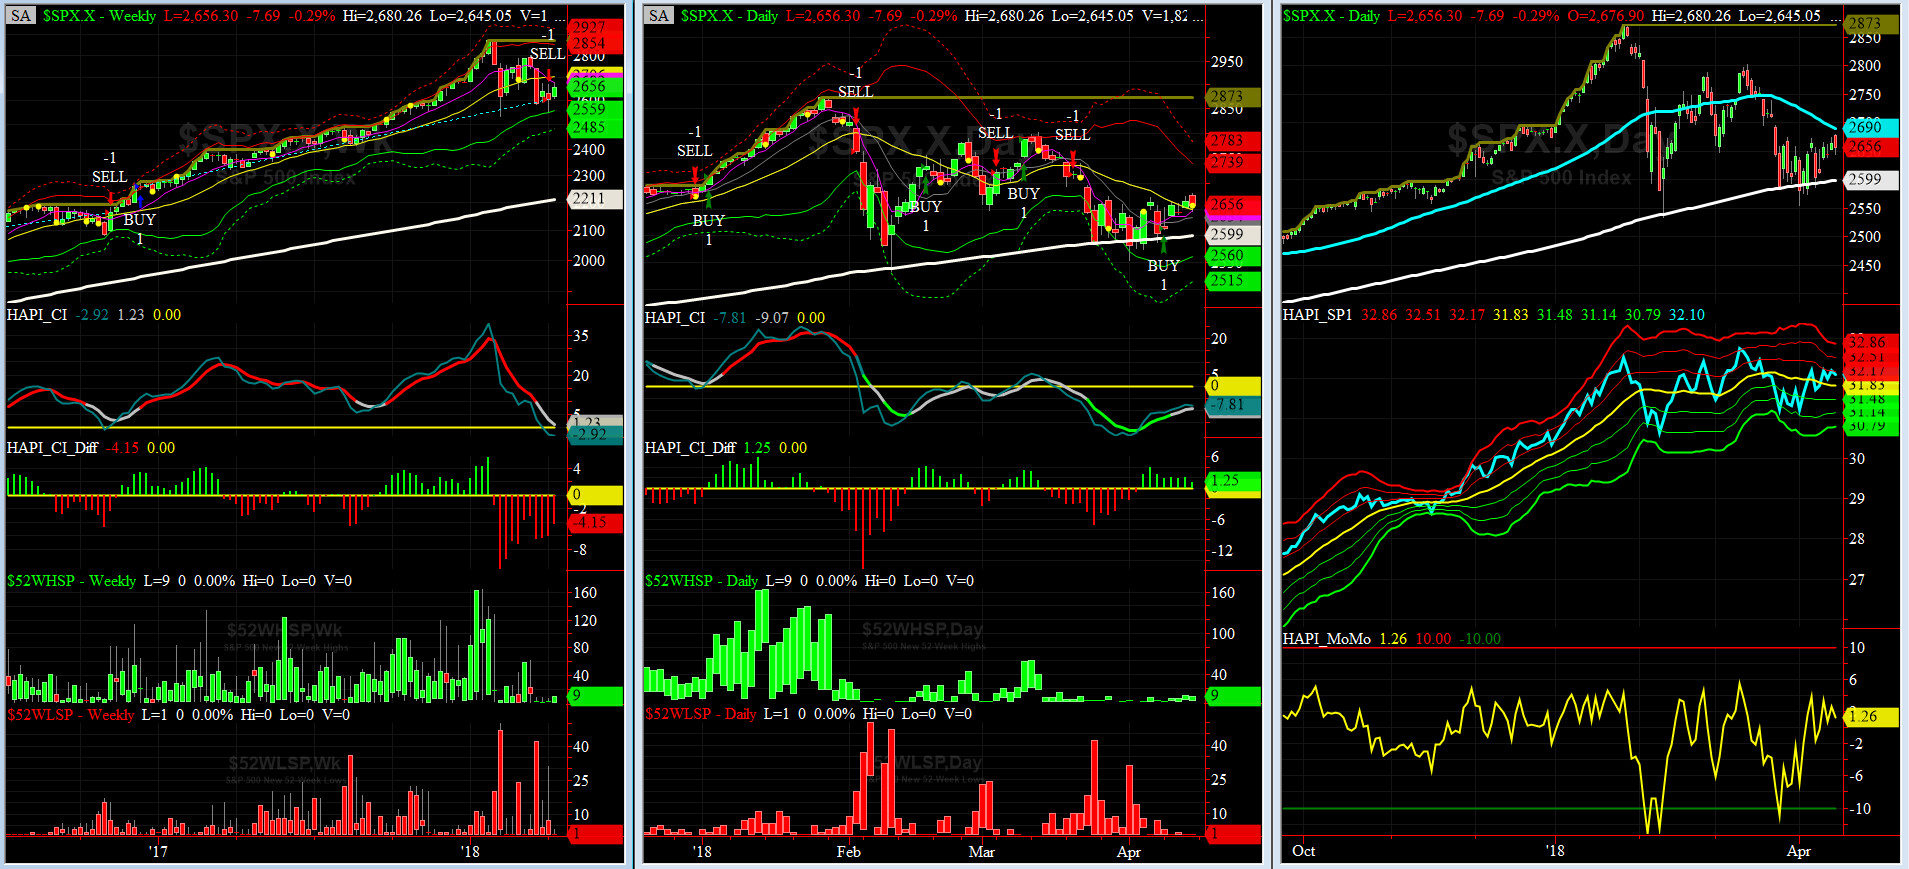
HA_SP1_Momo Chart
WEEKLY Timing Model = on a SELL Signal since Friday 4/06/118 CLOSE at 2604
DAILY Timing Model = on a BUY Signal since Tuesday 4/09/18 CLOSE at 2613
Max SPX 52wk-highs reading last week = 10 (over 120-140, the local maxima is in)
Max SPX 52wk-Lows reading last week = 3 (over 40-60, the local minima is in)
HA_SP1 closed near its +1 sigma channels
HA_Momo = +1.26 (reversals most likely occur above +10 or below -10)
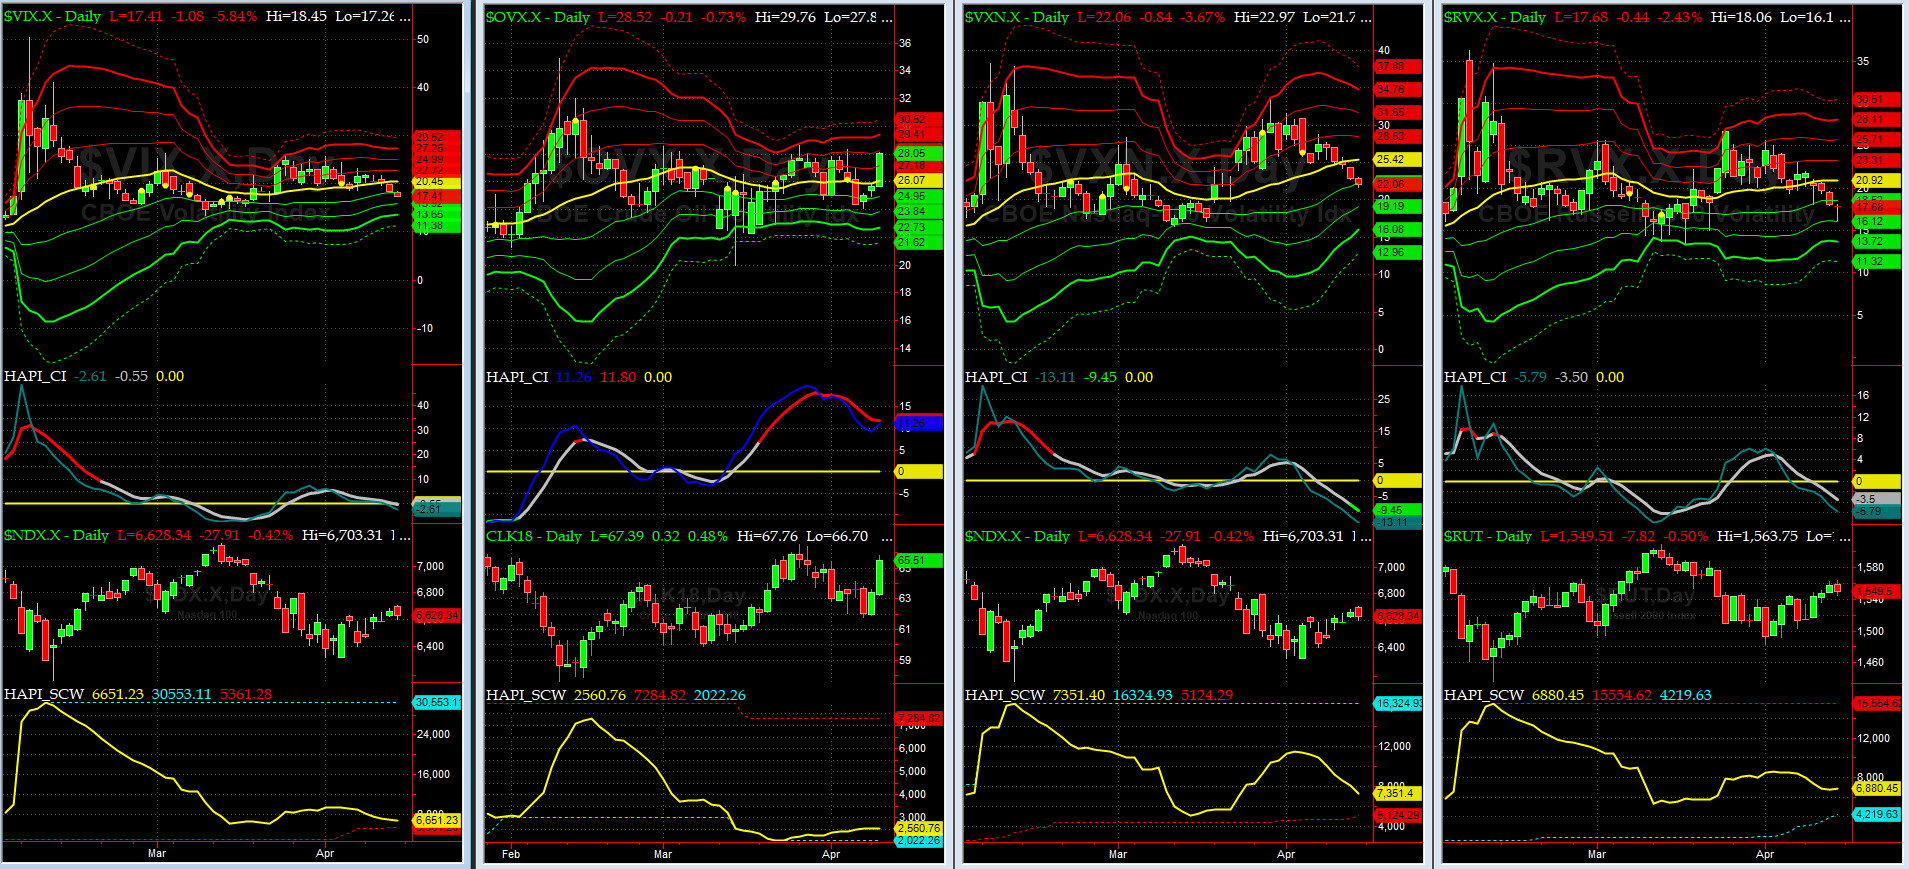
Vol of the Vols Chart
VIX currently stands at 17.4.49, just above its -1 sigma (remember it's the VIX volatility pattern aka "its sigma channels" that matters, and not the level of VIX itself (this is per Dr. Robert Whaley, a great mentor and inventor of original VIX, now called VXO). VIX usually peaks around a test of its +4 sigma).
This week, VIX Futures discontinued their mild Contango and went into backwardation. This says we went thru a trade-able low. Our @Capt_Tiko also responds in the affirmative
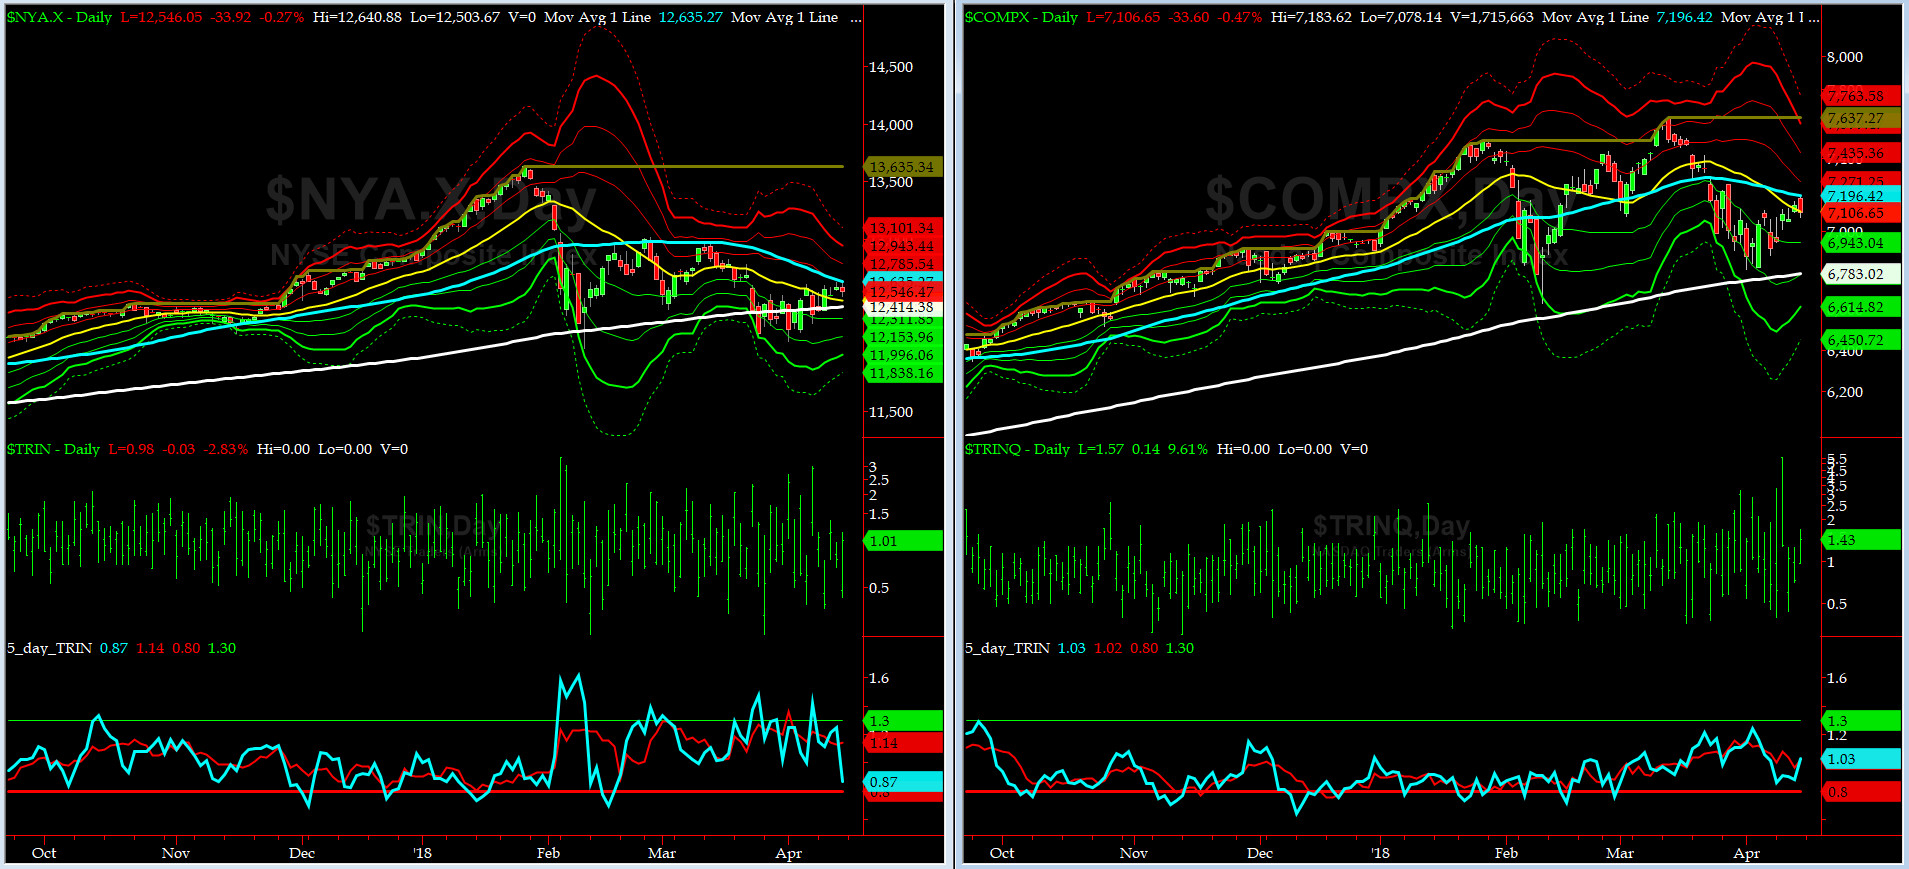
5-day TRIN & TRINQ Charts
NYSE 5-day TRIN shoots towards its SELL Zone while NASDAQ's is moving back into NEUTRAL zone.
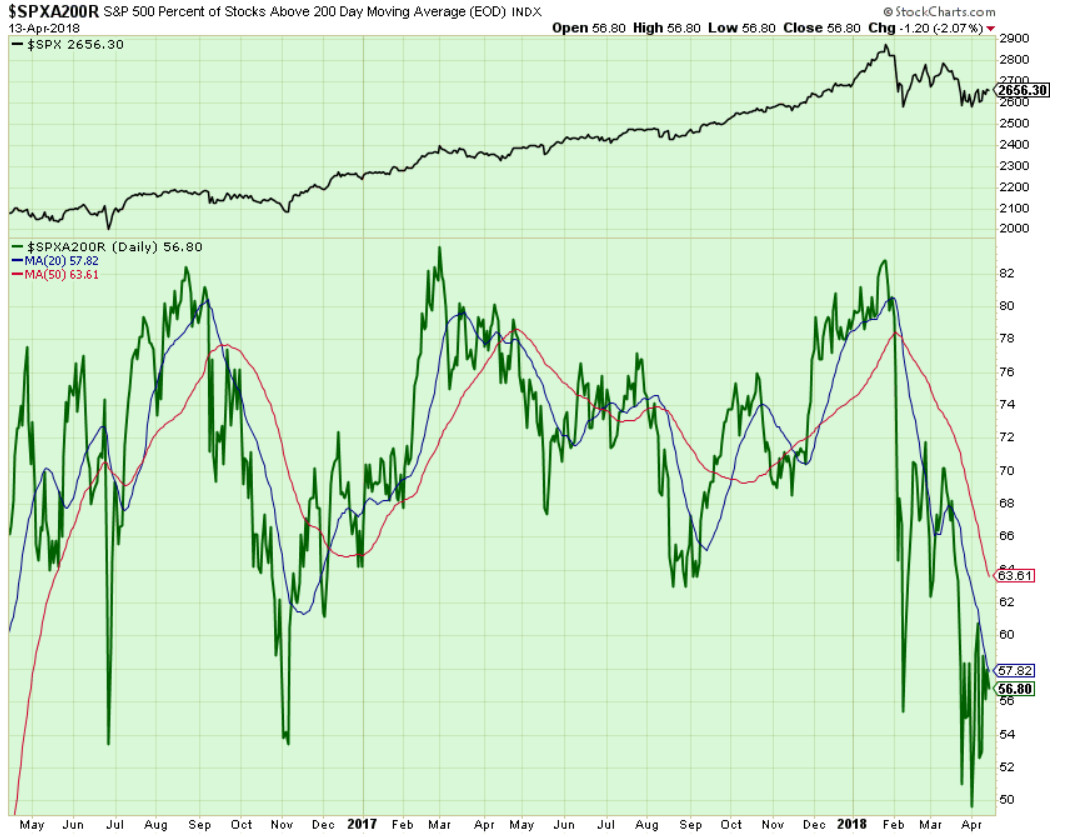
Components of SPX above their respective 200day MA Chart
This scoring indicator oscillated between 55 & 58 61, and then finally ended up at 56.8%.

SPX SKEW (Tail Risk) Chart
Last week SPX SKEW (Tail Risk) closed at 126, or near its zero sigma (normal = 120-125, range 100-150).
Is all quiet on the Eastern & Mid-Western Fronts? Smart Money says YES again.
How to interpret the value of SPX SKEW? (from CBOE white paper on SKEW)

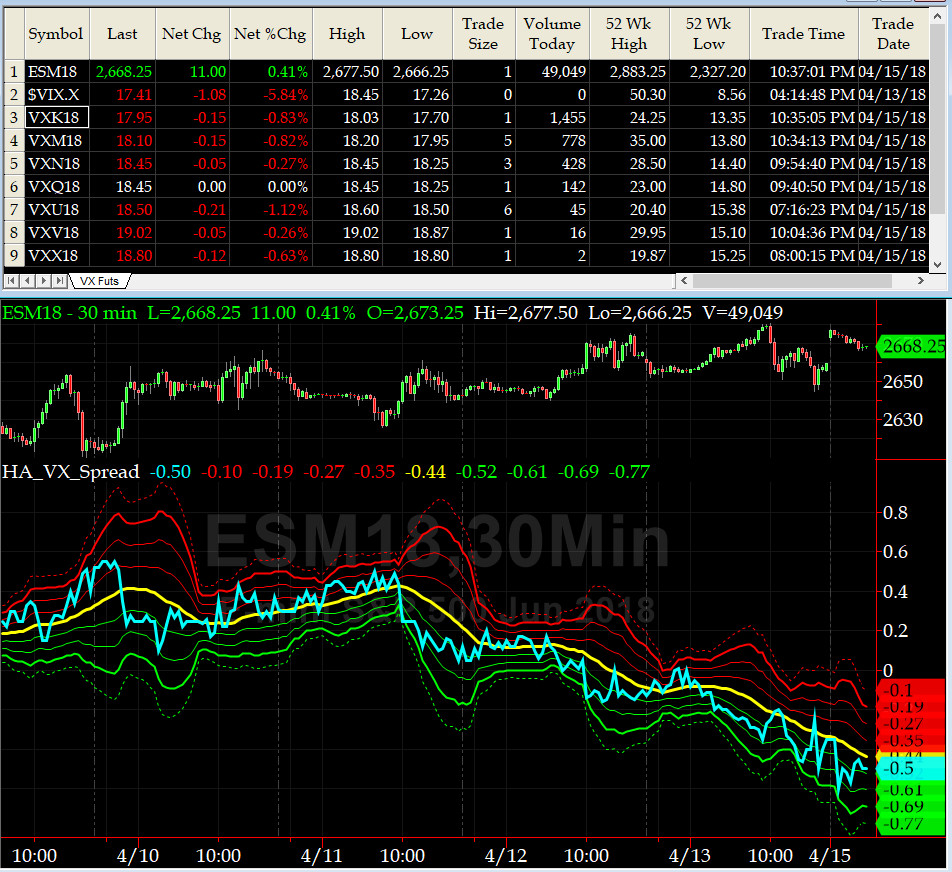
3-month VIX Futures Spread(VX) Chart
This popular timing indicator, now long May, and short August VIX Futures near -0.35. Is the bottom in? @Capt_Tiko shouts YES.
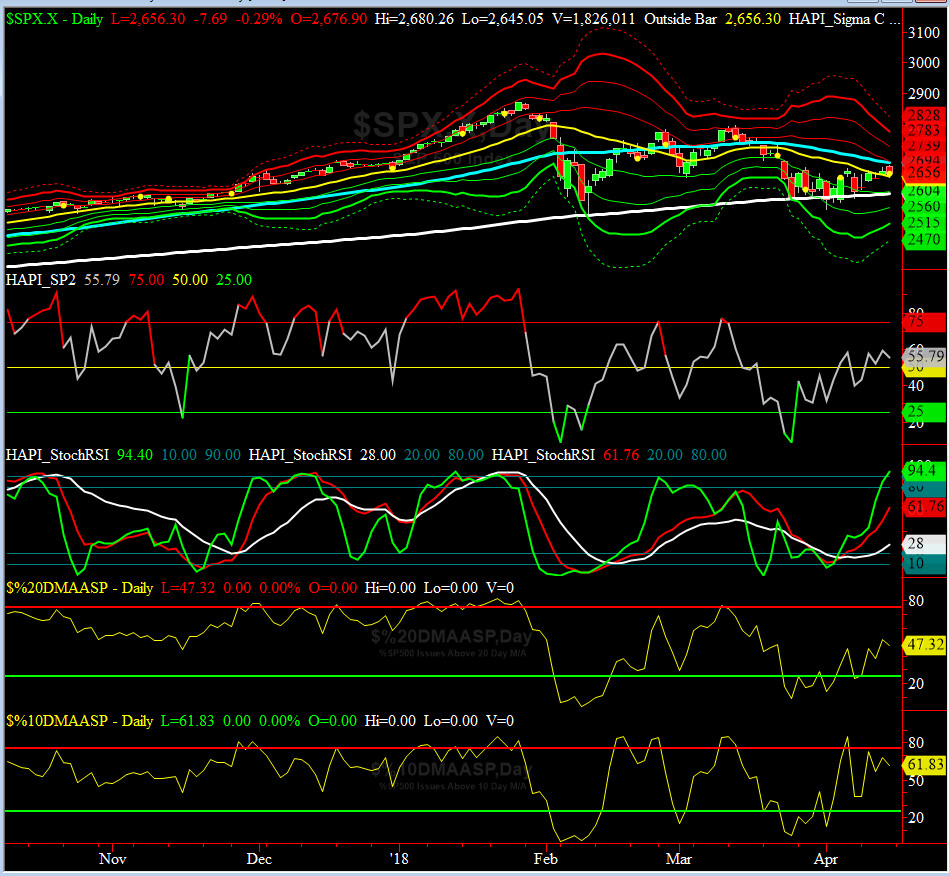
HA_SP2 Chart
HA_SP2 = 55.8 (Buy signal <= 25, Sell Signal >= 75)
This coveted prop indicator has struggled just above 50 area for a week now but we do expect it to rally up this week. Also worth noting is the pattern of 3 timeframe Stoch_RSIs. Looking to recompute/recaliberate our bias once all three are above 80% mark.

US Treasury T-Notes & T-Bonds Yields Chart
The Flight-to-Safety Trade is over, and our beloved Maury, has his dancing shoes once again.
Fari Hamzei
|


 Proactive Market Timing