
|
 |
 |
 |
 |
 |
 |
 |
 |
 Proactive Market Timing Proactive Market Timing
|
|
|
Most Recent PMT vs SPX Performance Chart

|
|
|
|
Tuesday, June 19, 2018, 0935ET
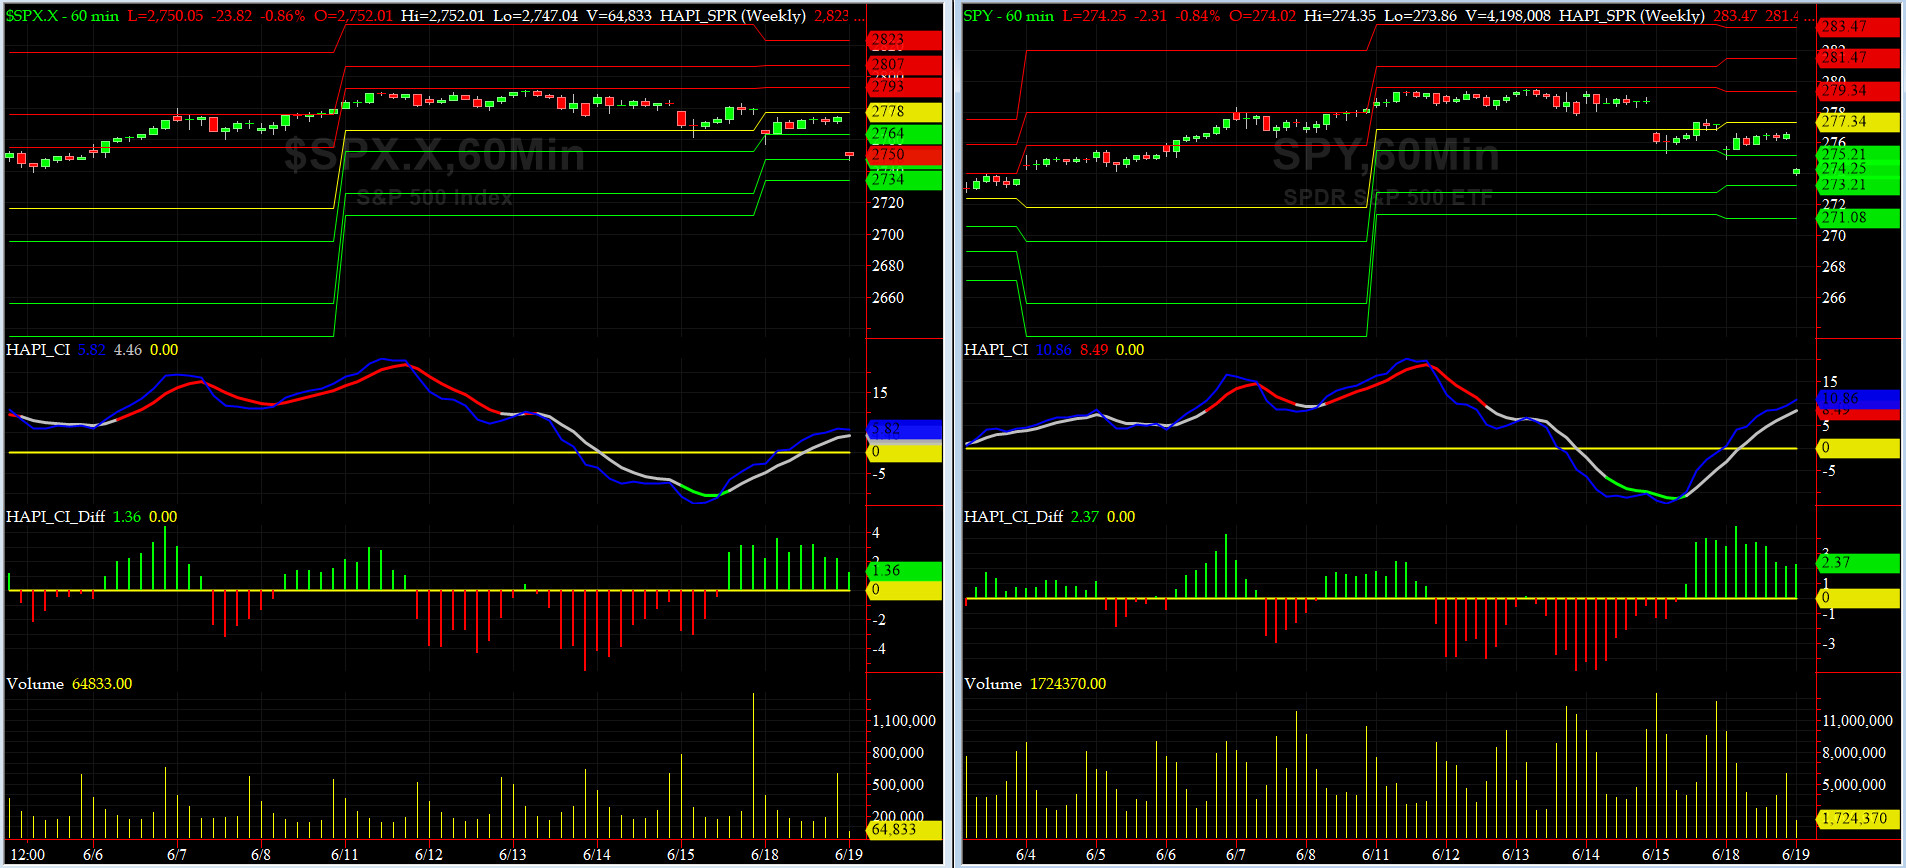
UPDATED Companion Chart for Market Bias Review, Issue #245
|
|
|
|
|
|
Tuesday, June 19, 2018, 0933ET
UPDATED Market Bias for Issue #245
Our current Market Bias with Timer Digest is SHORT SPX as of JUN 18 at 2773.75
Our previous Market Bias was LONG SPX as of JUN 1 at 2734.62
Here are the trade parameters for this week:
SPX Money Management Stop for 100% of our position = 2780
SPX BreakEven Stop (Last Open) for last 20% of our position = 2752
SPX Primary Profit Target for first 80% of our position = 2720
SPX Secondary Profit Target for last 20% of our position = 2705
|
| Action |
Asset |
Expiration |
Strike |
Option |
| BUY |
SPY |
Friday JUL 6 |
274 |
Puts |
| SELL SHORT |
SPY |
Friday JUL 6 |
269 |
Puts |
| You need to execute both legs and hold it as a Put-Spread.
|
Note A:
Once the Primary Profit Target has been reached, traders are advised to close 80% of their position in order to lock in profits. The remaining balance can be carried over with a BreakEven STOP, based on the SPX level at the time of entry, in order to make the trade a zero-risk trade with the final position running to reach the Secondary Profit Target.
Once either Secondary Profit or Money Management (BreakEven STOP after the 80% peel-off) is hit, our Option/ETF trade for that week is over. Go to Cash and wait for the next PMT Issue.
Note B:
When we change our Market Bias with Timer Digest, You need to go FLAT asap. With PMT Pro, that is before the Close that day and with the basic PMT, at the open of the next day. The following trading day, we will issue new SPX targets and a new SPY options trade, as long our new market bias with Timer Digest is NOT flat.
Fari Hamzei
|
|
|
|
|
|
Monday, June 18, 2018, 2324ET
Notice of Change of Bias with Timer Digest
Dear Jim,
Again, we saw rapid deterioration in the market internals today during the RTH, and now, futures are off heavy�..it is time to let go of our LONG Bias.
We are going SHORT SPX here���
Fari Hamzei
|
|
|
|
|
|
Monday, June 18, 2018, 1020ET
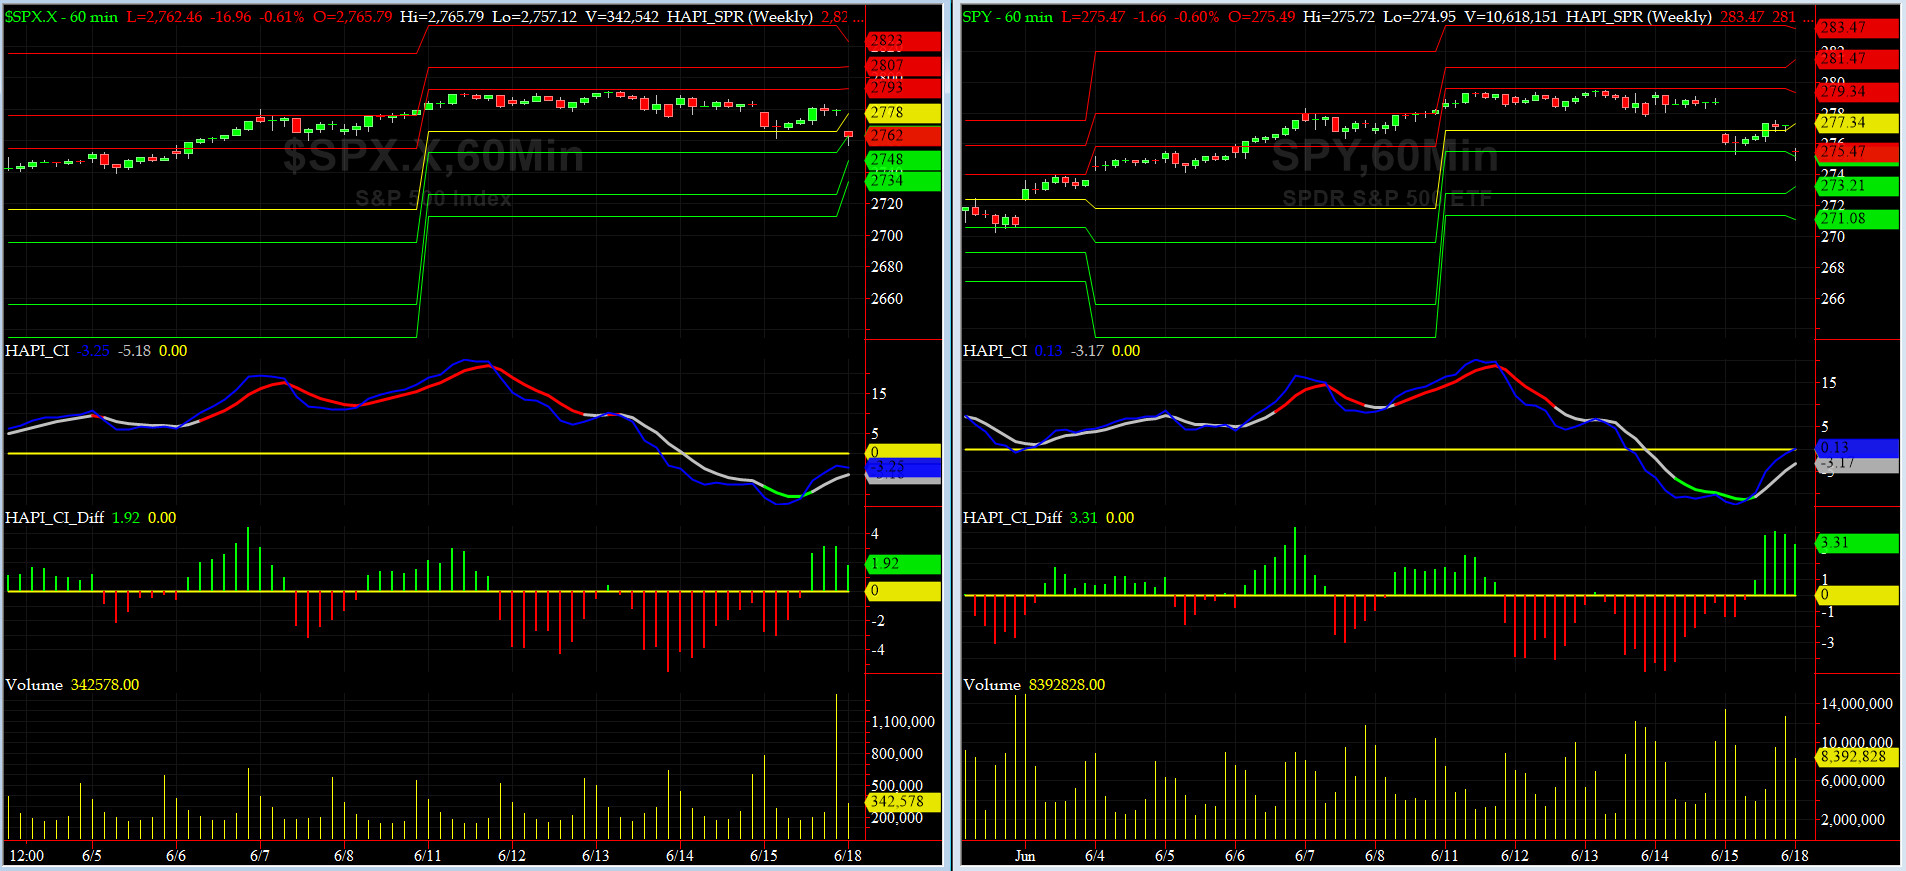
Companion Chart for Market Bias Review, Issue #245
|
|
|
|
|
|
Monday, June 18, 2018, 1015ET
Market Bias for Issue #245
Our current Market Bias with Timer Digest is LONG SPX as of JUN 1 at 2734.62
Our previous Market Bias was SHORT SPX as of MAY 22 at 2724.44
Here are the trade parameters for this week:
SPX Secondary Profit Target for last 20% of our position = 2805
SPX Primary Profit Target for first 80% of our position = 2780
SPX BreakEven Stop (Last Open) for last 20% of our position = 2766
SPX Money Management Stop for 100% of our position = 2750
|
| Action |
Asset |
Expiration |
Strike |
Option |
| BUY |
SPY |
Friday JUL 6 |
276 |
Calls |
| SELL SHORT |
SPY |
Friday JUL 6 |
281 |
Calls |
| You need to execute both legs and hold it as a Call-Spread.
|
Note A:
Once the Primary Profit Target has been reached, traders are advised to close 80% of their position in order to lock in profits. The remaining balance can be carried over with a BreakEven STOP, based on the SPX level at the time of entry, in order to make the trade a zero-risk trade with the final position running to reach the Secondary Profit Target.
Once either Secondary Profit or Money Management (BreakEven STOP after the 80% peel-off) is hit, our Option/ETF trade for that week is over. Go to Cash and wait for the next PMT Issue.
Note B:
When we change our Market Bias with Timer Digest, You need to go FLAT asap. With PMT Pro, that is before the Close that day and with the basic PMT, at the open of the next day. The following trading day, we will issue new SPX targets and a new SPY options trade, as long our new market bias with Timer Digest is NOT flat.
Fari Hamzei
|
|
|
|
|
|
Sunday, June 17, 2018, 2300ET
Market Timing Charts, Analysis & Commentary for Issue #245
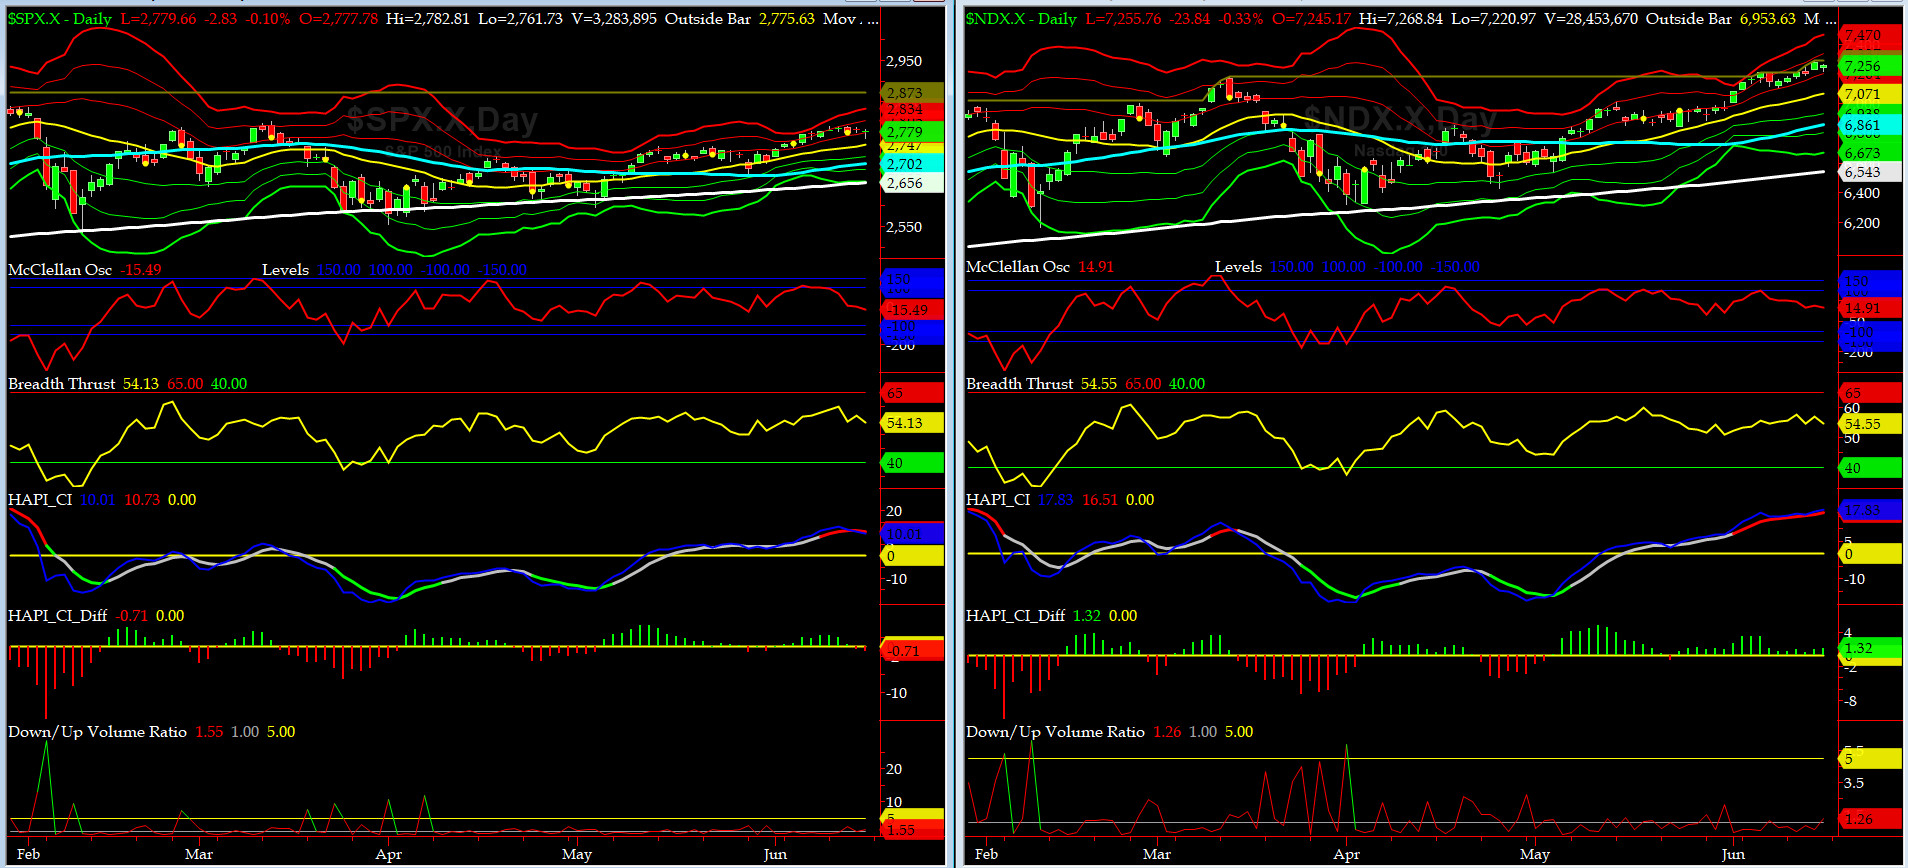
Timer Charts of S&P-500 Cash Index (SPX) + NASDAQ-100 Cash Index (NDX)
Most recent S&P-500 Cash Index (SPX): 2779 UNCHG for the week ending on Friday, June 15, 2018, which closed a tad above its +1 sigma.
DJIA ALL TIME INTRADAY HIGH = 26617 (reached on Friday, January 26, 2018)
TRAN ALL TIME INTRADAY HIGH = 11424 (reached on Tuesday, January 16, 2018)
SPX ALL TIME INTRADAY HIGH = 2873 (reached on Friday, January 26, 2018)
NDX ALL TIME INTRADAY HIGH = 7291 (reached on Thursday, June 14, 2018)
RUT ALL TIME INTRADAY HIGH = 1686 (reached on Tuesday, June 12, 2018)
Current DAILY +2 Sigma SPX = 2805 with WEEKLY +2 Sigma = 2820
Current DAILY 0 Sigma (20 day MA) SPX = 2747 with WEEKLY 0 Sigma = 2702
Current DAILY -2 Sigma SPX = 2688 with WEEKLY -2 Sigma = 2584
NYSE McClellan Oscillator = -15 (-150 is start of the O/S area; around -275 to -300 area or lower, we go into the �launch-pad� mode, over +150, we are in O/B area)
NYSE Breadth Thrust = 54.3 (40 is considered as oversold and 65 as overbought)
This past week we witnessed quite a bit of intraday volatility but ended up unchanged for the week. Seeing some [bearish] divergences as well.
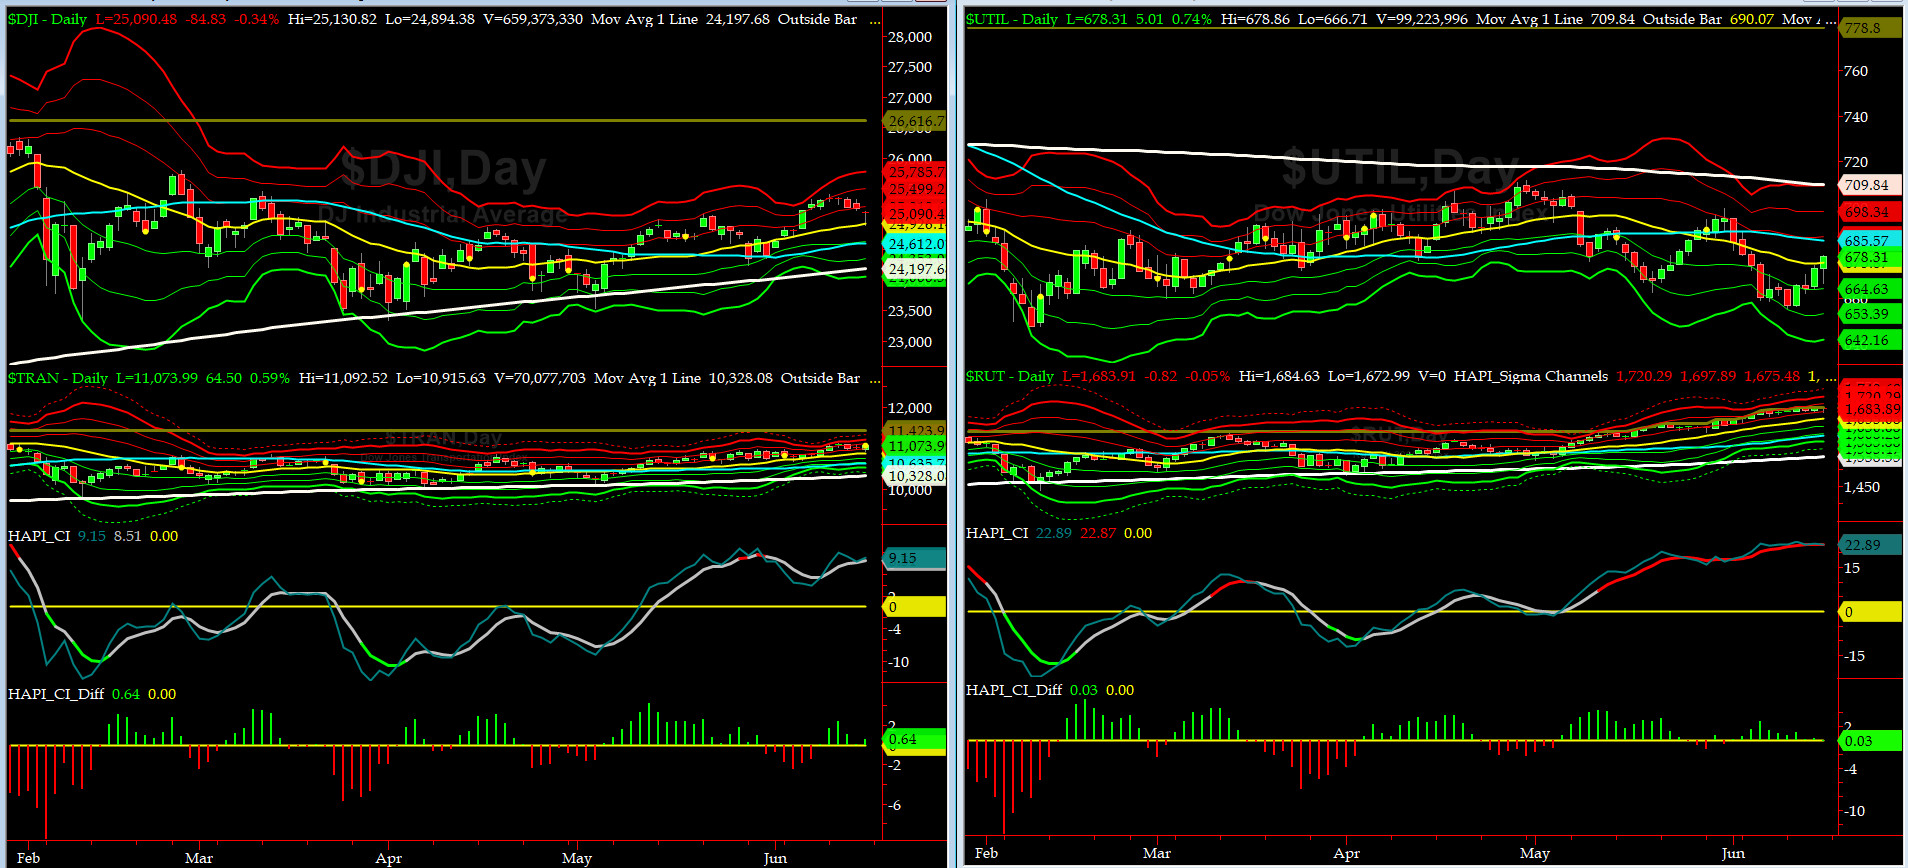
Canaries [in the Coal Mine] Chart for DJ TRAN & RUT Indices
200-Day MA DJ TRAN = 10,328 or 7.2% below DJ TRAN (max observed in last 7 yrs = 20.2%, min = -20.3%)
200-Day MA RUT = 1538 or 9.4% below RUT (max observed in last 7 yrs = 21.3%, min = -22.6%)
DJ Transportation Index (proxy for economic conditions 6 to 9 months hence) finally put in the breakout we have talked about in last 3 issues. Will there be a follow thru. We shall watch for that.
Russell 2000 Small Caps Index (proxy for Risk ON/OFF) is the golden cow that keeps on delivering more milk + cream (by delivering more new ATH each week). RISK is definitely ON.
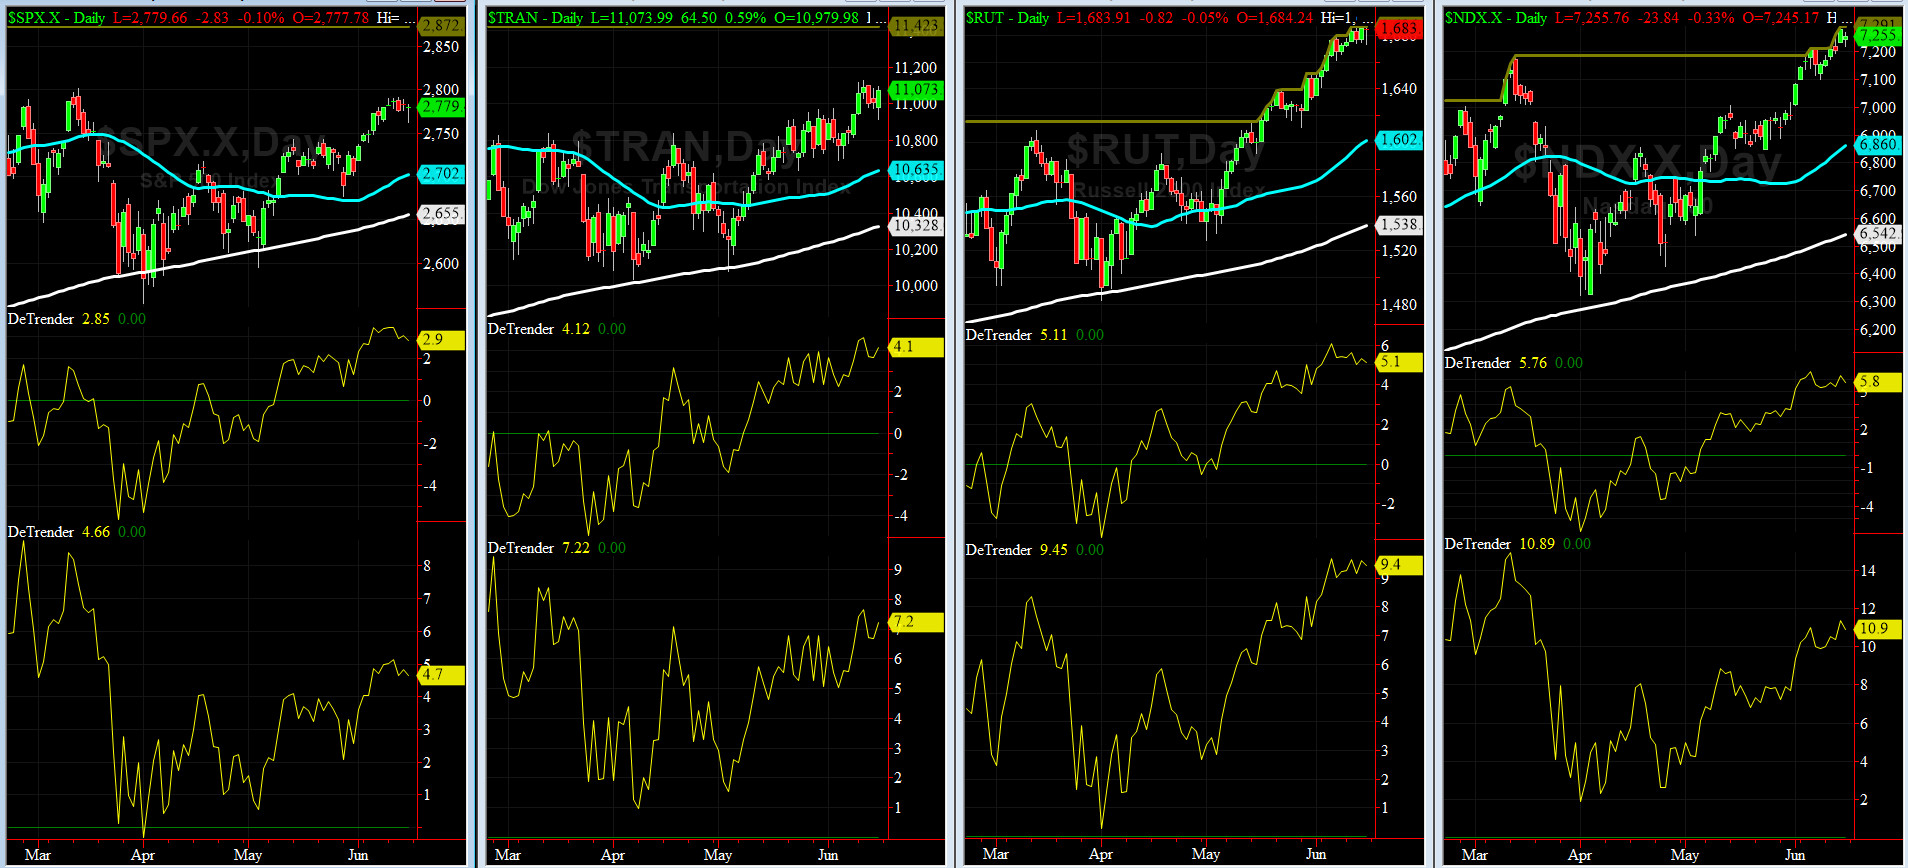
DeTrenders Charts for SPX, NDX, TRAN & RUT Indices
50-Day MA SPX = 2702 or 2.9% below SPX (max observed in last 7 yrs = +8.6%, min = -9.3%)
200-Day MA SPX = 2655 or 4.7% below SPX (max observed in last 7 yrs = 15.2%, min = -14%)
All EIGHT of our EIGHT DeTrenders remain in POSITIVE territory. The DeTrenders for DJ Tran & RUT will continue to be harbingers of future price behavior in broad indices.
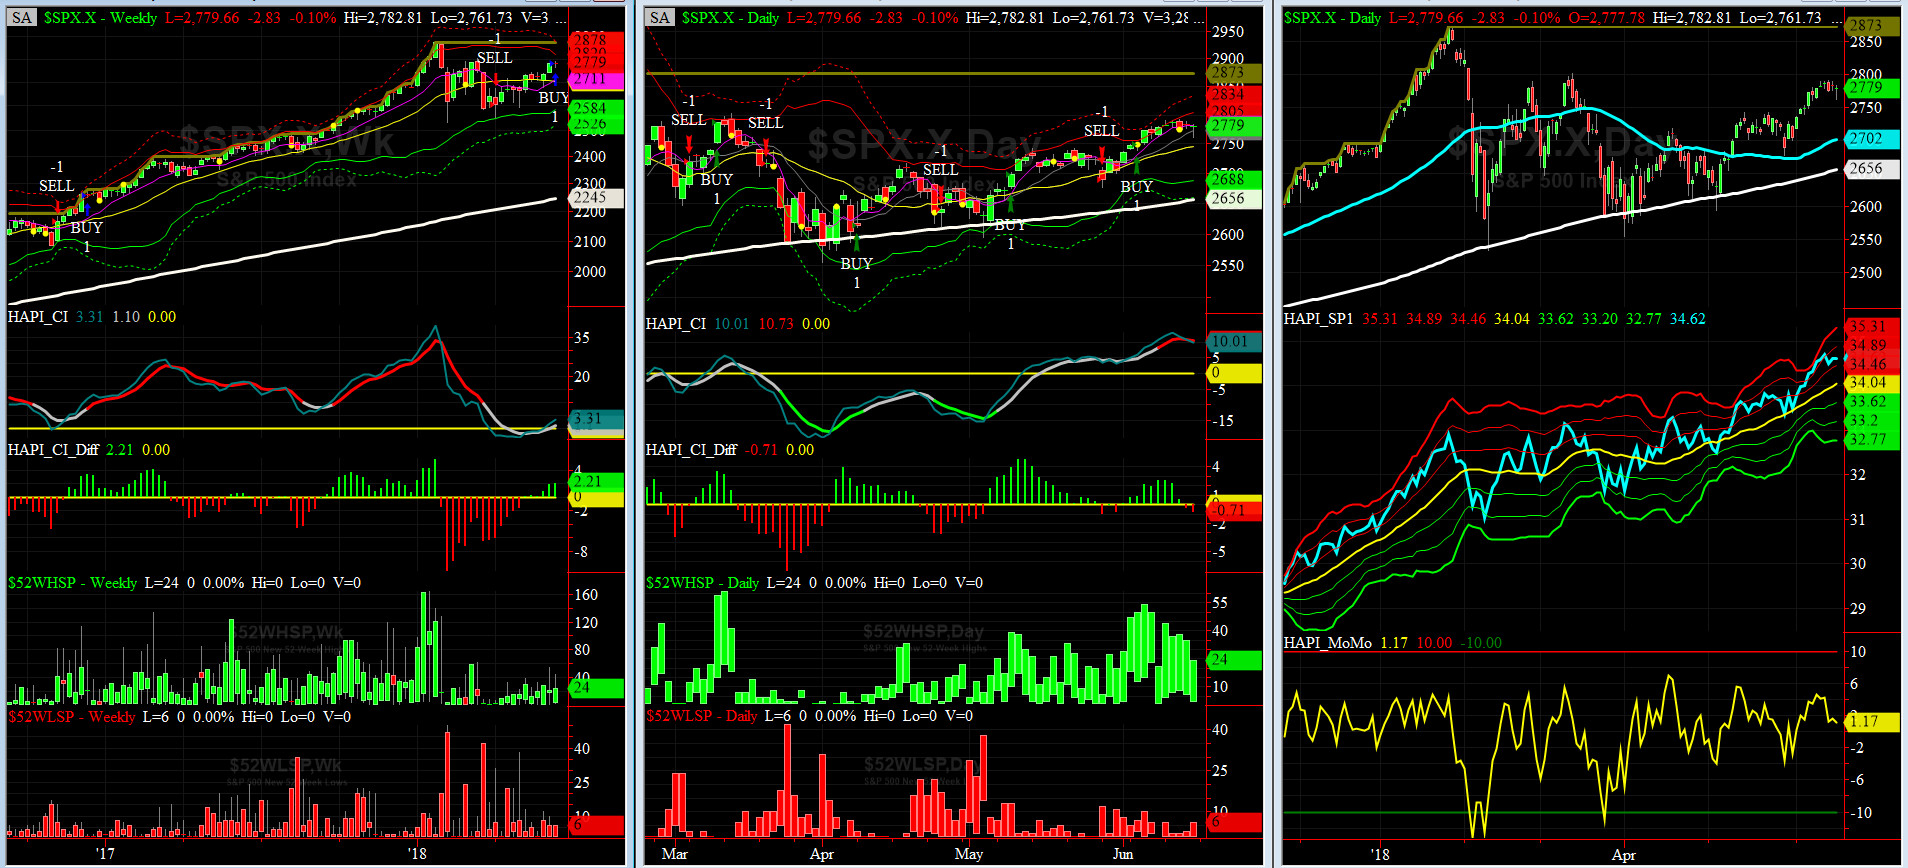
HA_SP1_Momo Chart
WEEKLY Timing Model = on a BUY Signal since Friday, June 15, 2018 CLOSE at 2779
DAILY Timing Model = on a BUY Signal since Wednesday, June 6, 2018 CLOSE at 2749
Max SPX 52wk-highs reading last week = 44 (over 120-140, the local maxima is in)
Max SPX 52wk-Lows reading last week = 6 (over 40-60, the local minima is in)
HA_SP1 closed almost at its +1.5 sigma channels
HA_Momo = +1.17 (reversals most likely occur above +10 or below -10)
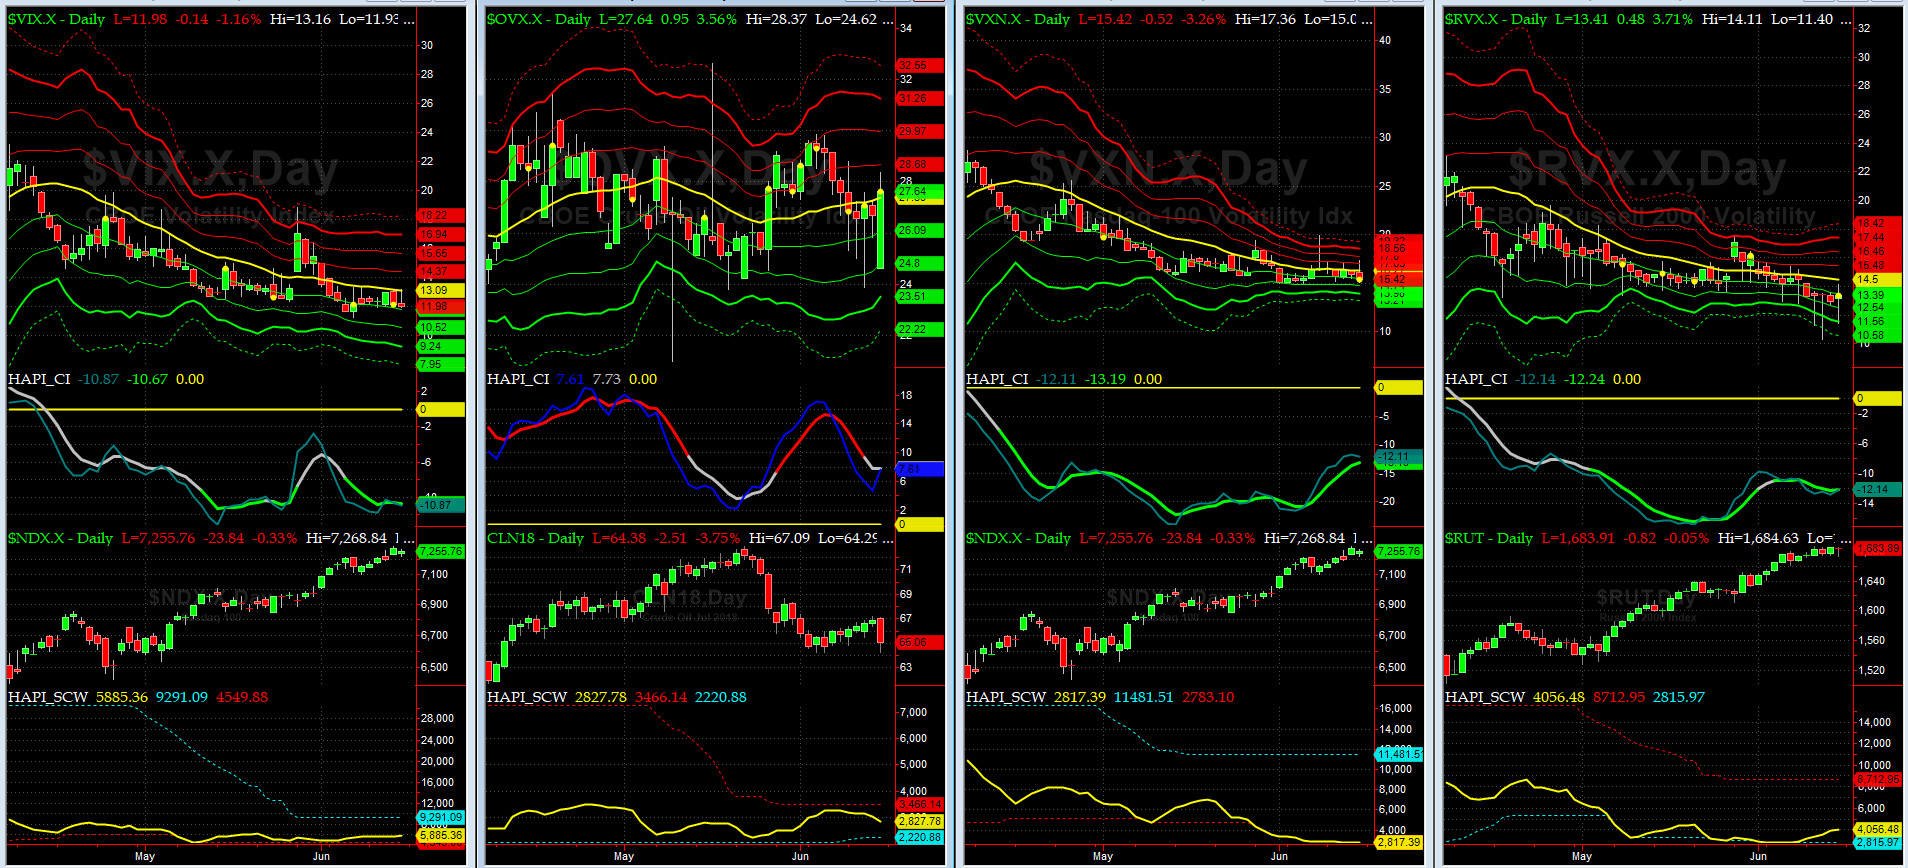
Vol of the Vols Chart
VIX currently stands at 11.98, just above its -1 sigma (remember it's the VIX volatility pattern aka "its sigma channels" that matters, and not the level of VIX itself (this is per Dr. Robert Whaley, a great mentor and inventor of original VIX, now called VXO). VIX usually peaks around a test of its +4 sigma).
Trading in VIX [derivatives] was dead money this past week.
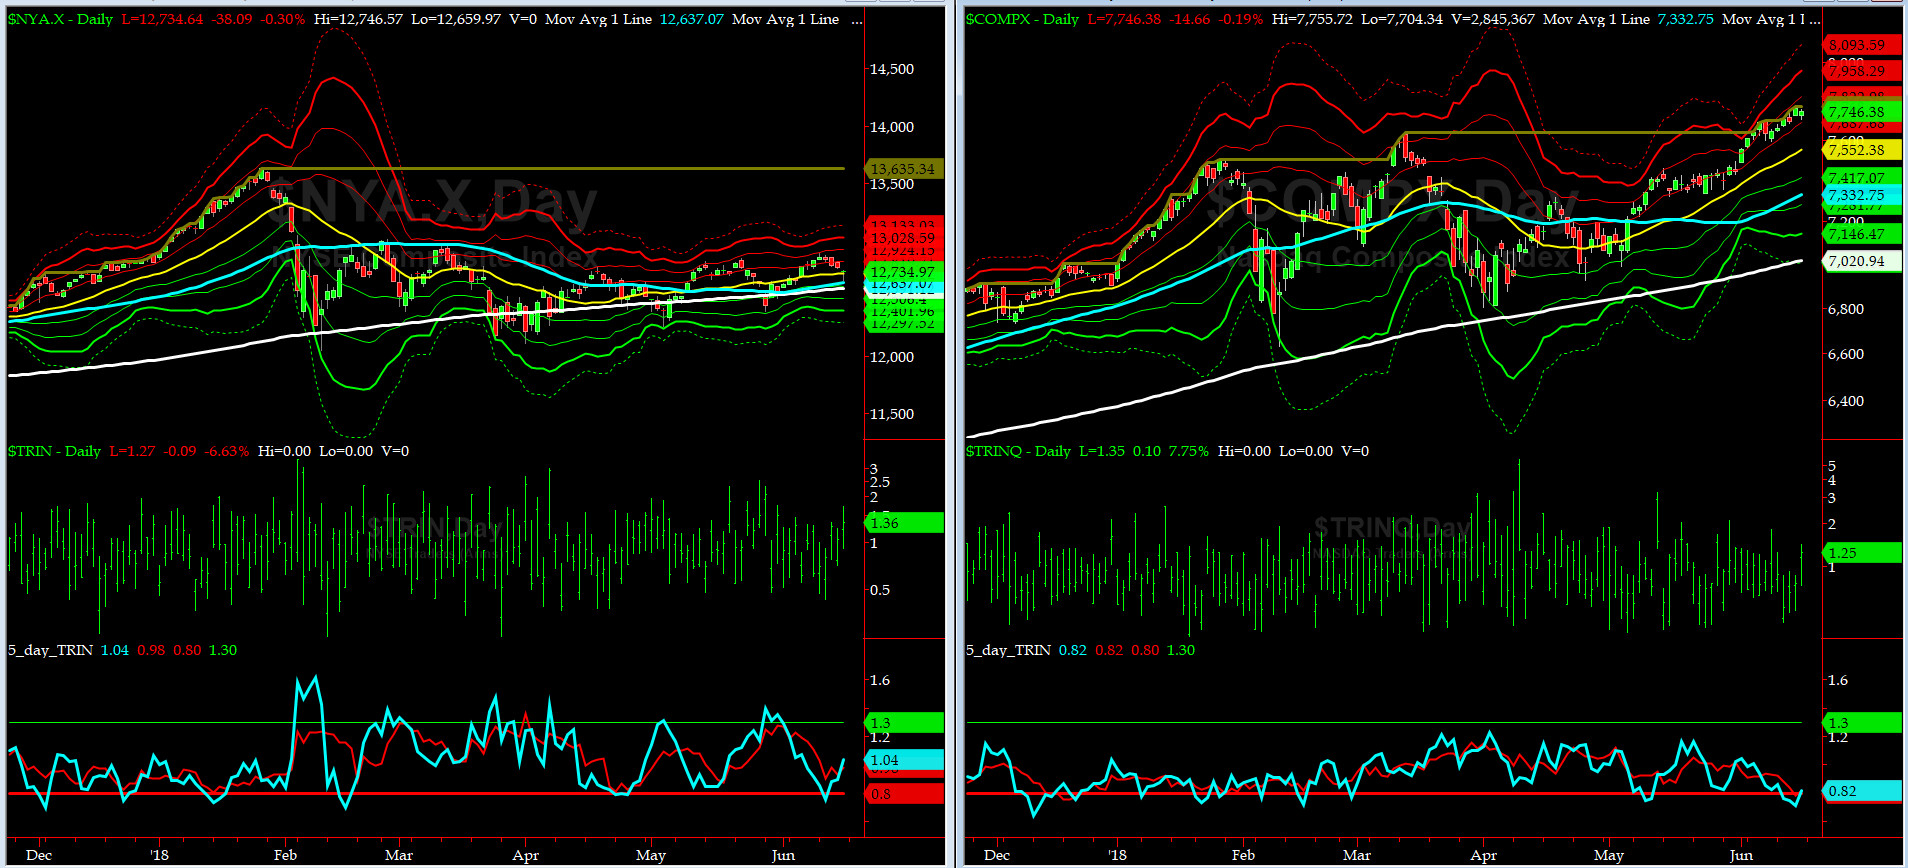
5-day TRIN & TRINQ Charts
While NYSE 5-day TRIN bounced back from the SELL zone and into NEUTRAL zone, its NASDAQ brethren, 5-day TRINQ, is still hovering the SELL zone.
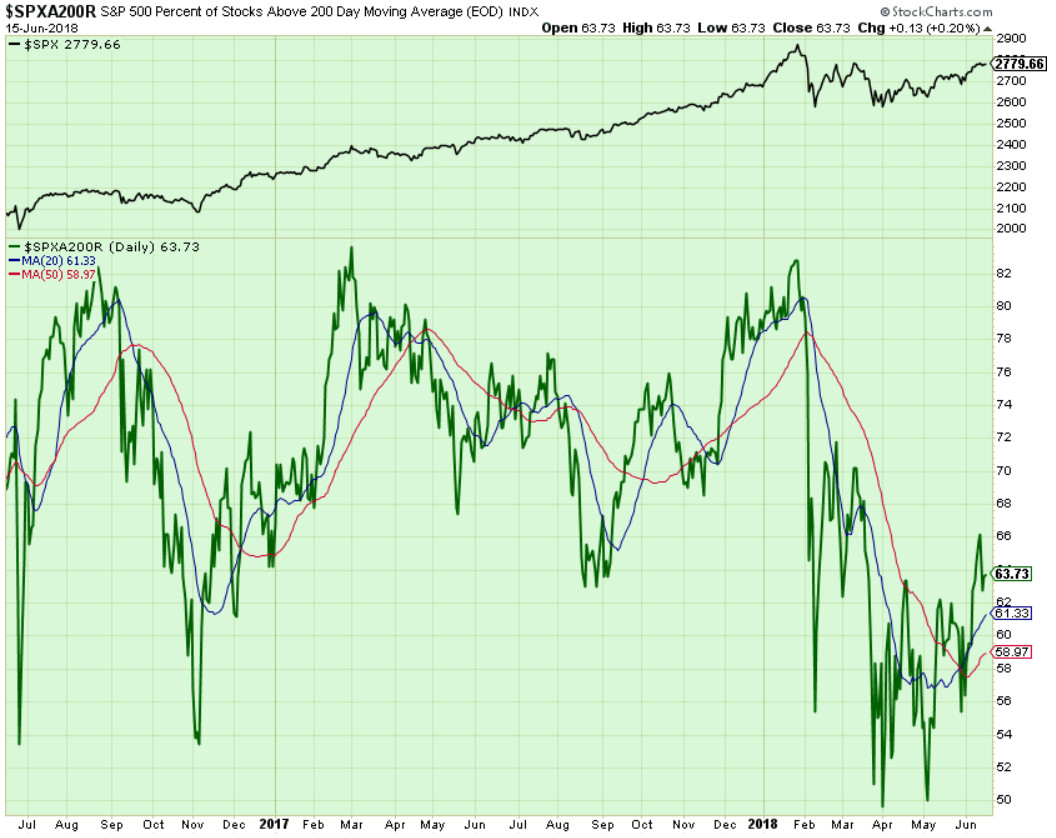
Components of SPX above their respective 200day MA Chart
This scoring indicator ended up a tad above 63.7% level, having failed at 66%. Its next target still will be in 68% to 72% area.
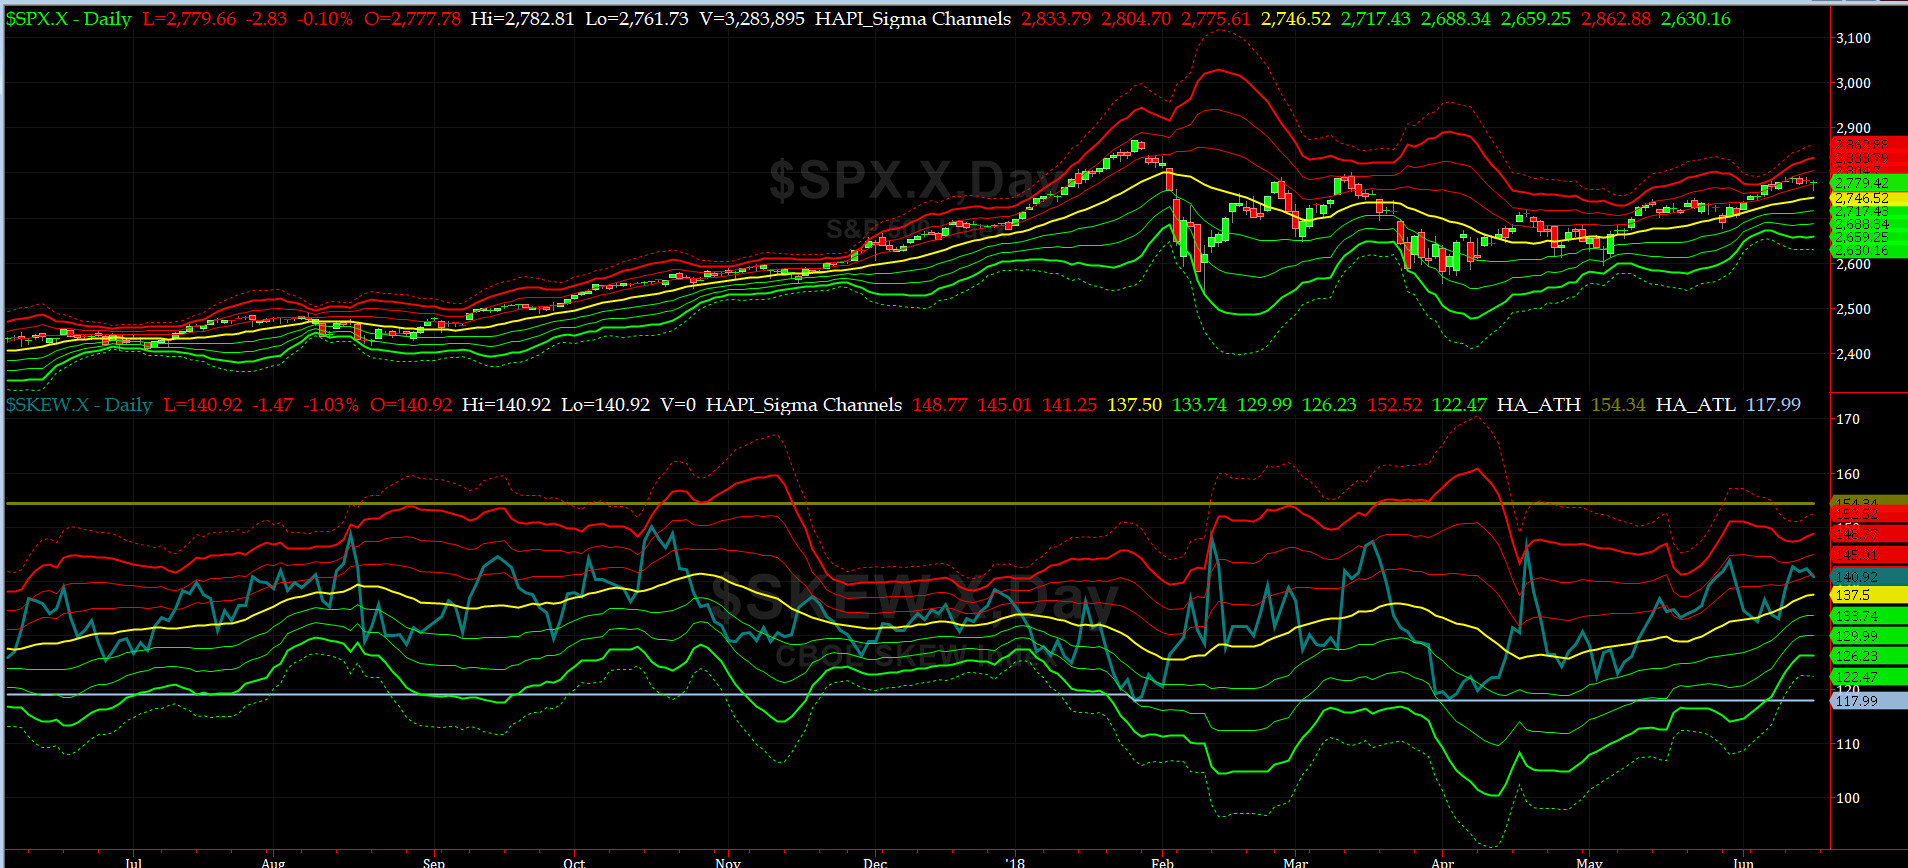
SPX SKEW (Tail Risk) Chart
On Friday, SPX SKEW (Tail Risk) closed near 140.9, right about its +1 sigma (normal = 120-125, range 100-150).
Is all quiet on the Eastern & Mid-Western Fronts? Again, YES for now.
How to interpret the value of SPX SKEW? (from CBOE white paper on SKEW)

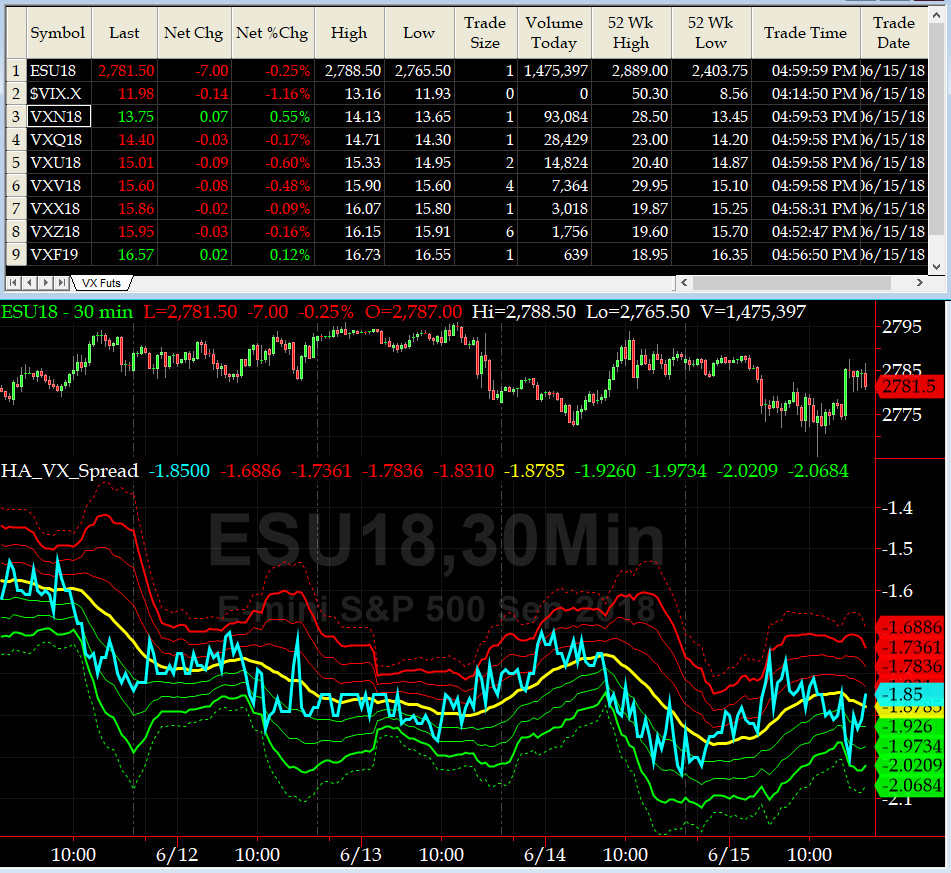
3-month VIX Futures Spread(VX) Chart
This popular timing indicator, (long July, & short Oct VIX Futures) is at -1.85. The signal here remains NEUTRAL.
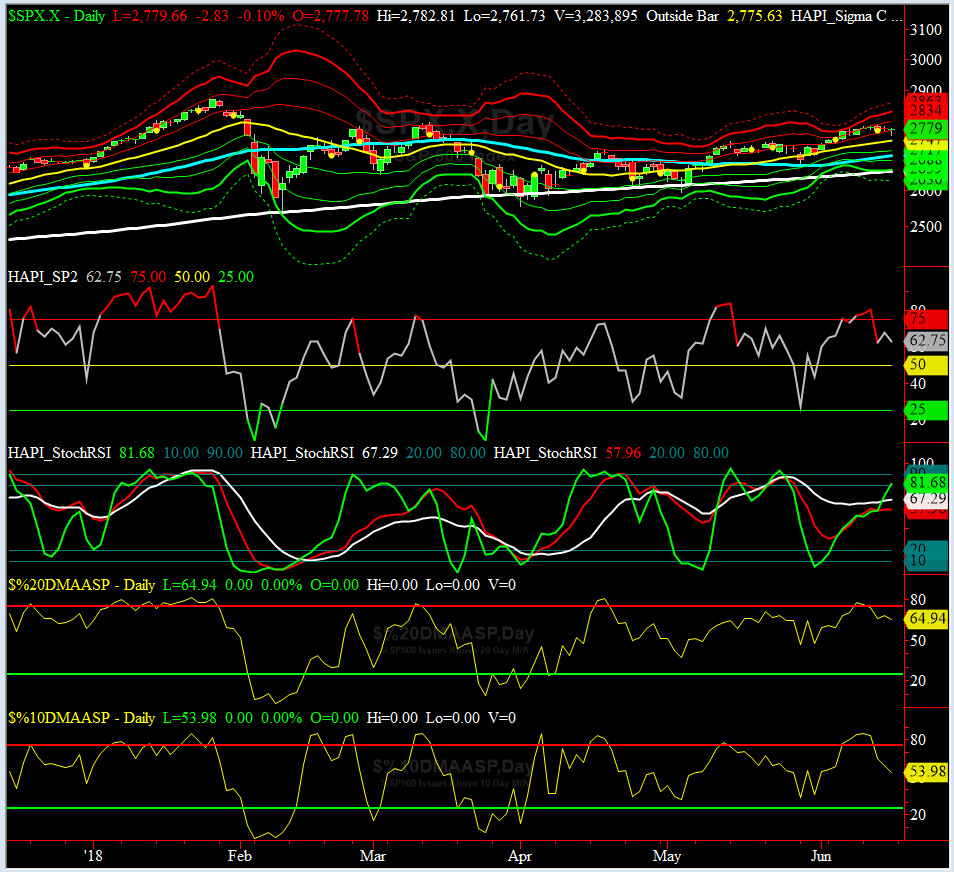
HA_SP2 Chart
HA_SP2 = 62.7 (Buy signal <= 25, Sell Signal >= 75)
This coveted prop indicator is now back down into Neutral zone.
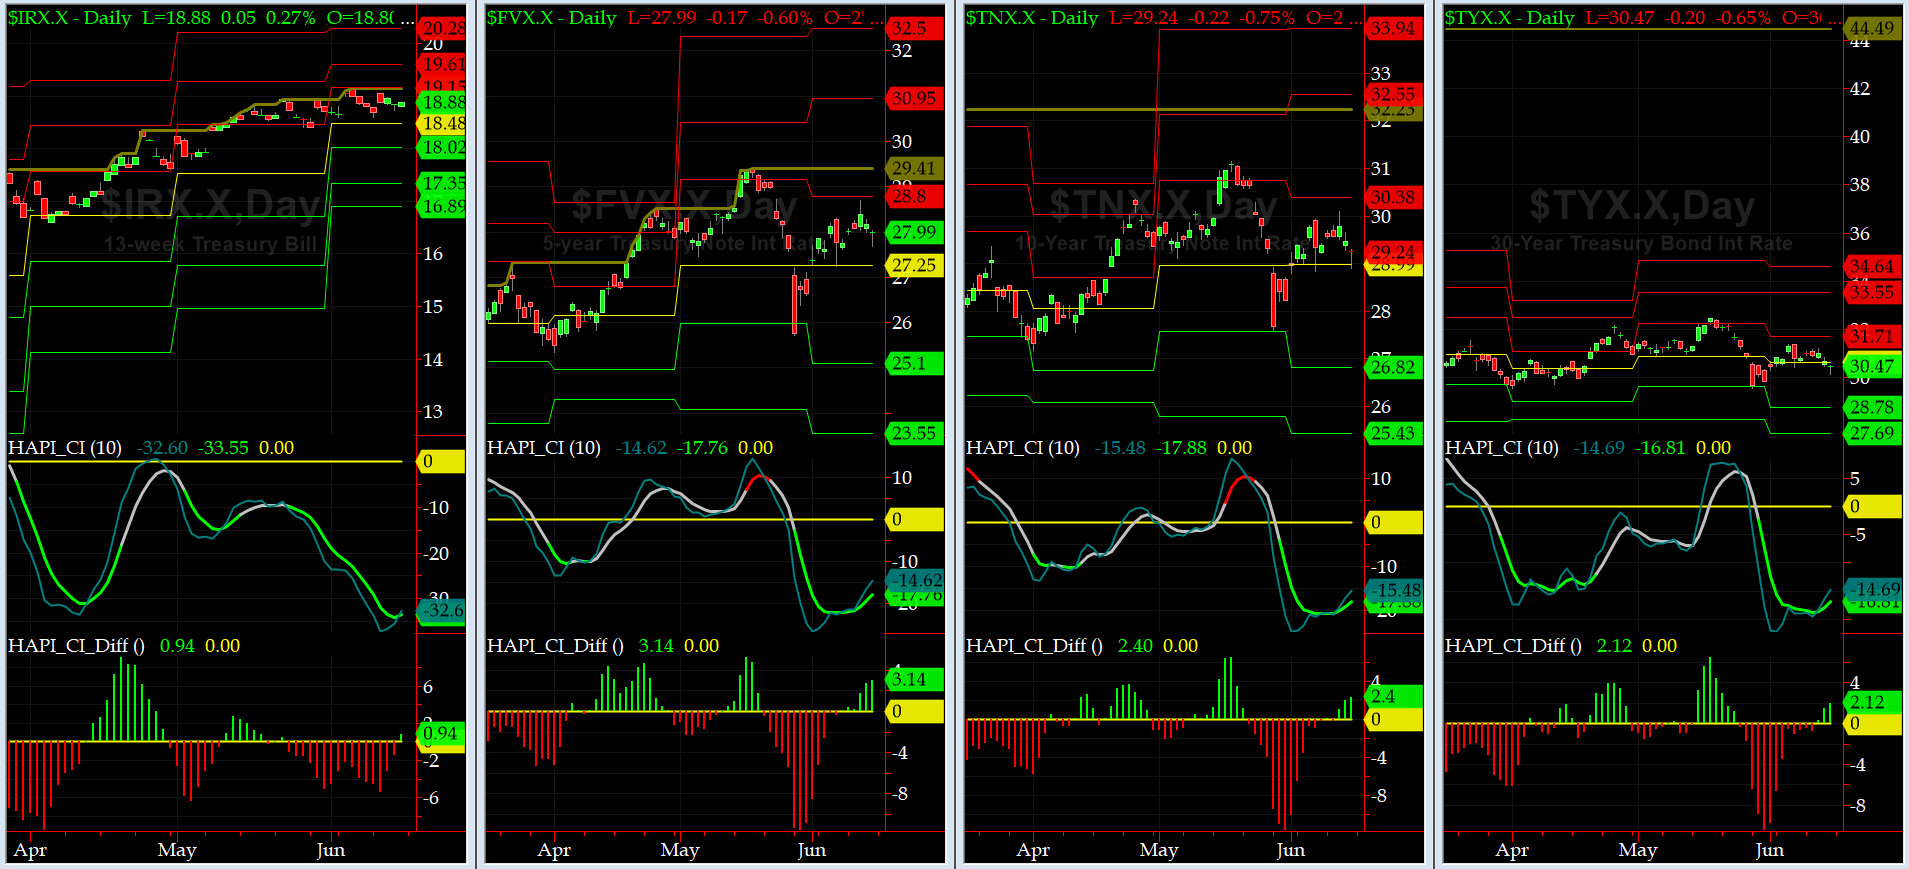
US Treasury T-Notes & T-Bonds Yields Chart
This past week, again the Notes & Bonds went nowhere fast but during post-FOMC Meeting, on Wednesdy, the Treasury Complex put their respective monthly high. The Maurys are not shopping for now. Their Vig is still under pressure.
Fari Hamzei
|
|
|
|
|
|
Customer Care:
|
|
|
|
|
|
|
 |
 |
|
 |
|
 |
 |
 |
HA YouTube Channel ::: HA Blog ::: Testimonials ::: Tutorials & FAQs ::: Privacy Policy
|
Trading Derivatives (Options & Futures) contains substantial risk and is not for every investor. An investor could potentially lose all or more than his/her initial investment.
Only risk capital should be used for trading and only those with sufficient risk capital should consider trading derivatives. Past performance is not
necessarily indicative of future results. Testimonials appearing on this website may not be representative of other clients or customers
and are not a guarantee of future performance or success.
|
| (c) 1998-2025, Hamzei Analytics, LLC.® All Rights Reserved. |
|
|