|
Sunday, June 24, 2018, 1830ET
Market Timing Charts, Analysis & Commentary for Issue #246
Timer Charts of S&P-500 Cash Index (SPX) + NASDAQ-100 Cash Index (NDX)
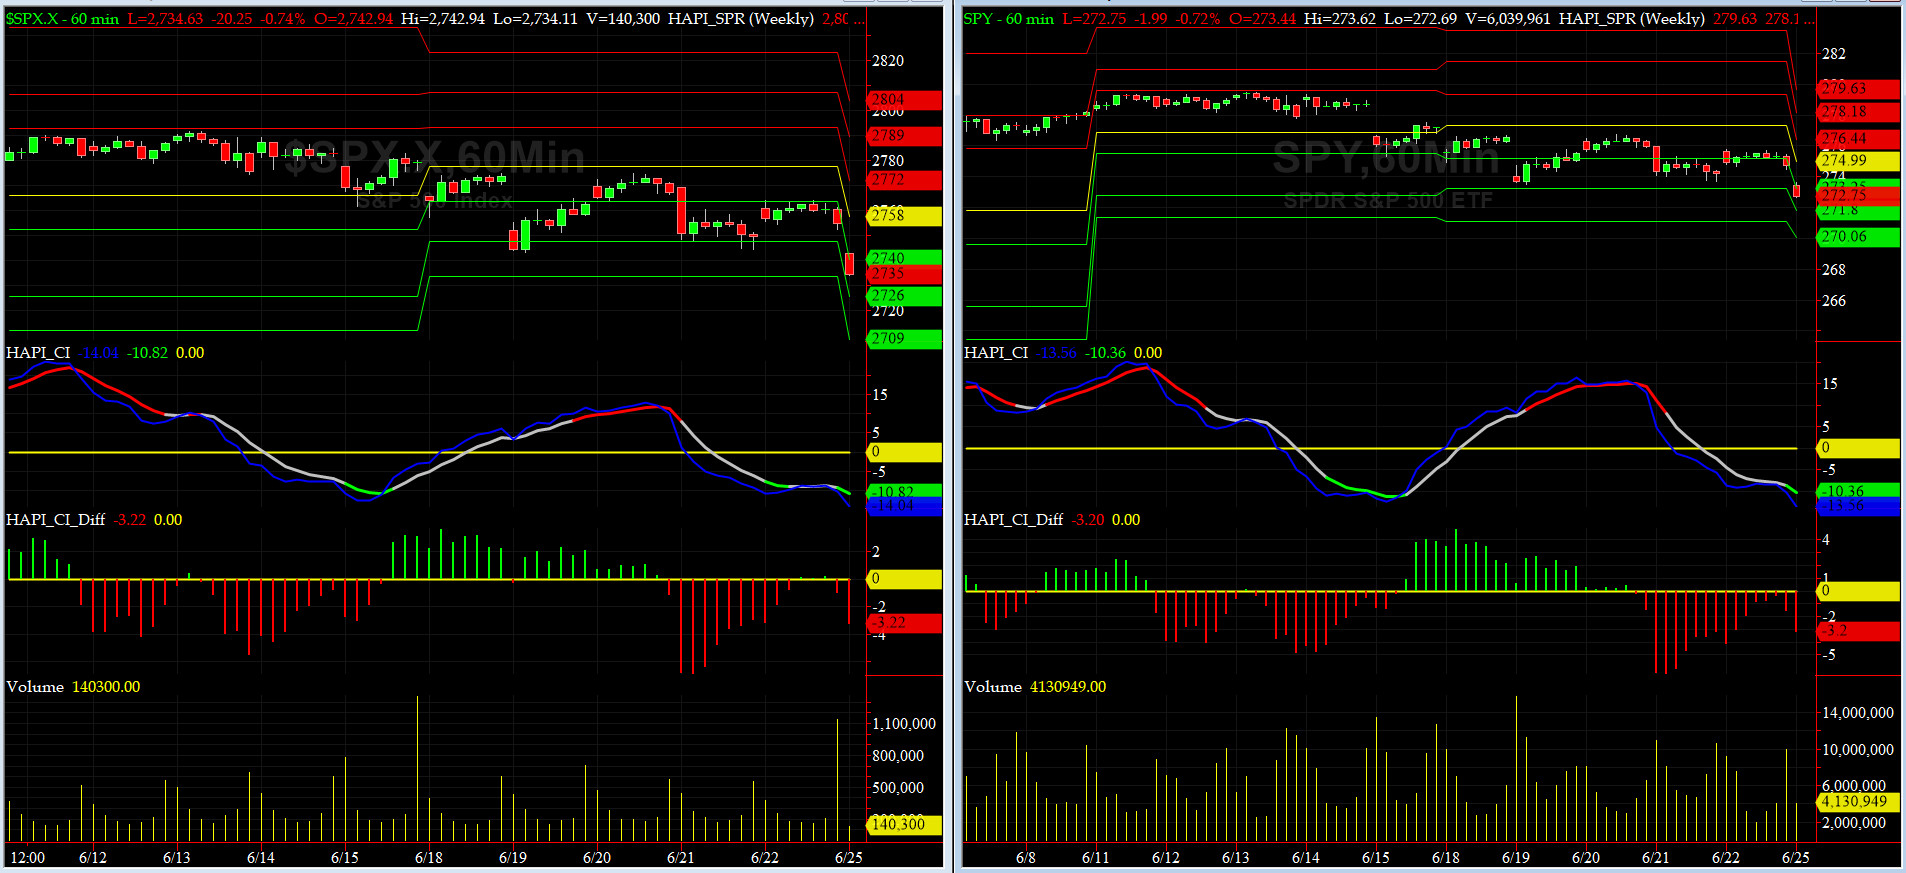
Most recent S&P-500 Cash Index (SPX): 2755 down -24 (down -0.86%) for the week ending on Friday, June 22, 2018, which closed about its zero sigma.
DJIA ALL TIME INTRADAY HIGH = 26617 (reached on Friday, January 26, 2018)
TRAN ALL TIME INTRADAY HIGH = 11424 (reached on Tuesday, January 16, 2018)
SPX ALL TIME INTRADAY HIGH = 2873 (reached on Friday, January 26, 2018)
NDX ALL TIME INTRADAY HIGH = 7310 (reached on Wednesday, June 20, 2018)
RUT ALL TIME INTRADAY HIGH = 1708 (reached on Wednesday, June 20, 2018)
Current DAILY +2 Sigma SPX = 2809 with WEEKLY +2 Sigma = 2818
Current DAILY 0 Sigma (20 day MA) SPX = 2755 with WEEKLY 0 Sigma = 2702
Current DAILY -2 Sigma SPX = 2701 with WEEKLY -2 Sigma = 2585
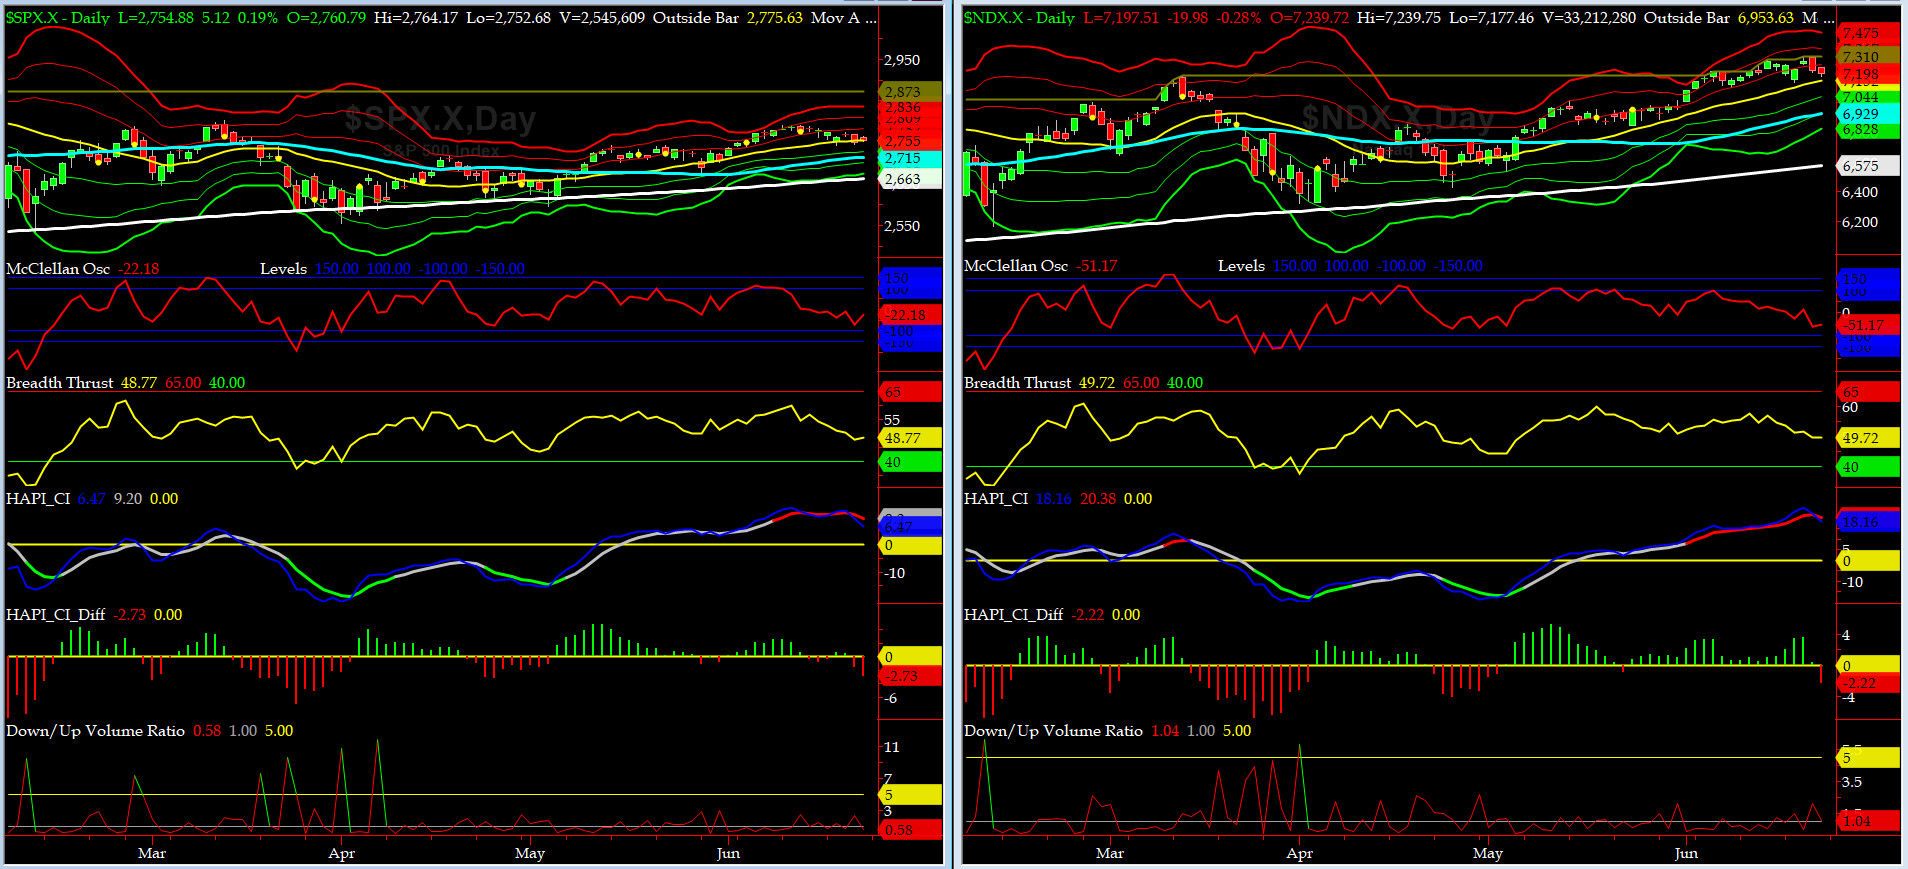
NYSE McClellan Oscillator = -22 (-150 is start of the O/S area; around -275 to -300 area or lower, we go into the �launch-pad� mode, over +150, we are in O/B area)
NYSE Breadth Thrust = 48.8 (40 is considered as oversold and 65 as overbought)
This past week we saw one good directional day (Thursday) but rest was just more intraday volatility. The [bearish] divergences we talked about last week started to have a minor impact (DJIA broke its 9 days in a row of negative closes on Friday).
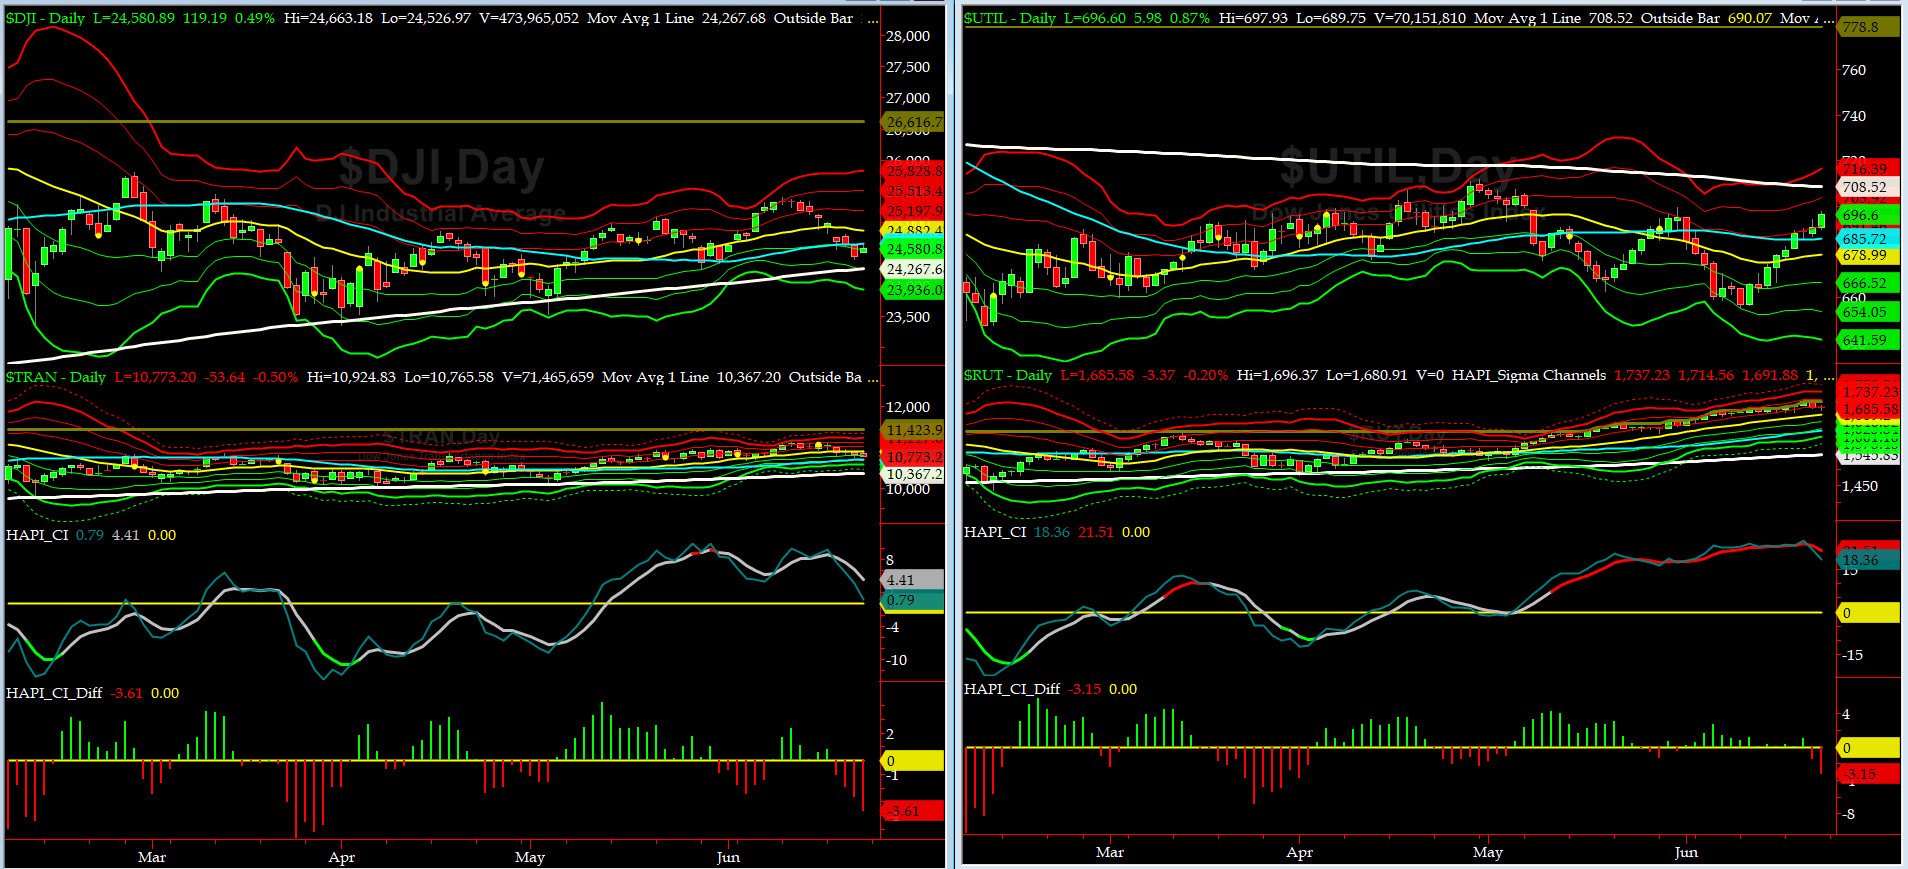
Canaries [in the Coal Mine] Chart for DJ TRAN & RUT Indices
200-Day MA DJ TRAN = 10,367 or 3.9% below DJ TRAN (max observed in last 7 yrs = 20.2%, min = -20.3%)
200-Day MA RUT = 1545 or 9% below RUT (max observed in last 7 yrs = 21.3%, min = -22.6%)
DJ Transportation Index (proxy for economic conditions 6 to 9 months hence) sold 4 out of 5 trading days of last week.
Russell 2000 Small Caps Index (proxy for Risk ON/OFF) after putting another new high on Wednesday, sold hard on Thursday and retreated a tad on Friday (ahead of its annual reblancing). RISK is still ON.
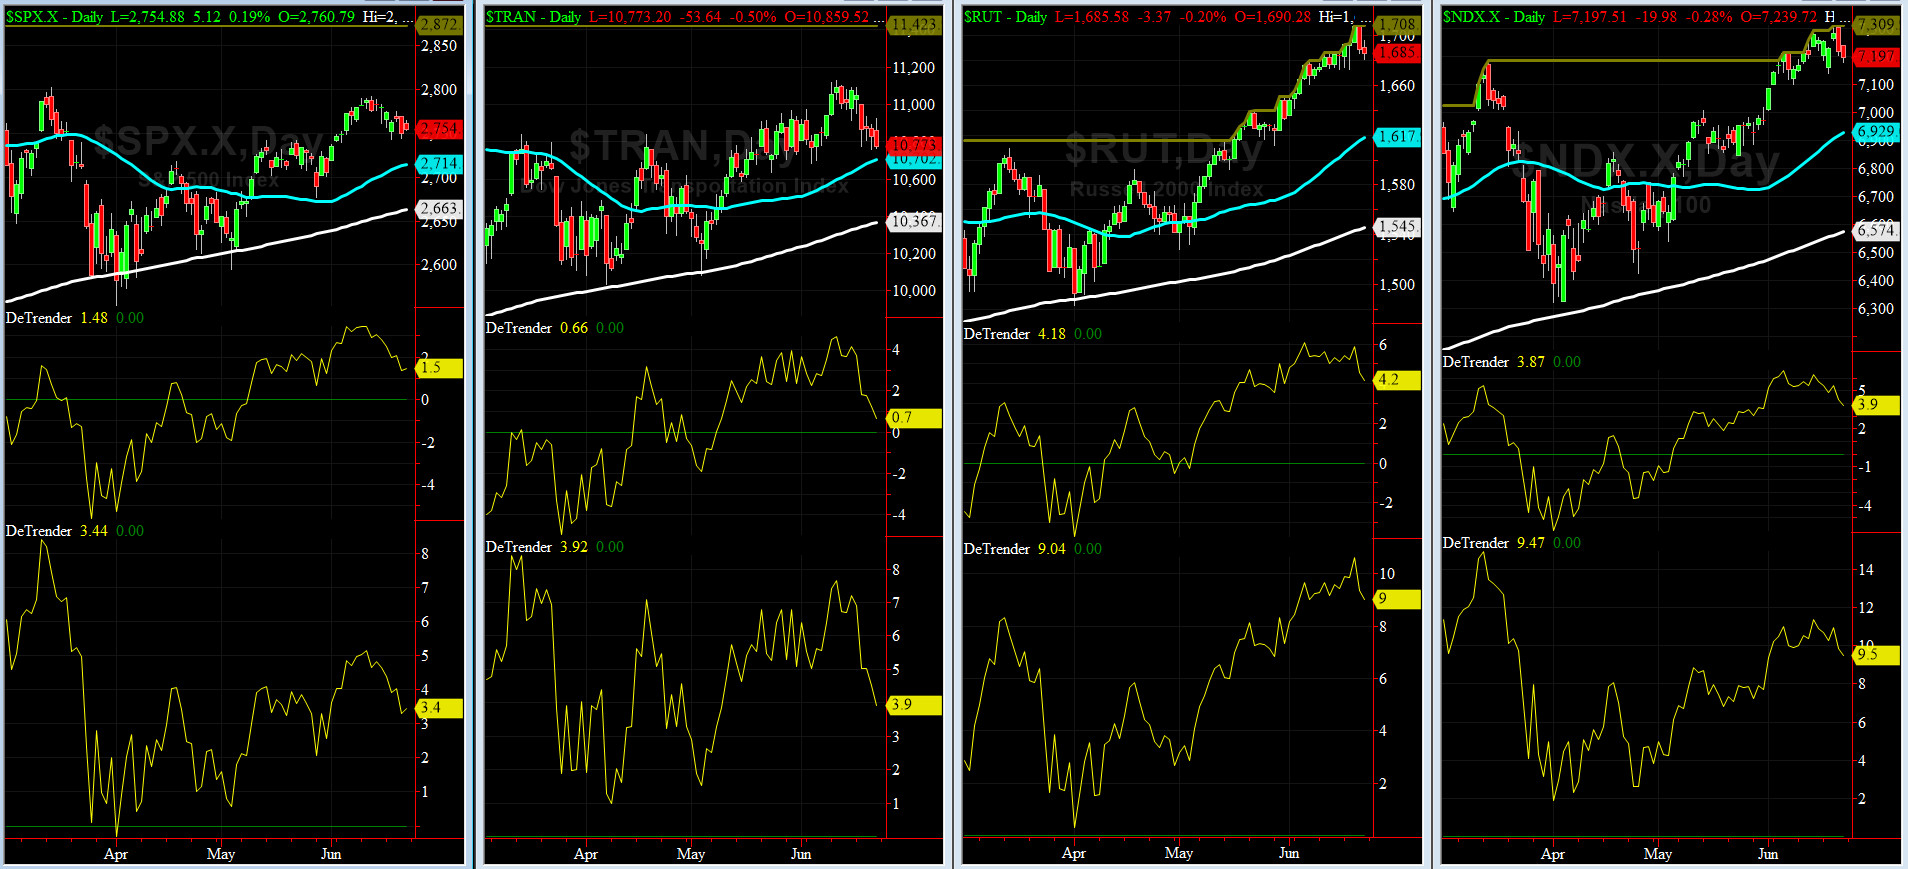
DeTrenders Charts for SPX, NDX, TRAN & RUT Indices
50-Day MA SPX = 2714 or 1.5% below SPX (max observed in last 7 yrs = +8.6%, min = -9.3%)
200-Day MA SPX = 2663 or 3.4% below SPX (max observed in last 7 yrs = 15.2%, min = -14%)
All EIGHT of our DeTrenders remain in POSITIVE territory. The DeTrenders for DJ Tran & RUT will continue to be harbingers of future price behavior in broad indices.
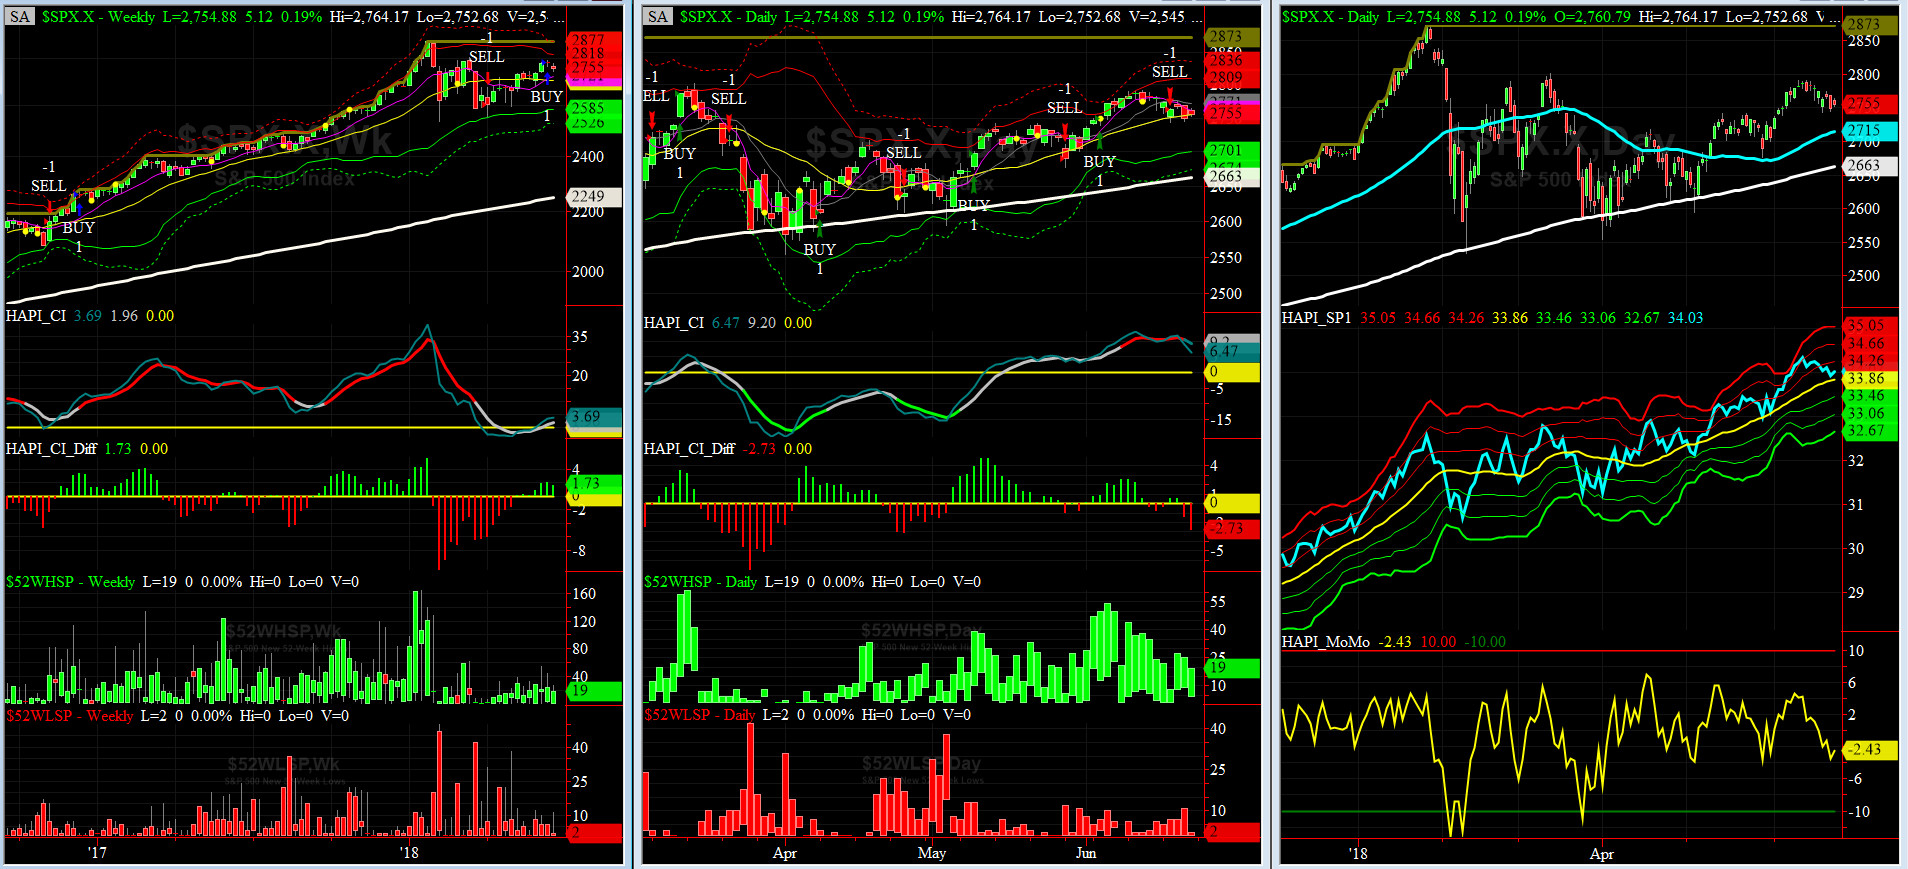
HA_SP1_Momo Chart
WEEKLY Timing Model = on a BUY Signal since Friday, June 15, 2018 CLOSE at 2779
DAILY Timing Model = on a SELL Signal since Tuesday, June 19, 2018 CLOSE at 2763
Max SPX 52wk-highs reading last week = 27 (over 120-140, the local maxima is in)
Max SPX 52wk-Lows reading last week = 11 (over 40-60, the local minima is in)
HA_SP1 closed near its zero sigma channels
HA_Momo = -2.43 (reversals most likely occur above +10 or below -10)
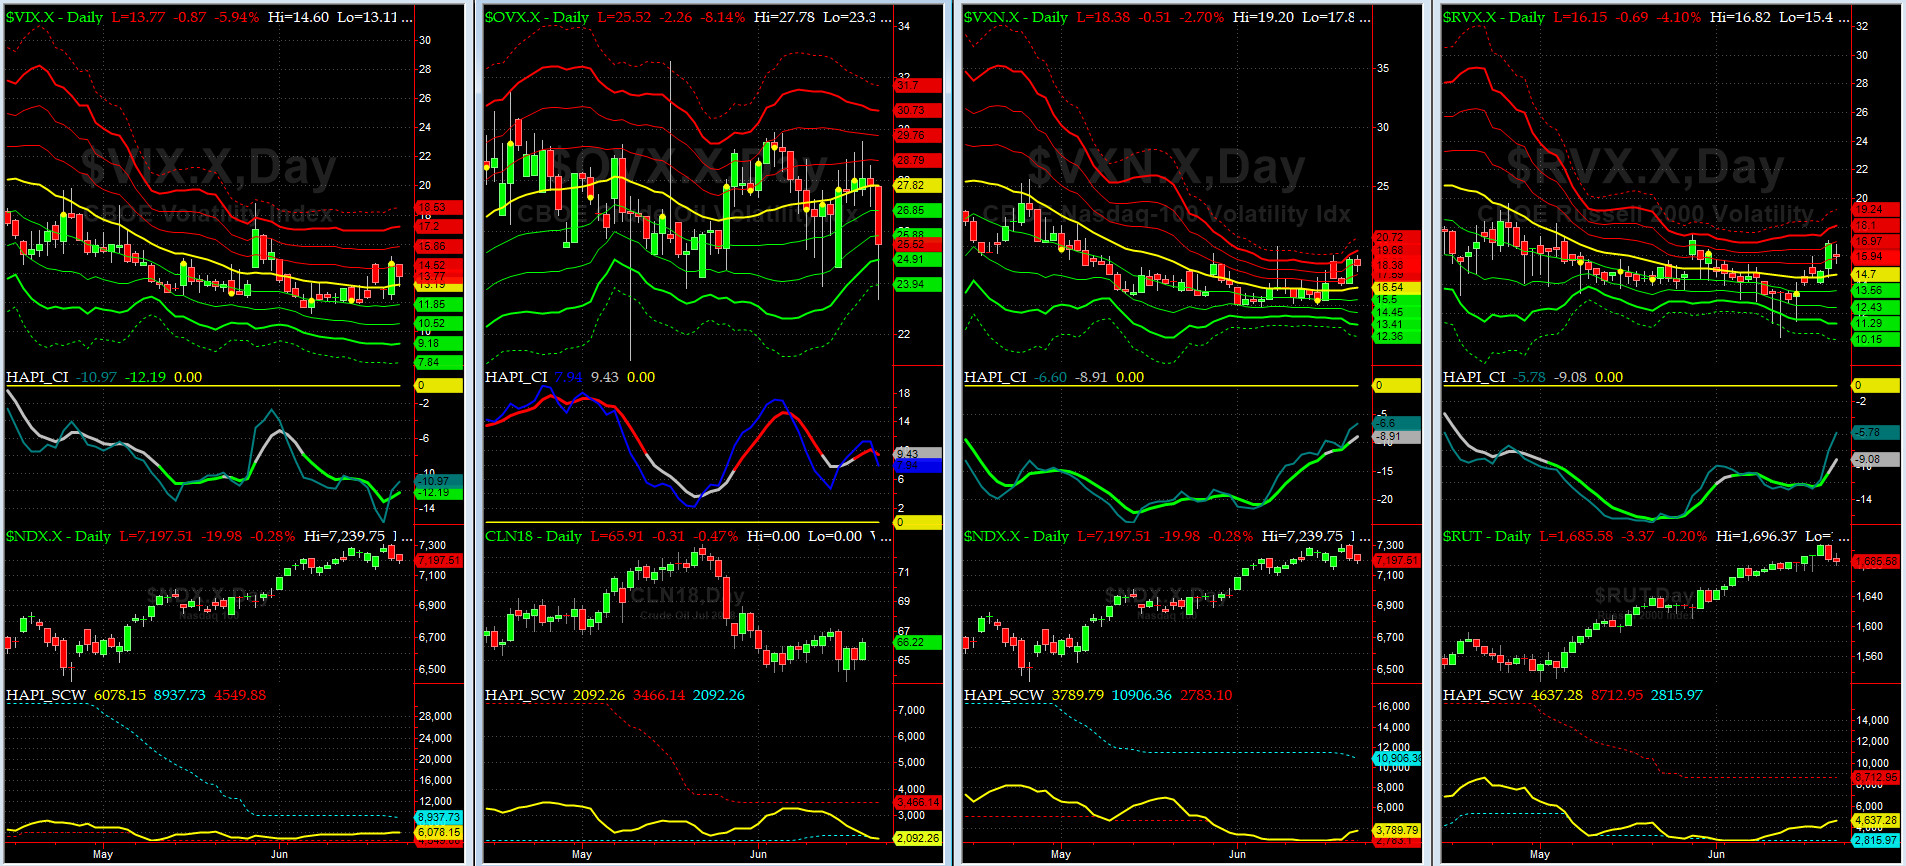
Vol of the Vols Chart
VIX currently stands at 13.77, just above its -1 sigma (remember it's the VIX volatility pattern aka "its sigma channels" that matters, and not the level of VIX itself (this is per Dr. Robert Whaley, a great mentor and inventor of original VIX, now called VXO). VIX usually peaks around a test of its +4 sigma).
Trading in VIX [derivatives] was a tad better than last week (dead money). The big move was in Crude Vol ($OVX).
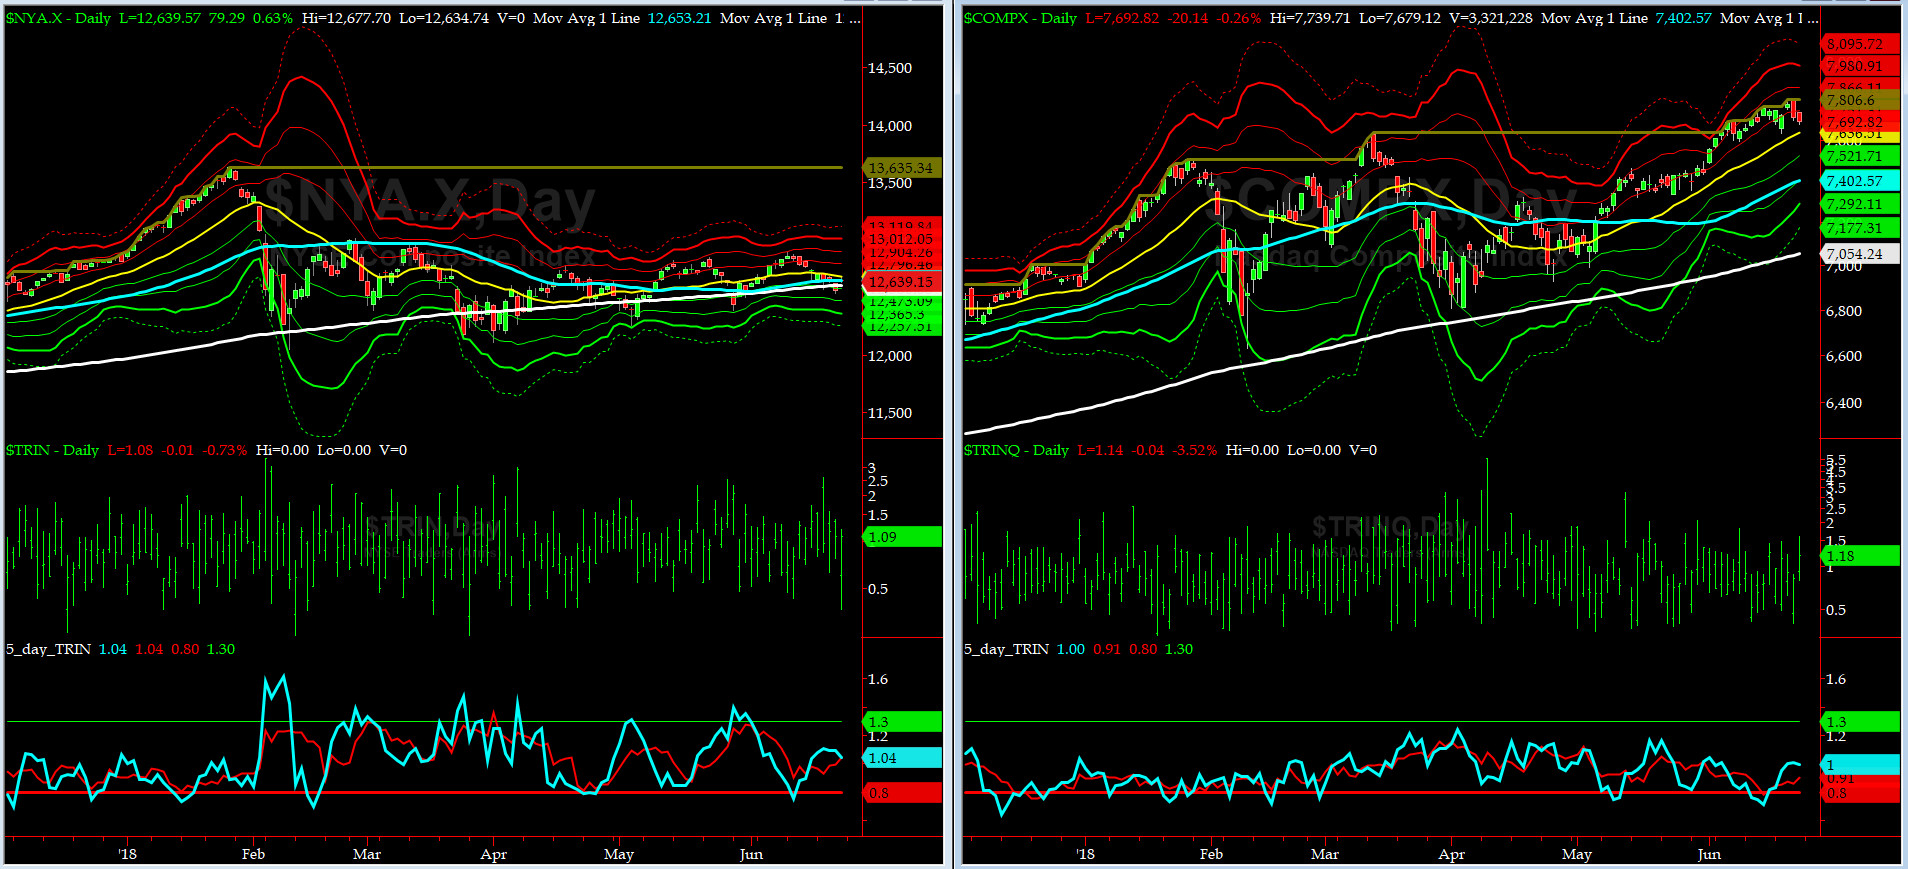
5-day TRIN & TRINQ Charts
Both NYSE & NASDAQ 5-day TRINs are in NEUTRAL zone.
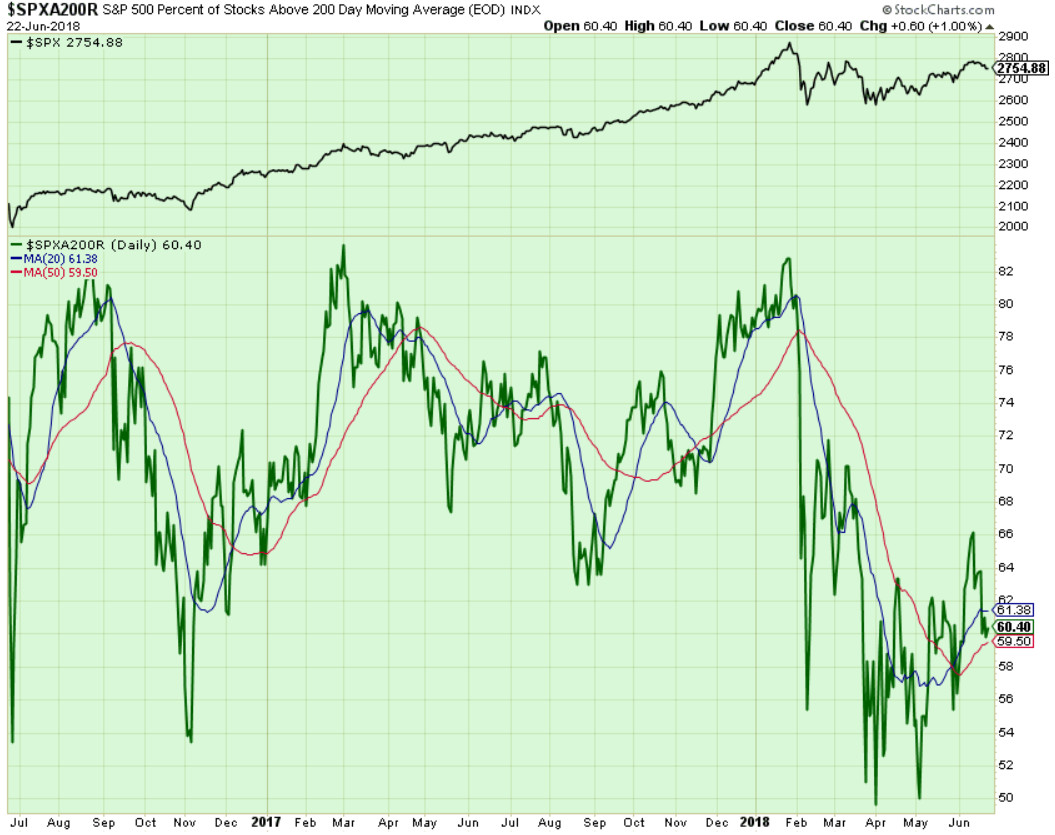
Components of SPX above their respective 200day MA Chart
This scoring indicator dropped further and closed at 60% level. Its next target will be in 55% on the downside or 66% on the upside. This could be a good tell this week.
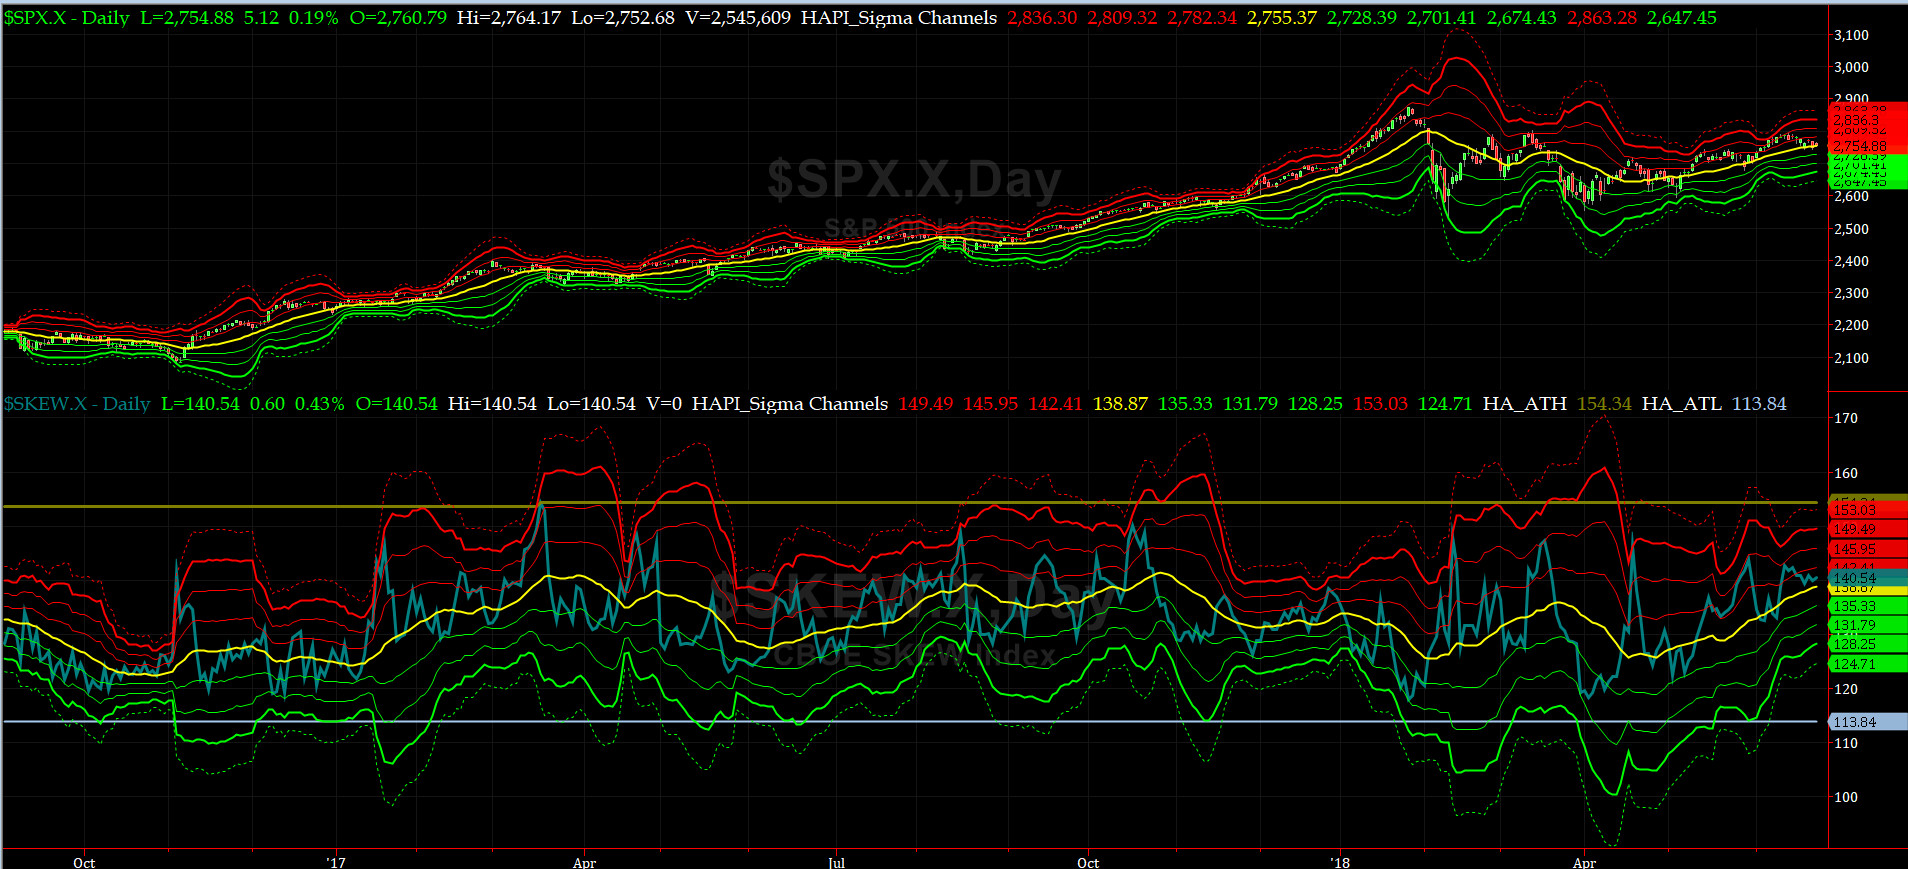
SPX SKEW (Tail Risk) Chart
On Friday, SPX SKEW (Tail Risk) closed near 140.5, right about its +1 sigma (normal = 120-125, range 100-150).
Is all quiet on the Eastern & Mid-Western Fronts? Again, YES for now.
How to interpret the value of SPX SKEW? (from CBOE white paper on SKEW)


3-month VIX Futures Spread(VX) Chart
This popular timing indicator, (long July, & short Oct VIX Futures) is at -1.55. The signal here remains NEUTRAL.
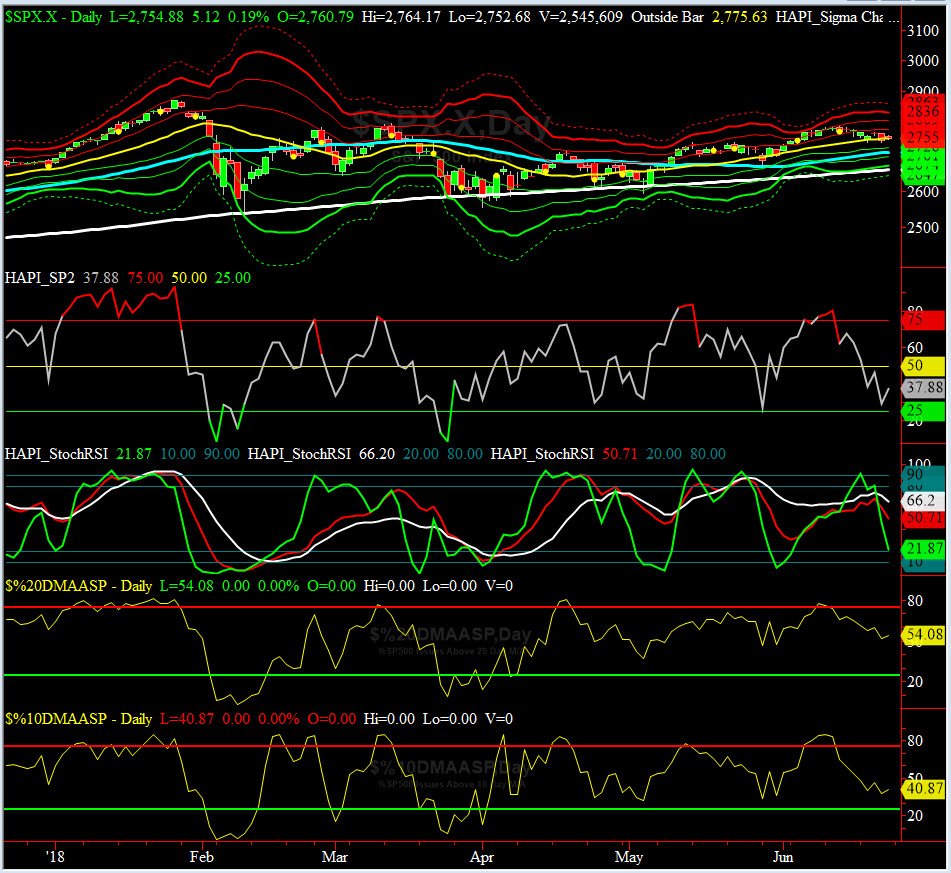
HA_SP2 Chart
HA_SP2 = 37.9 (Buy signal <= 25, Sell Signal >= 75)
This coveted prop indicator went down to 29.6 on Thursday and went back up to 37.9 on Friday. It is still near the oversold zone. We need to watch this carefully this week.
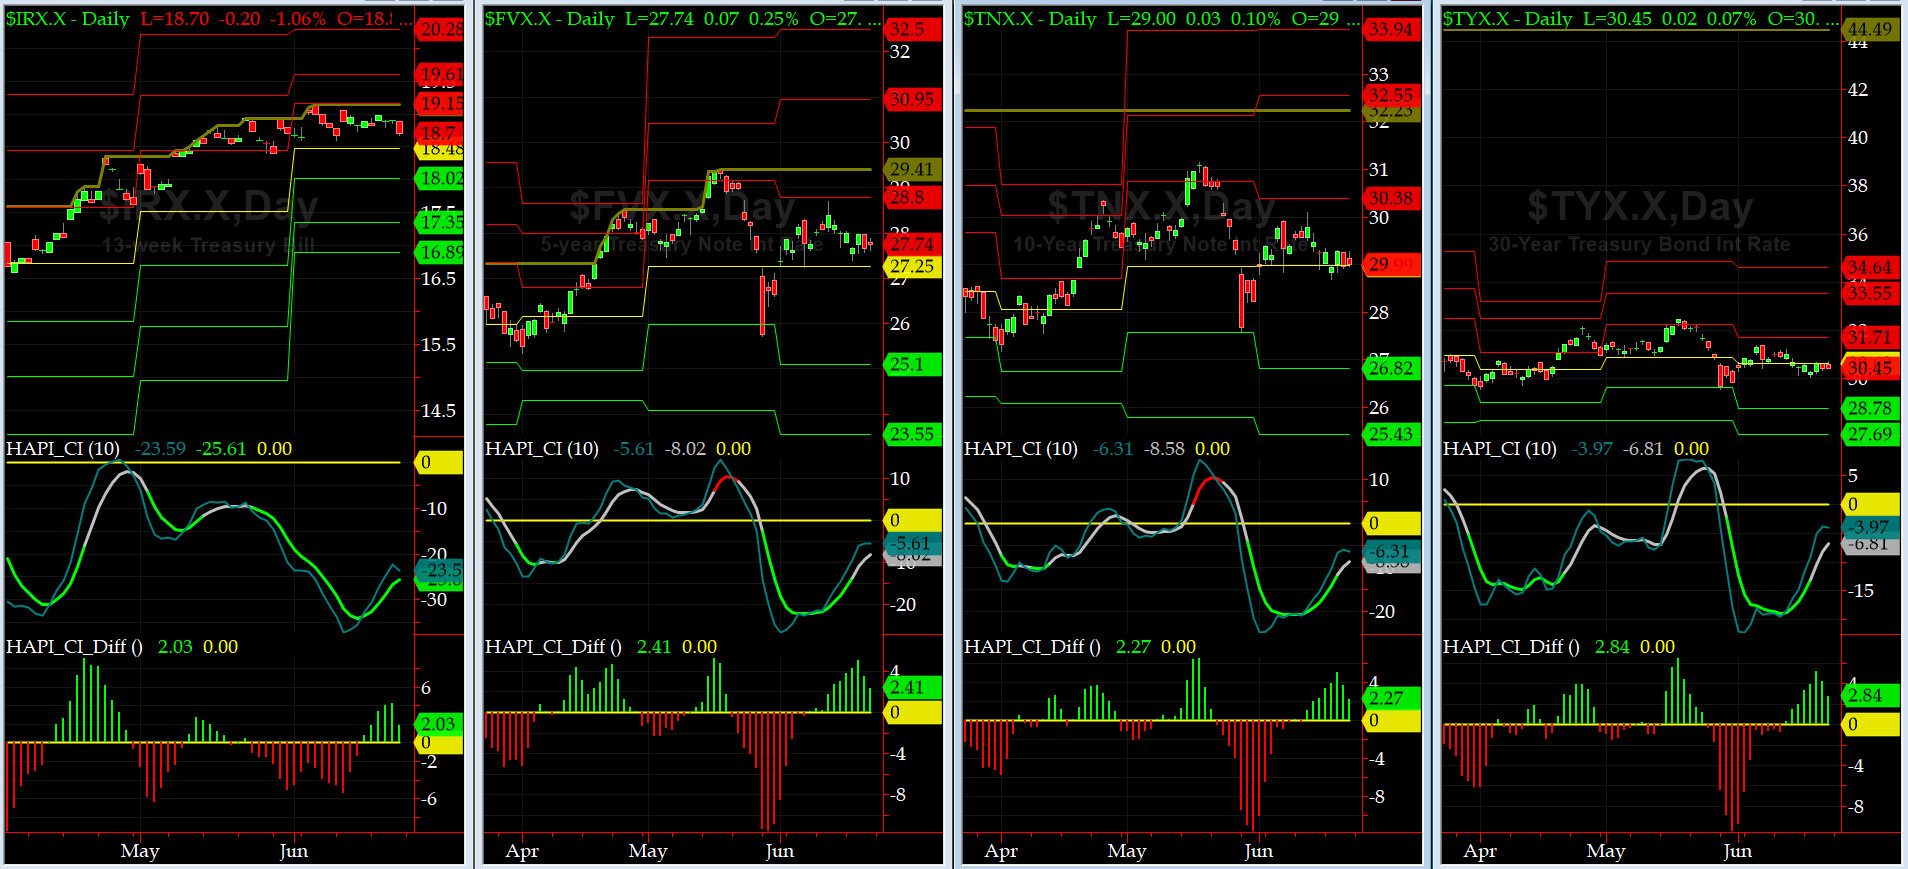
US Treasury T-Notes & T-Bonds Yields Chart
This past week, again the Notes & Bonds went nowhere fast. Maury & Co. are getting worried about their Implied Vig.
Fari Hamzei
|


 Proactive Market Timing