|
Sunday, July 1st, 2018, 1400ET
Market Timing Charts, Analysis & Commentary for Issue #247
Timer Charts of S&P-500 Cash Index (SPX) + NASDAQ-100 Cash Index (NDX)
Most recent S&P-500 Cash Index (SPX): 2718 down -37 (down -1.3%) for the week ending on Friday, June 29, 2018, which closed about its -1.5 sigma.
DJIA ALL TIME INTRADAY HIGH = 26617 (reached on Friday, January 26, 2018)
TRAN ALL TIME INTRADAY HIGH = 11424 (reached on Tuesday, January 16, 2018)
SPX ALL TIME INTRADAY HIGH = 2873 (reached on Friday, January 26, 2018)
NDX ALL TIME INTRADAY HIGH = 7310 (reached on Wednesday, June 20, 2018)
RUT ALL TIME INTRADAY HIGH = 1708 (reached on Wednesday, June 20, 2018)
Current DAILY +2 Sigma SPX = 2808 with WEEKLY +2 Sigma = 2817
Current DAILY 0 Sigma (20 day MA) SPX = 2755 with WEEKLY 0 Sigma = 2707
Current DAILY -2 Sigma SPX = 2703 with WEEKLY -2 Sigma = 2596
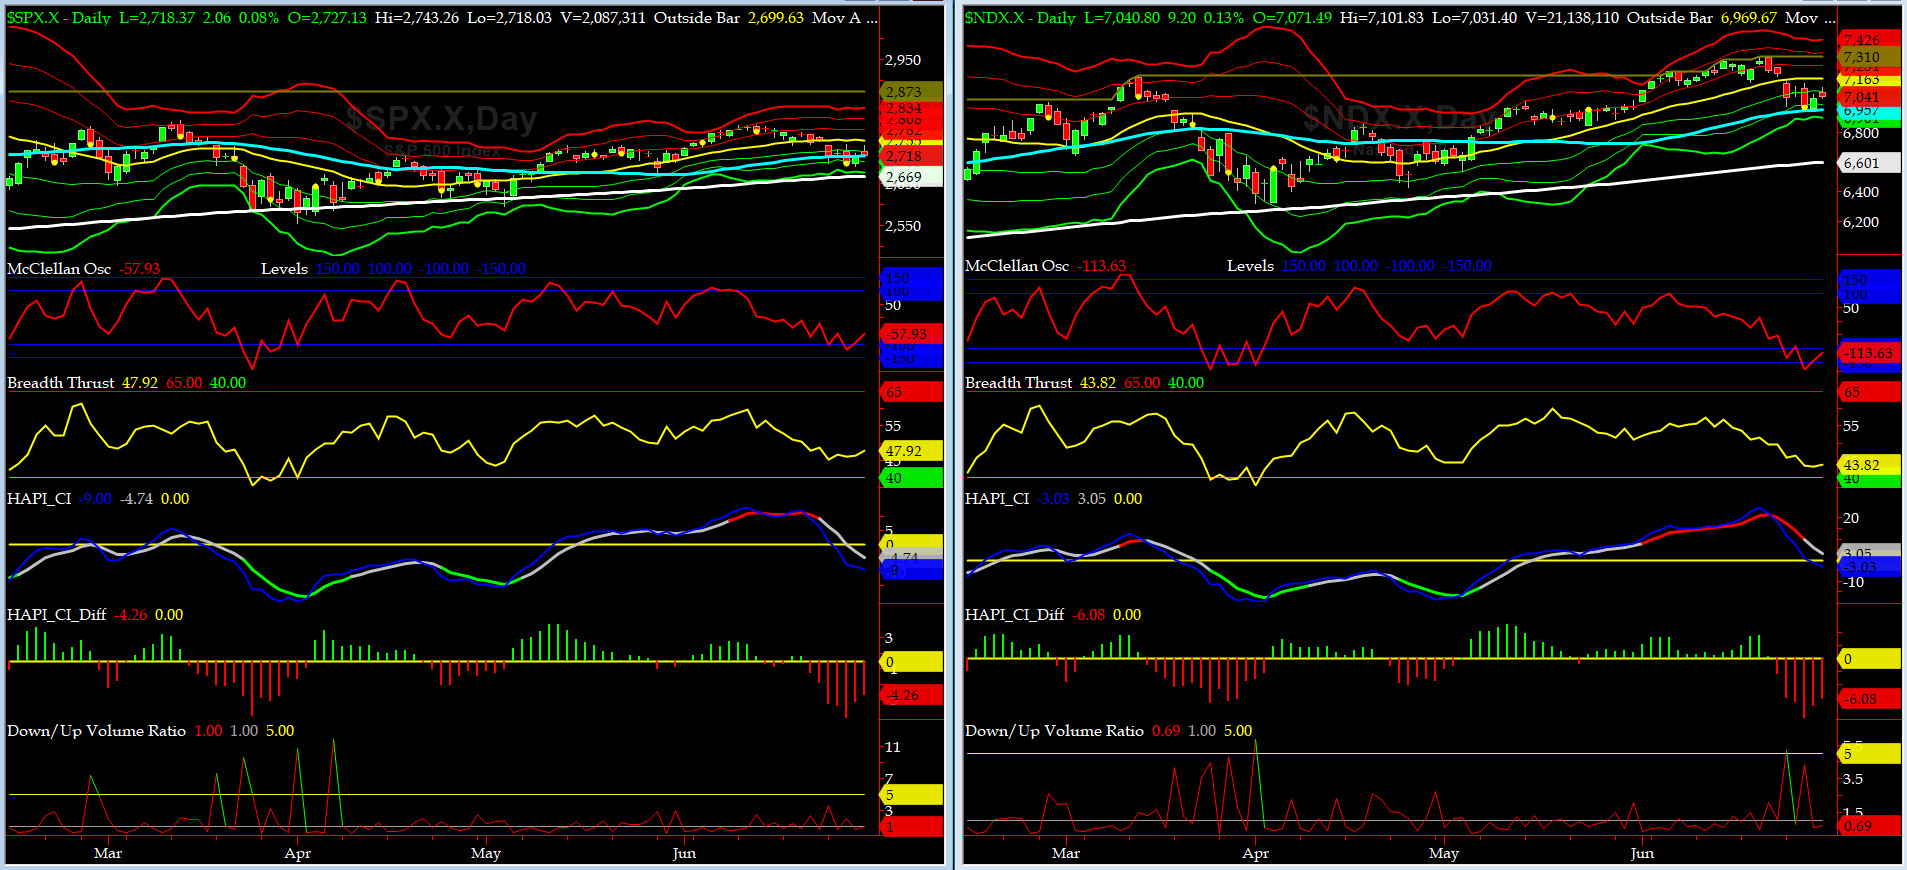
NYSE McClellan Oscillator = -58 (-150 is start of the O/S area; around -275 to -300 area or lower, we go into the �launch-pad� mode, over +150, we are in O/B area)
NYSE Breadth Thrust = 47.9 (40 is considered as oversold and 65 as overbought)
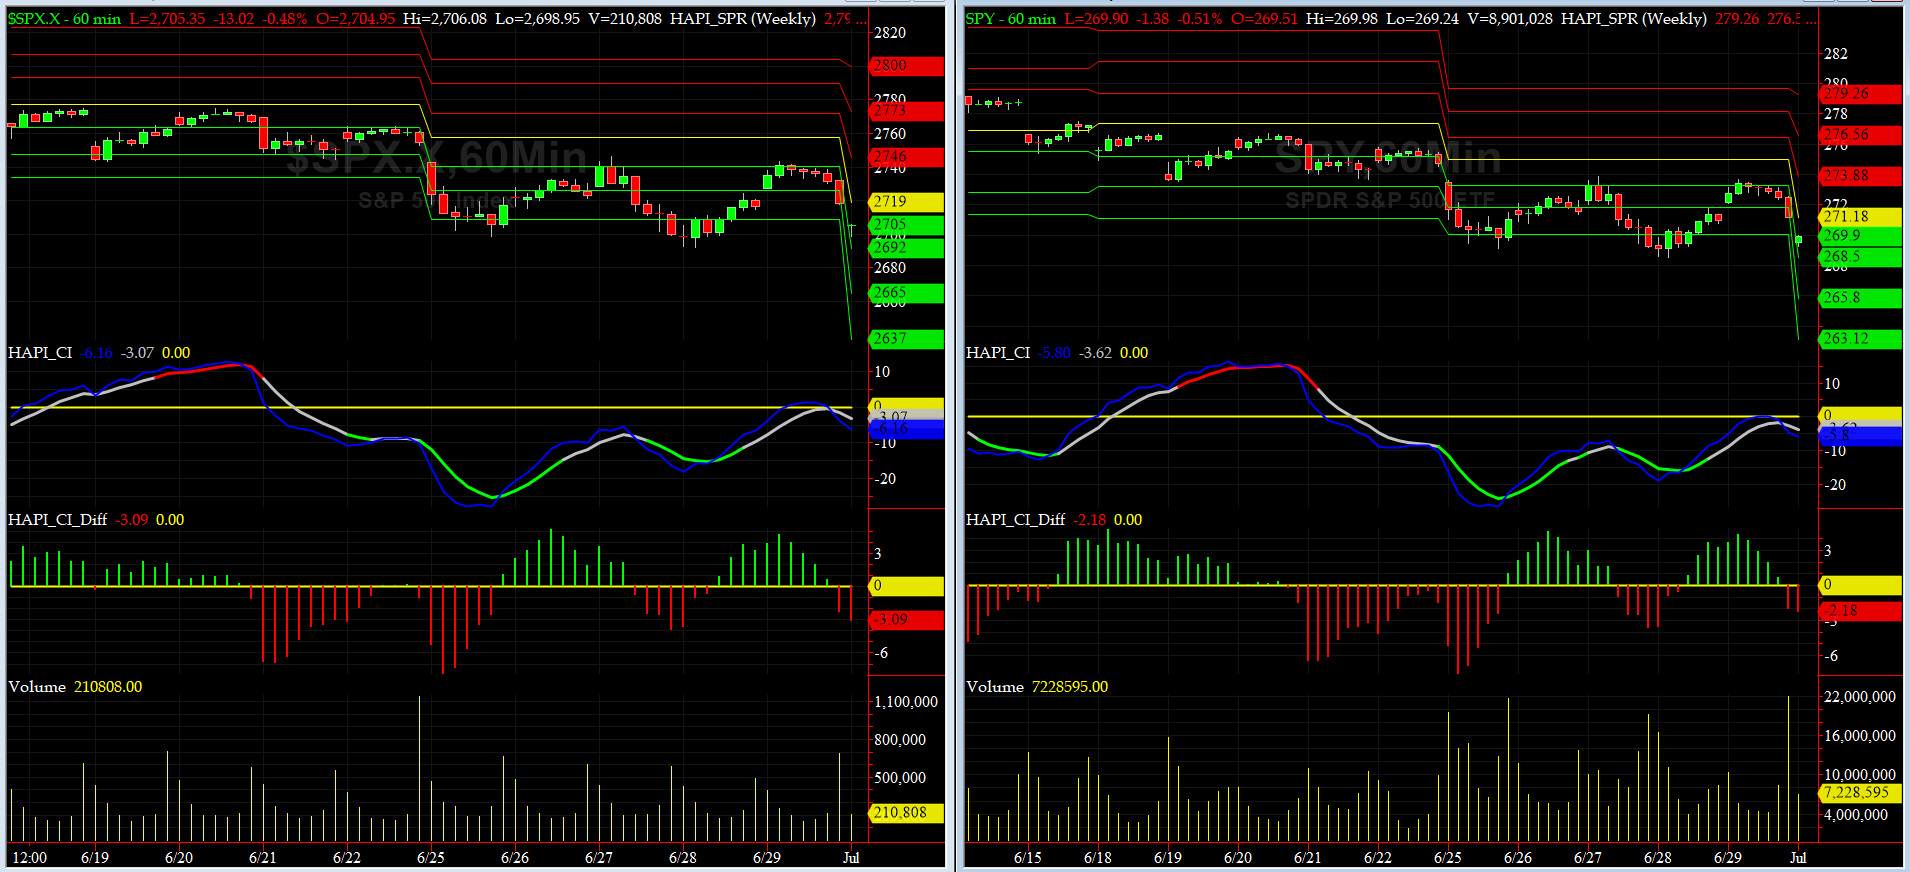
This past week we had two great down days (while we were short), Monday and Wednesday. Capt Tiko's SPX target was 2700 - SPX Close on Wednesday came in at 2699.63..... thank you for overwhelming emails and tweets. We may have to promote him to Fleet Commander sooner than we had planned to.

Canaries [in the Coal Mine] Chart for DJ TRAN & RUT Indices
200-Day MA DJ TRAN = 10,390 or 0.4% ABOVE DJ TRAN (max observed in last 7 yrs = 20.2%, min = -20.3%)
200-Day MA RUT = 1551 or 5.9% below RUT (max observed in last 7 yrs = 21.3%, min = -22.6%)
DJ Transportation Index (proxy for economic conditions 6 to 9 months hence) sold 4 out of 5 trading days of last week.
Russell 2000 Small Caps Index (proxy for Risk ON/OFF) also dropped fairly hard 2 days last week and retested its 50-day MA. RISK is still ON.
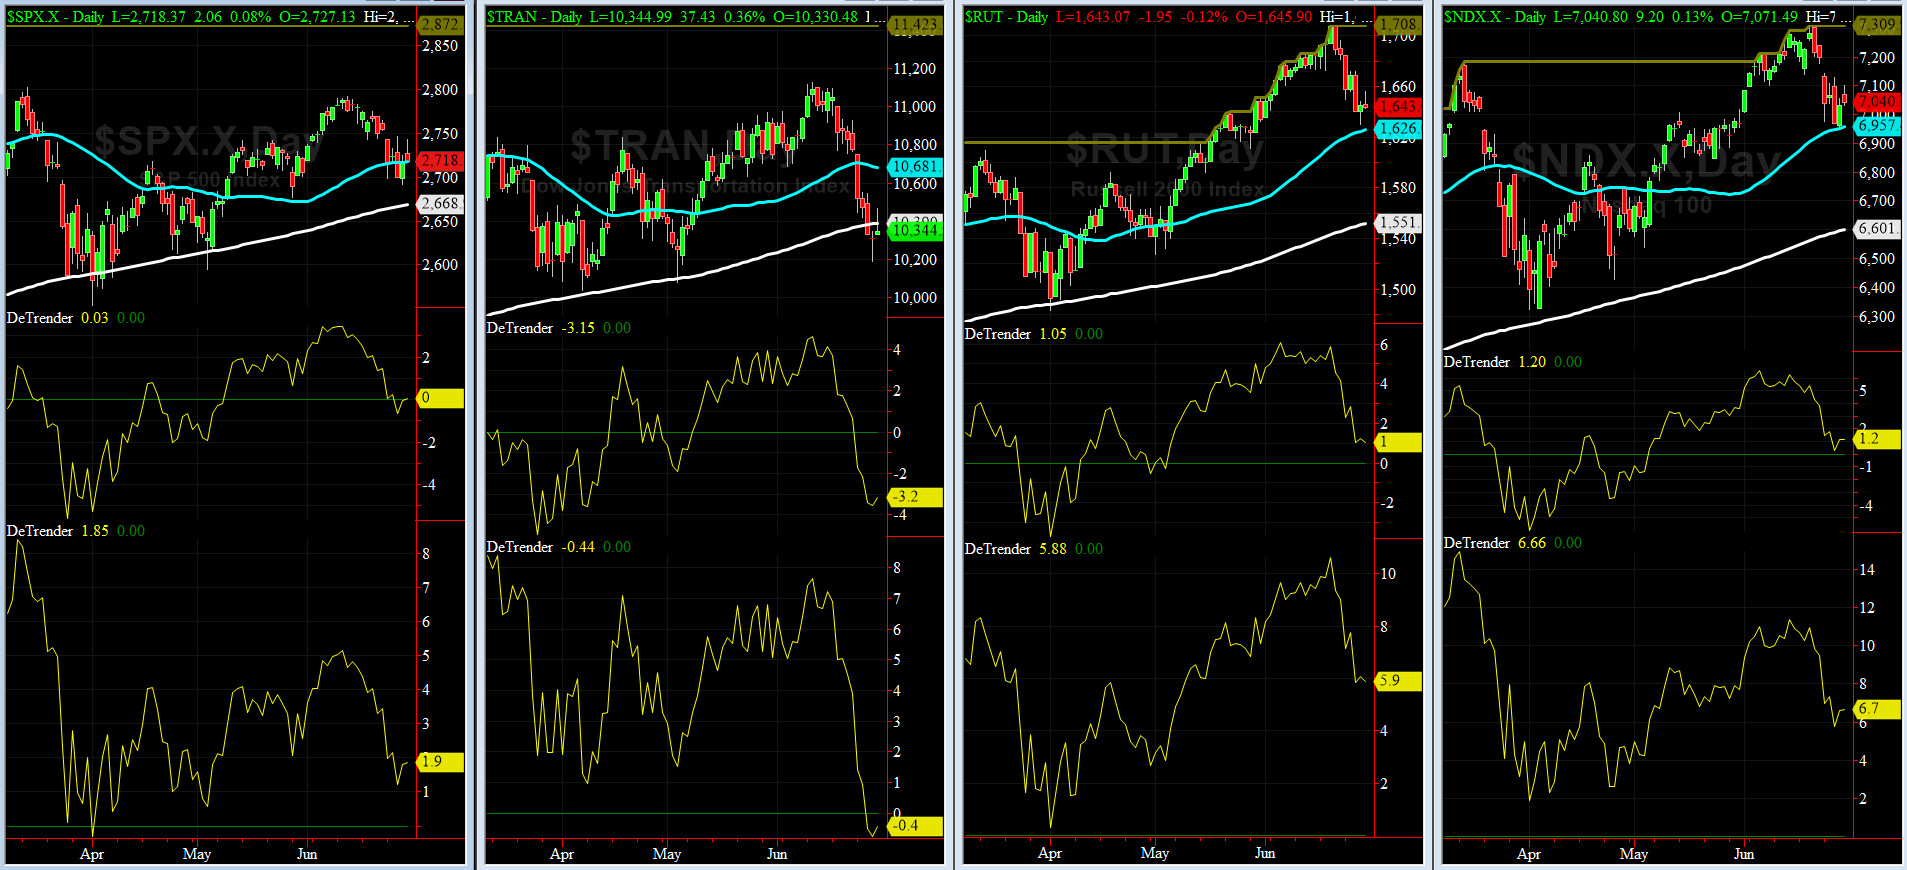
DeTrenders Charts for SPX, NDX, TRAN & RUT Indices
50-Day MA SPX = 2718 or 0% below SPX (max observed in last 7 yrs = +8.6%, min = -9.3%)
200-Day MA SPX = 2668 or 1.9% below SPX (max observed in last 7 yrs = 15.2%, min = -14%)
Only FIVE of our EIGHT DeTrenders remain in POSITIVE territory. The DeTrenders for DJ Tran & RUT will continue to be harbingers of future price behavior in broad indices.
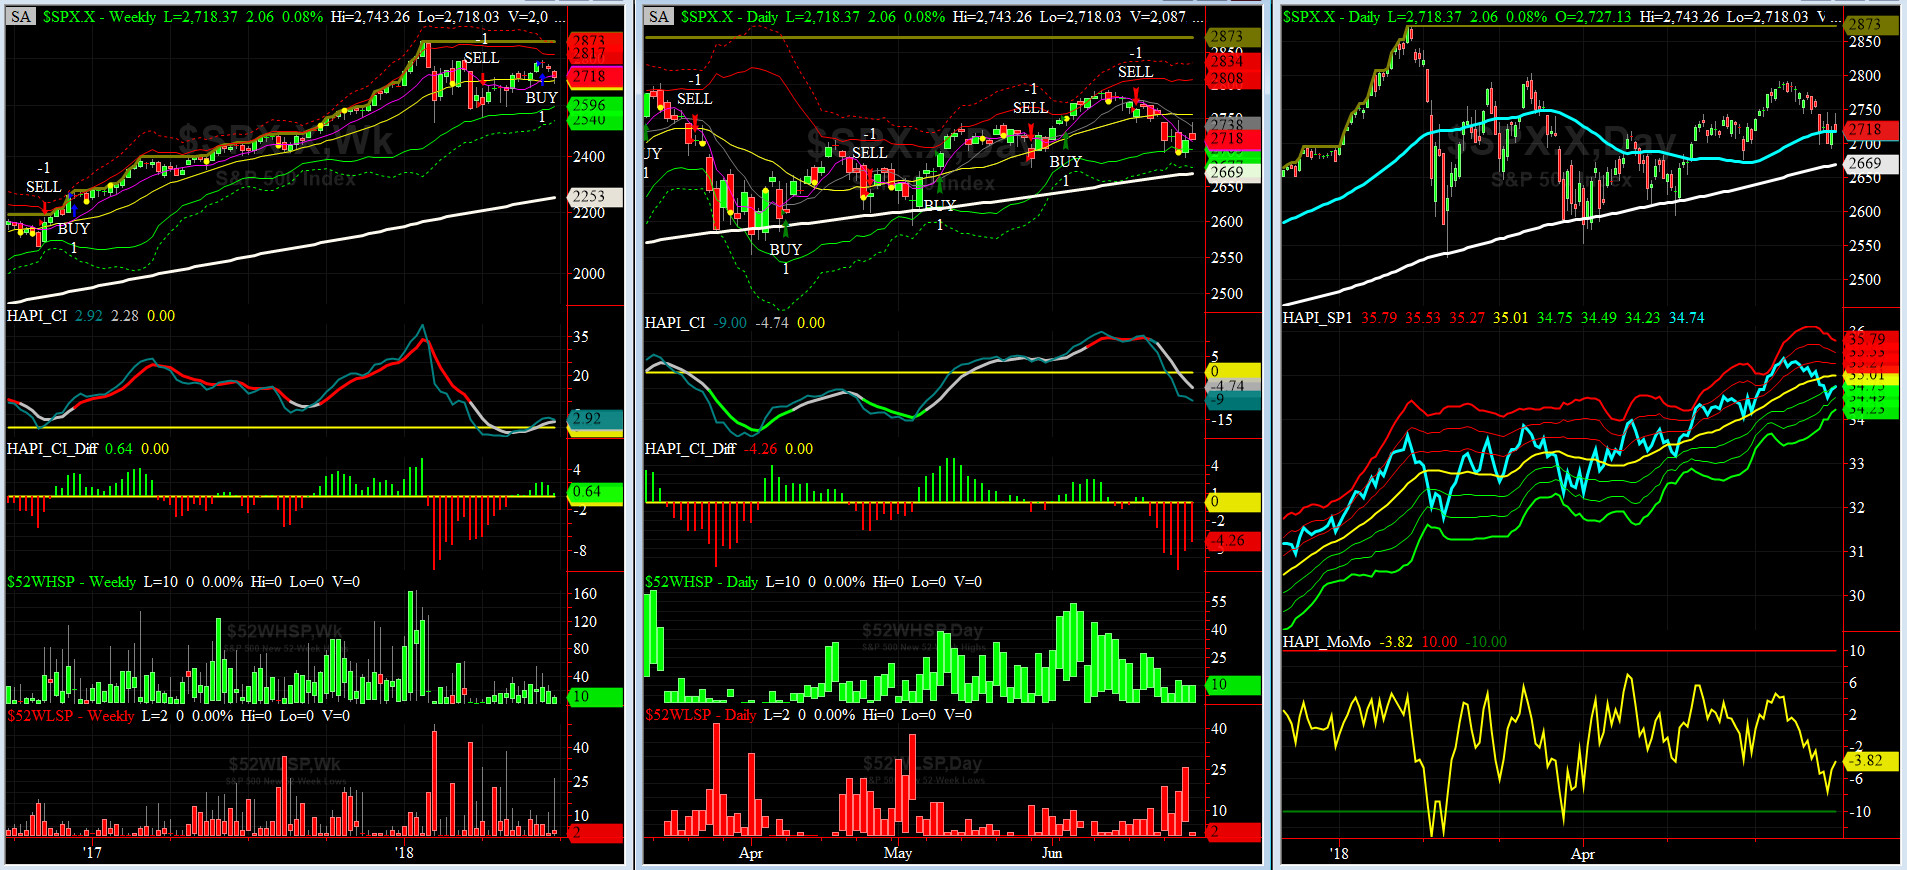
HA_SP1_Momo Chart
WEEKLY Timing Model = on a BUY Signal since Friday, June 15, 2018 CLOSE at 2779
DAILY Timing Model = on a SELL Signal since Tuesday, June 19, 2018 CLOSE at 2763
Max SPX 52wk-highs reading last week = 13 (over 120-140, the local maxima is in)
Max SPX 52wk-Lows reading last week = 26 (over 40-60, the local minima is in)
HA_SP1 closed near its -1 sigma channels
HA_Momo = -3.82 (reversals most likely occur above +10 or below -10)
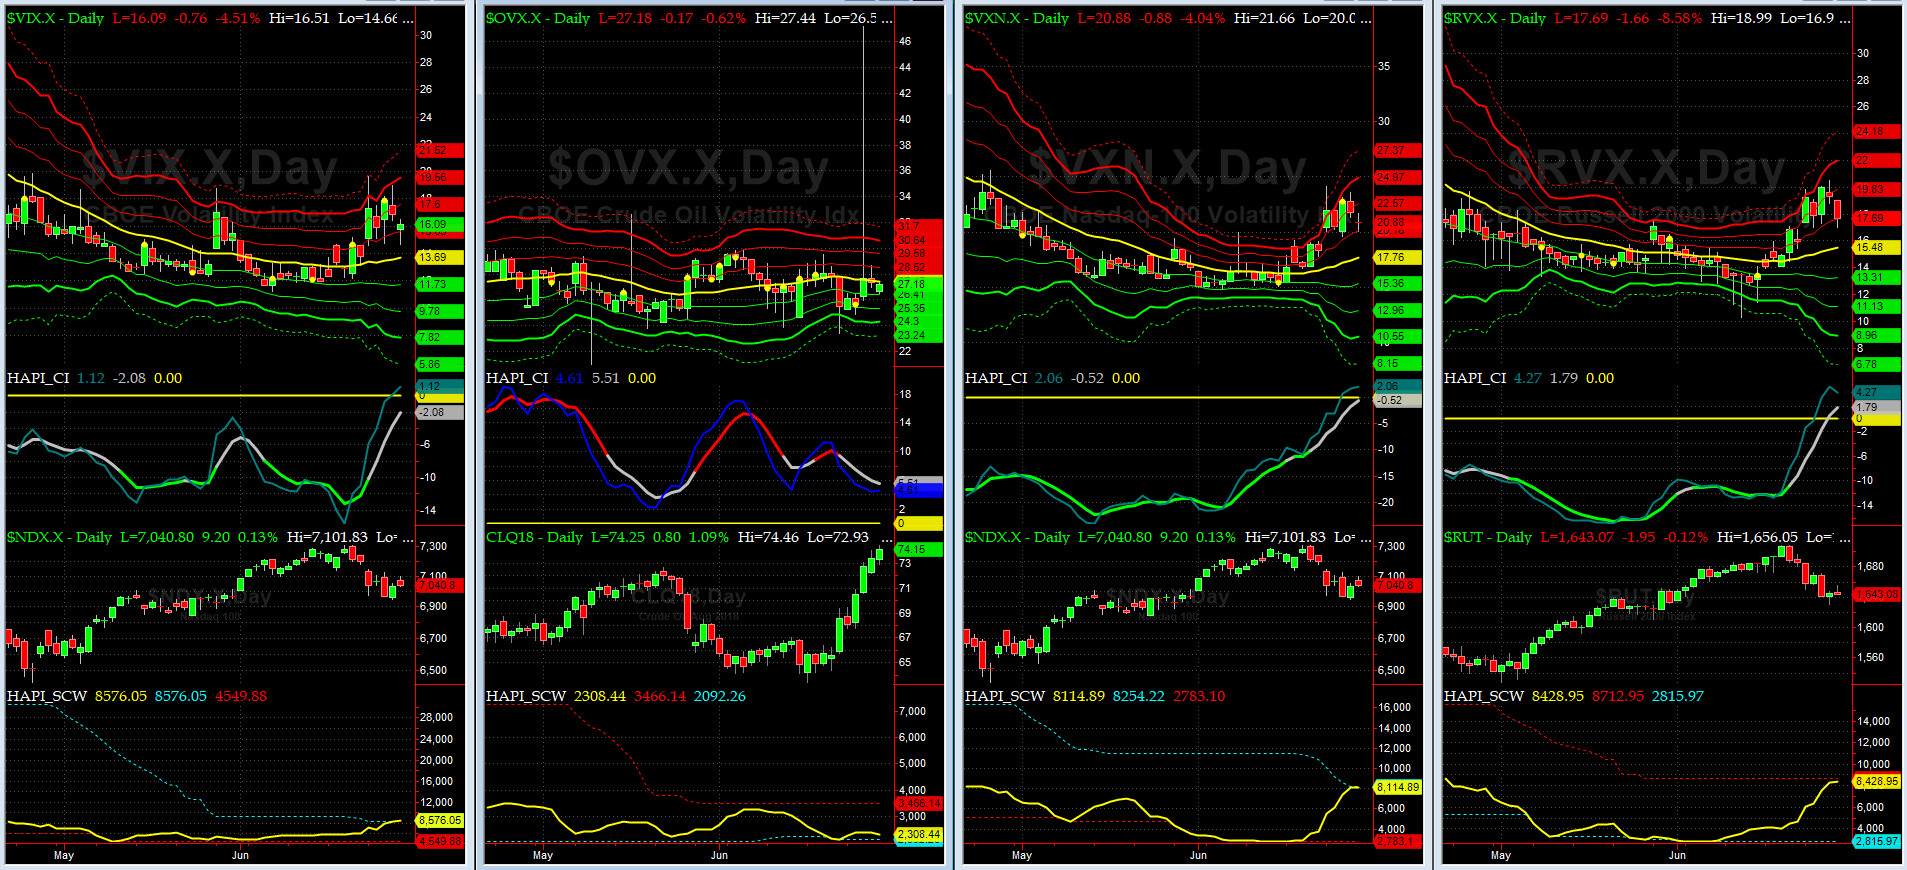
Vol of the Vols Chart
Spot VIX currently stands at 16.09, just above its -1 sigma (remember it's the VIX volatility pattern aka "its sigma channels" that matters, and not the level of VIX itself (this is per Dr. Robert Whaley, a great mentor and inventor of original VIX, now called VXO). VIX usually peaks around a test of its +4 sigma).
We saw a jump in Spot VIX {and front months futures) -- On Monday we hit +4 sigma and then we were at +2.5 sigma when the Wednesday Closed lower - another divergence signal..
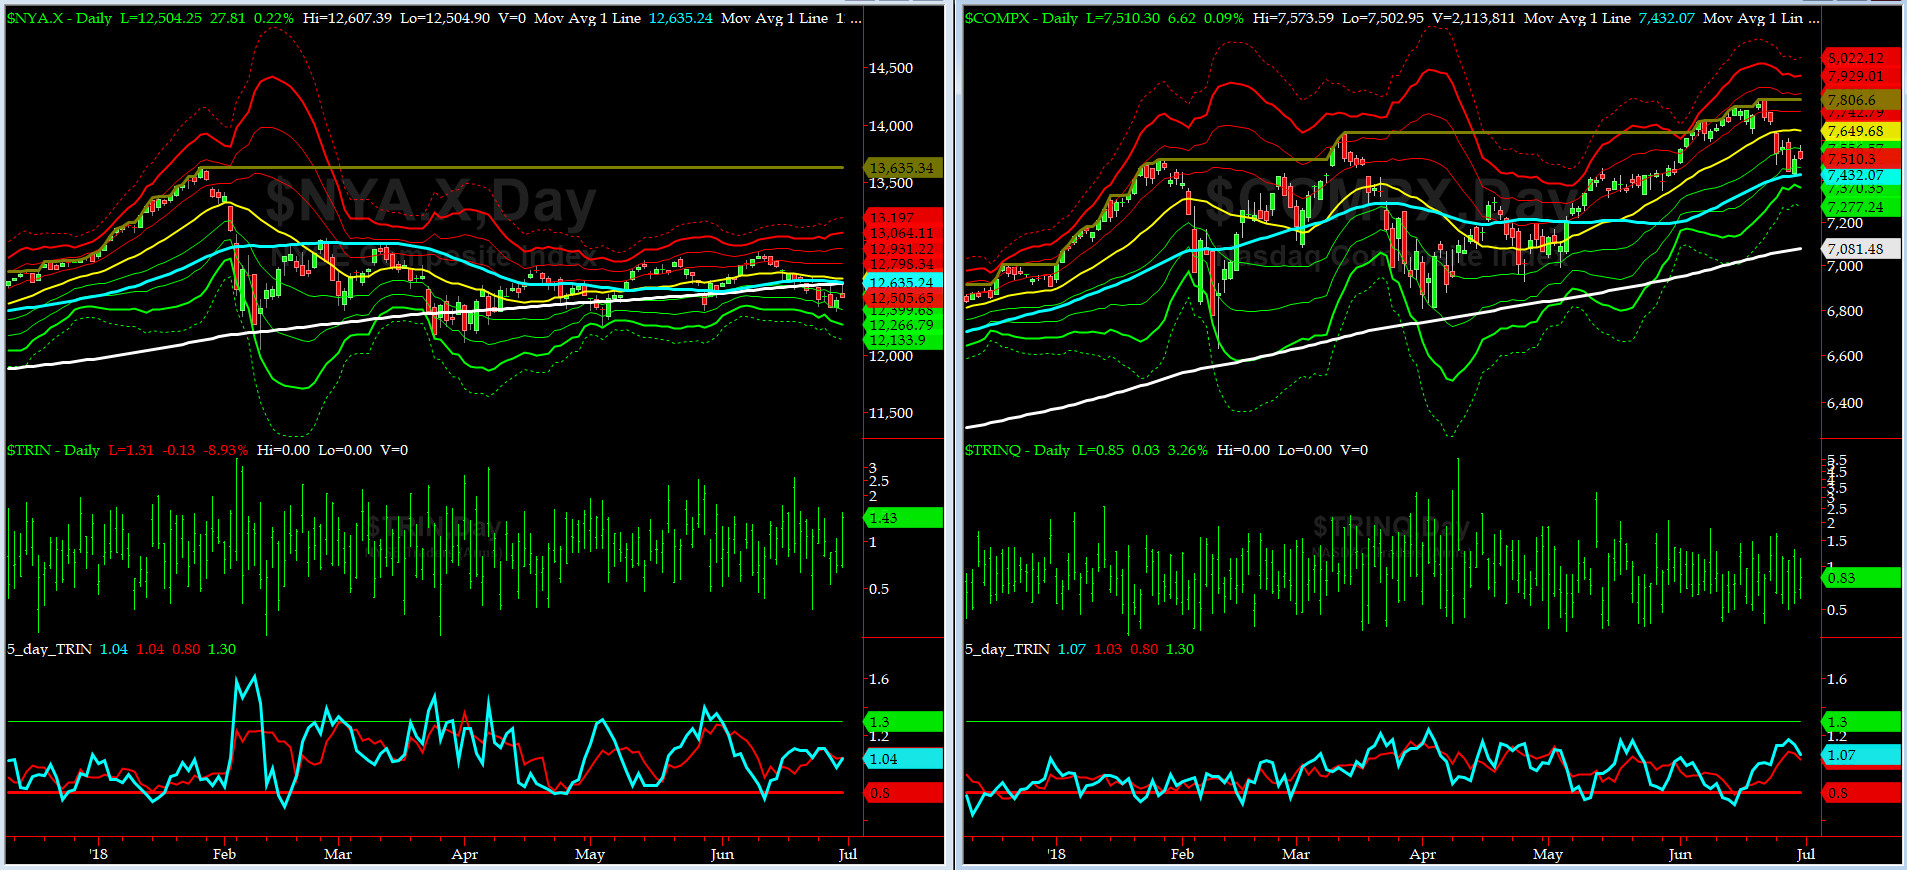
5-day TRIN & TRINQ Charts
Both NYSE & NASDAQ 5-day TRINs are in NEUTRAL zone.
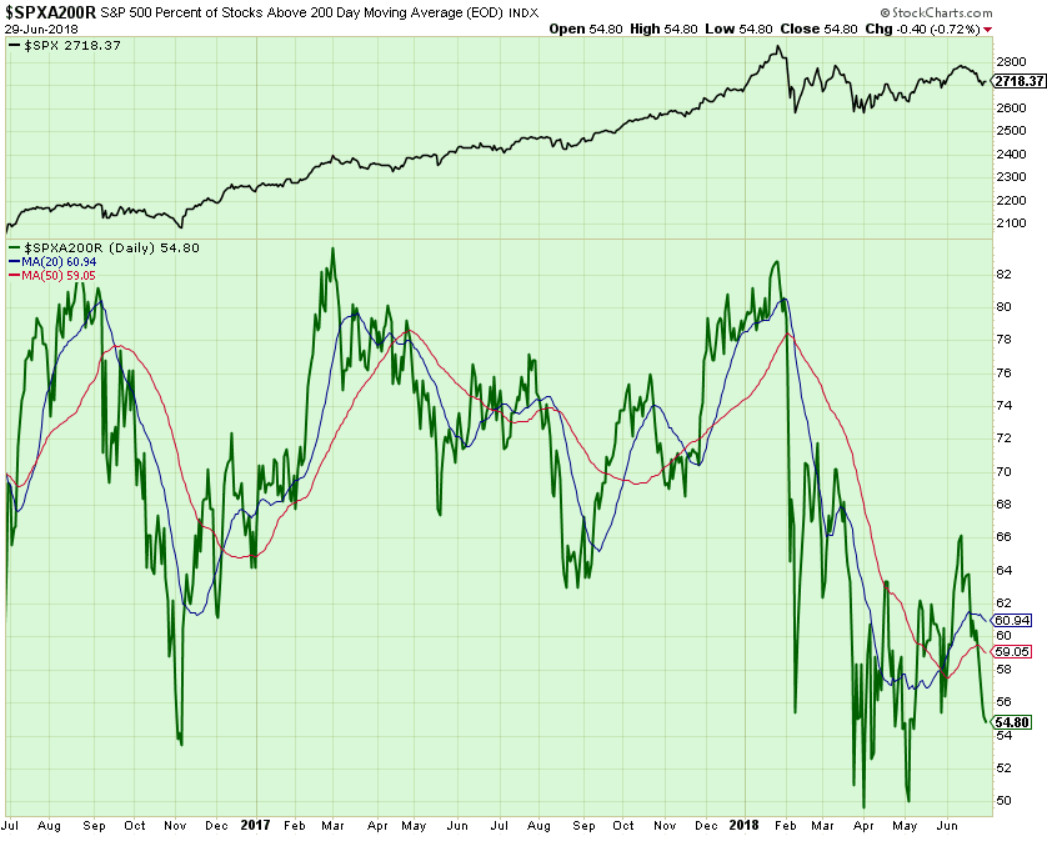
Components of SPX above their respective 200day MA Chart
This scoring indicator dropped further and closed at 54.8% level after testing our lower target of 55%, as discussed here last week.

SPX SKEW (Tail Risk) Chart
On Friday, SPX SKEW (Tail Risk) closed near 141.7, right about its +1 sigma (normal = 120-125, range 100-150).
Is all quiet on the Eastern & Mid-Western Fronts? Capt Tiko thinks so.
How to interpret the value of SPX SKEW? (from CBOE white paper on SKEW)

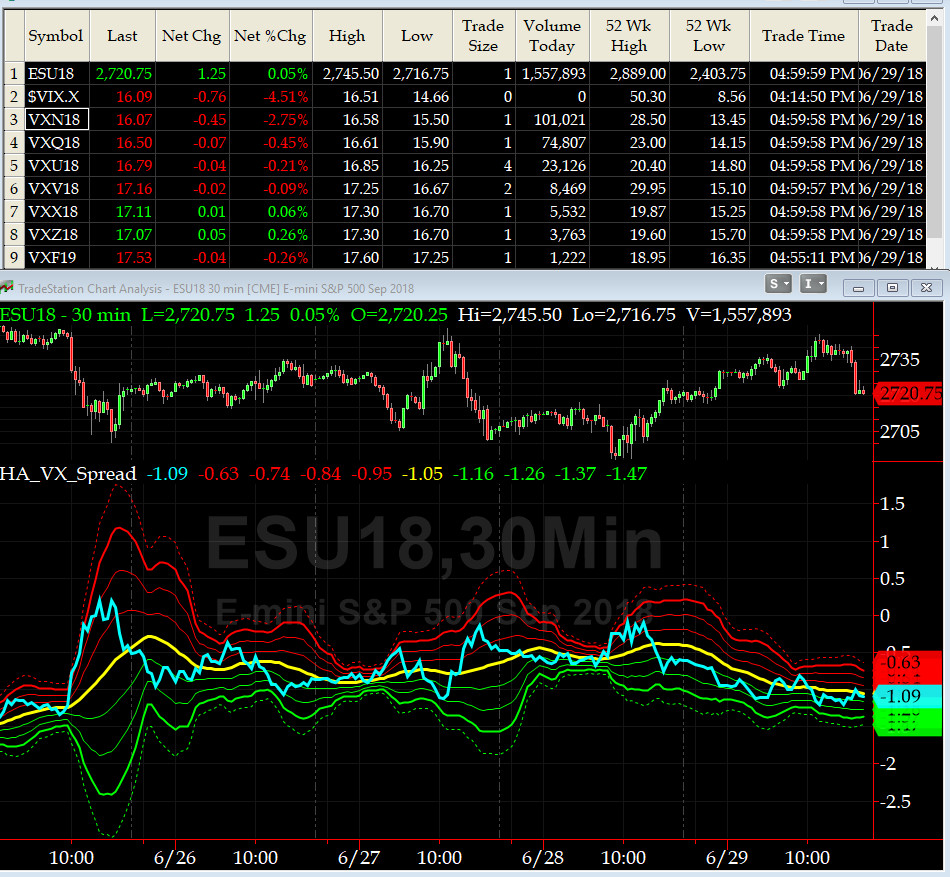
3-month VIX Futures Spread(VX) Chart
This popular timing indicator, (long July, & short Oct VIX Futures) is at -1.09. Mid-week, it hit zero (another sign of a shor-term buttom). Right now, the signal here is NEUTRAL.
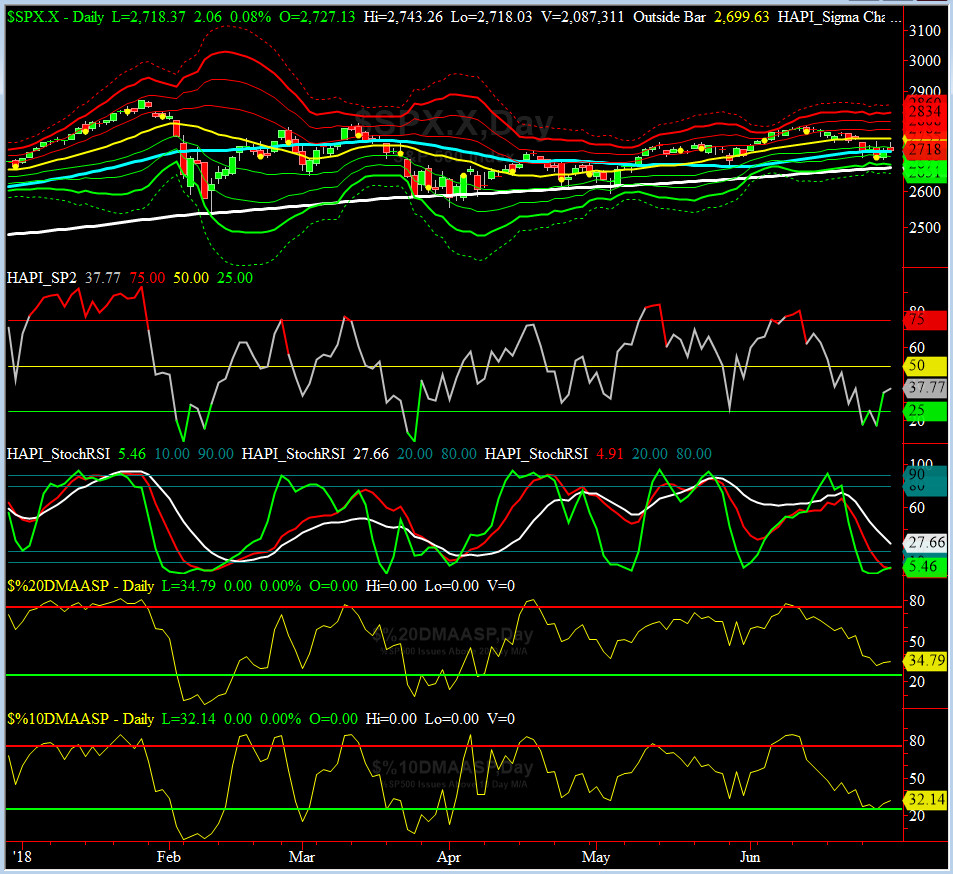
HA_SP2 Chart
HA_SP2 = 37.9 (Buy signal <= 25, Sell Signal >= 75)
This coveted prop indicator dropped hard down to 18 last Monday and then to 17 on Wednesday. That was very oversold. On Friday it closed near 38. Well done SP2, our trusted prop indicator!!!
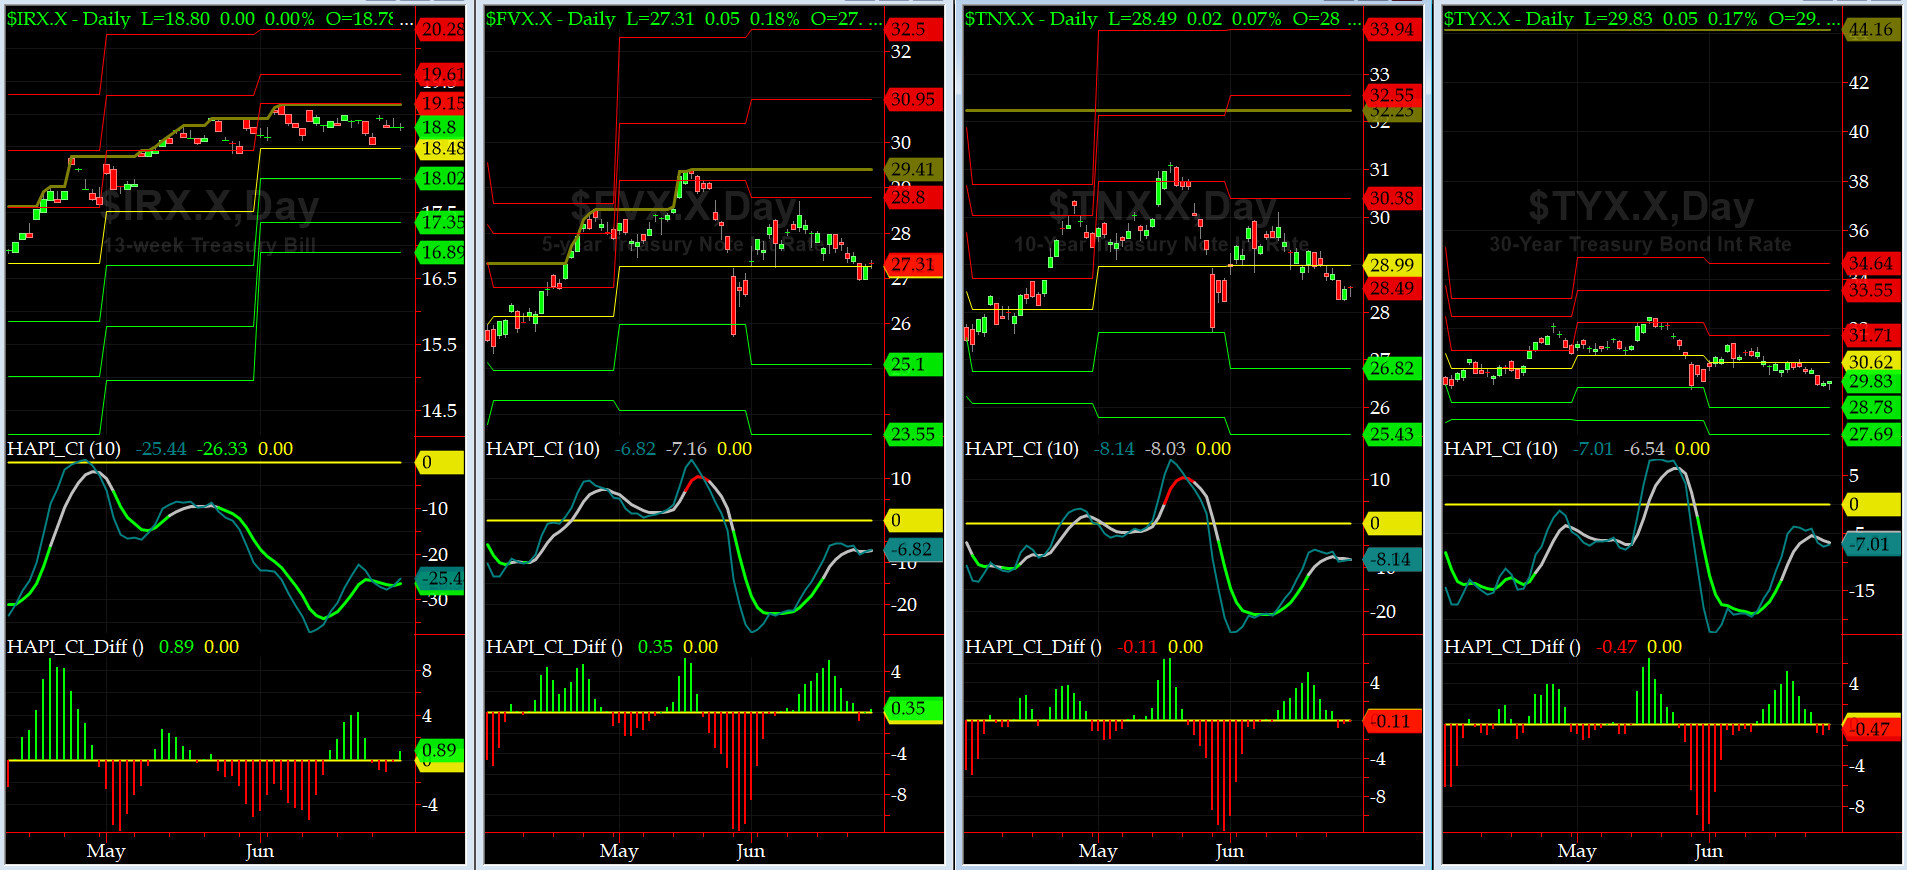
US Treasury T-Notes & T-Bonds Yields Chart
During this past week, the YTMs for the Notes & Bonds, closed the month by dropping further below their monthly Pivots. Maury is now very worried about his Implied Vig. LOL....
Fari Hamzei
|


 Proactive Market Timing