|
Sunday, July 29th, 2018, 2100ET
Market Timing Charts, Analysis & Commentary for Issue #251
Timer Charts of S&P-500 Cash Index (SPX) + NASDAQ-100 Cash Index (NDX)
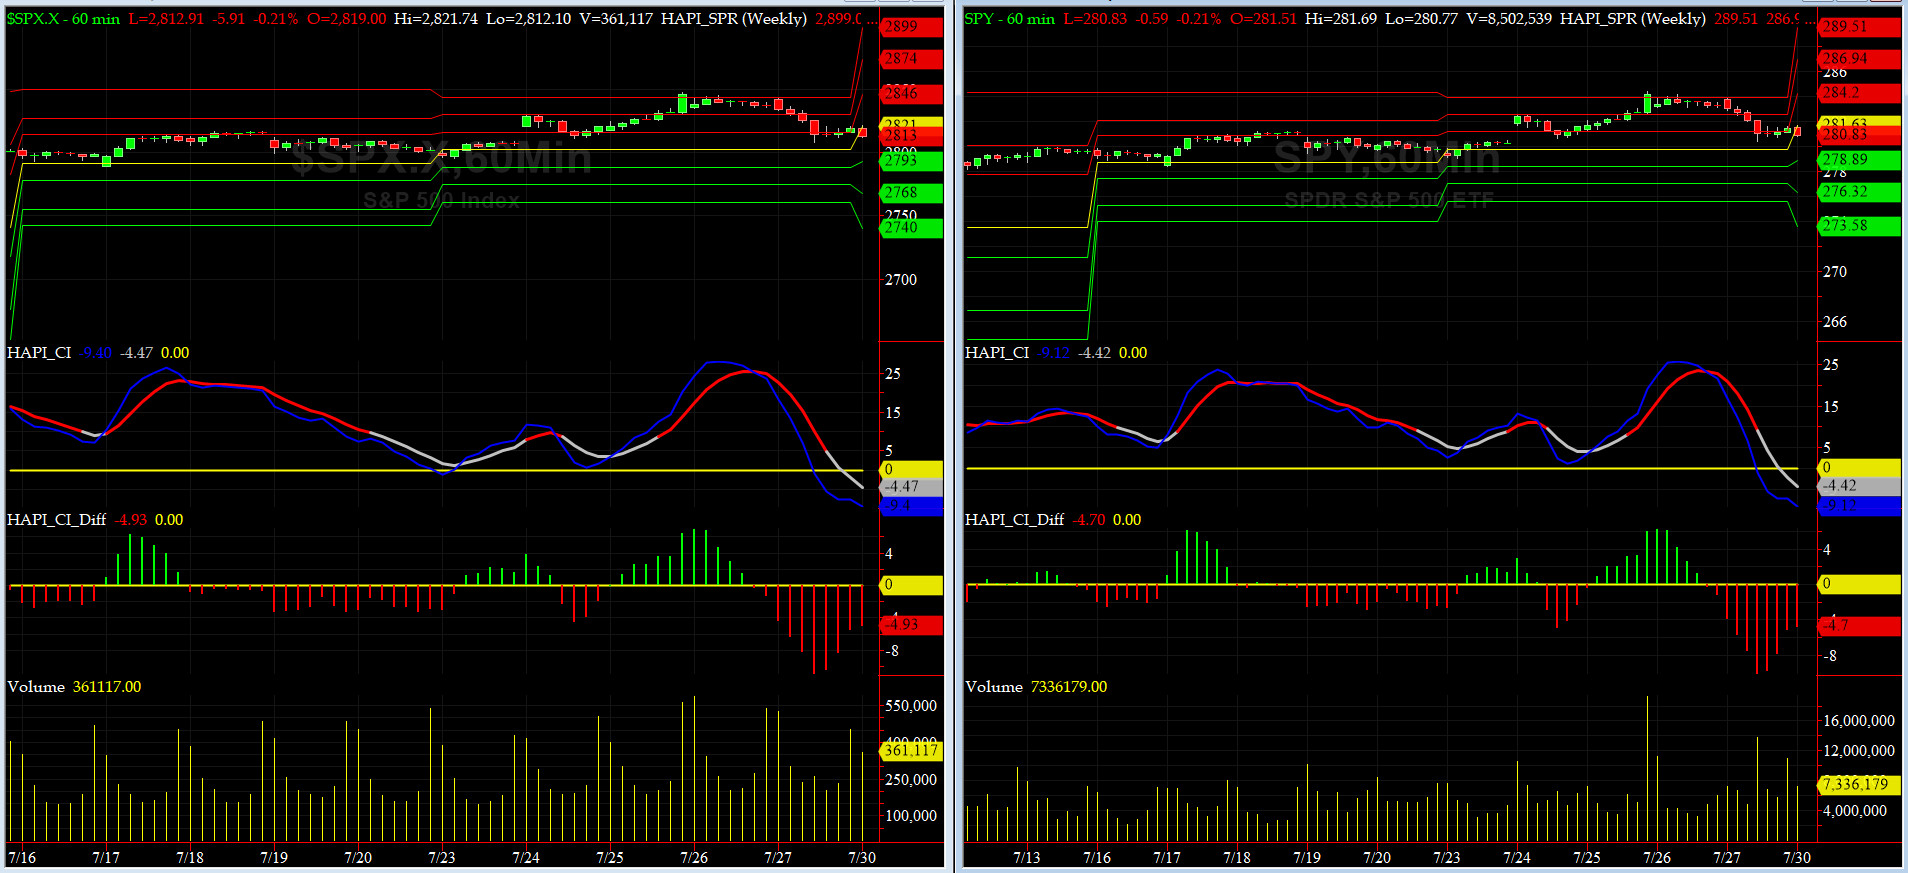
Most recent S&P-500 Cash Index (SPX): 2818 up +17 (up +.6%) for the week ending on Friday, July 27, 2018, which closed about its +1.5 sigma.
DJIA ALL TIME INTRADAY HIGH = 26617 (reached on Friday, January 26, 2018)
TRAN ALL TIME INTRADAY HIGH = 11424 (reached on Tuesday, January 16, 2018)
SPX ALL TIME INTRADAY HIGH = 2873 (reached on Friday, January 26, 2018)
NDX ALL TIME INTRADAY HIGH = 7511 (reached on Wednesday, July 25, 2018)
RUT ALL TIME INTRADAY HIGH = 1708 (reached on Tuesday, July 10, 2018)
Current DAILY +2 Sigma SPX = 2863 with WEEKLY +2 Sigma = 2847
Current DAILY 0 Sigma SPX = 2788 with WEEKLY 0 Sigma = 2718
Current DAILY -2 Sigma SPX = 2713 with WEEKLY -2 Sigma = 2589
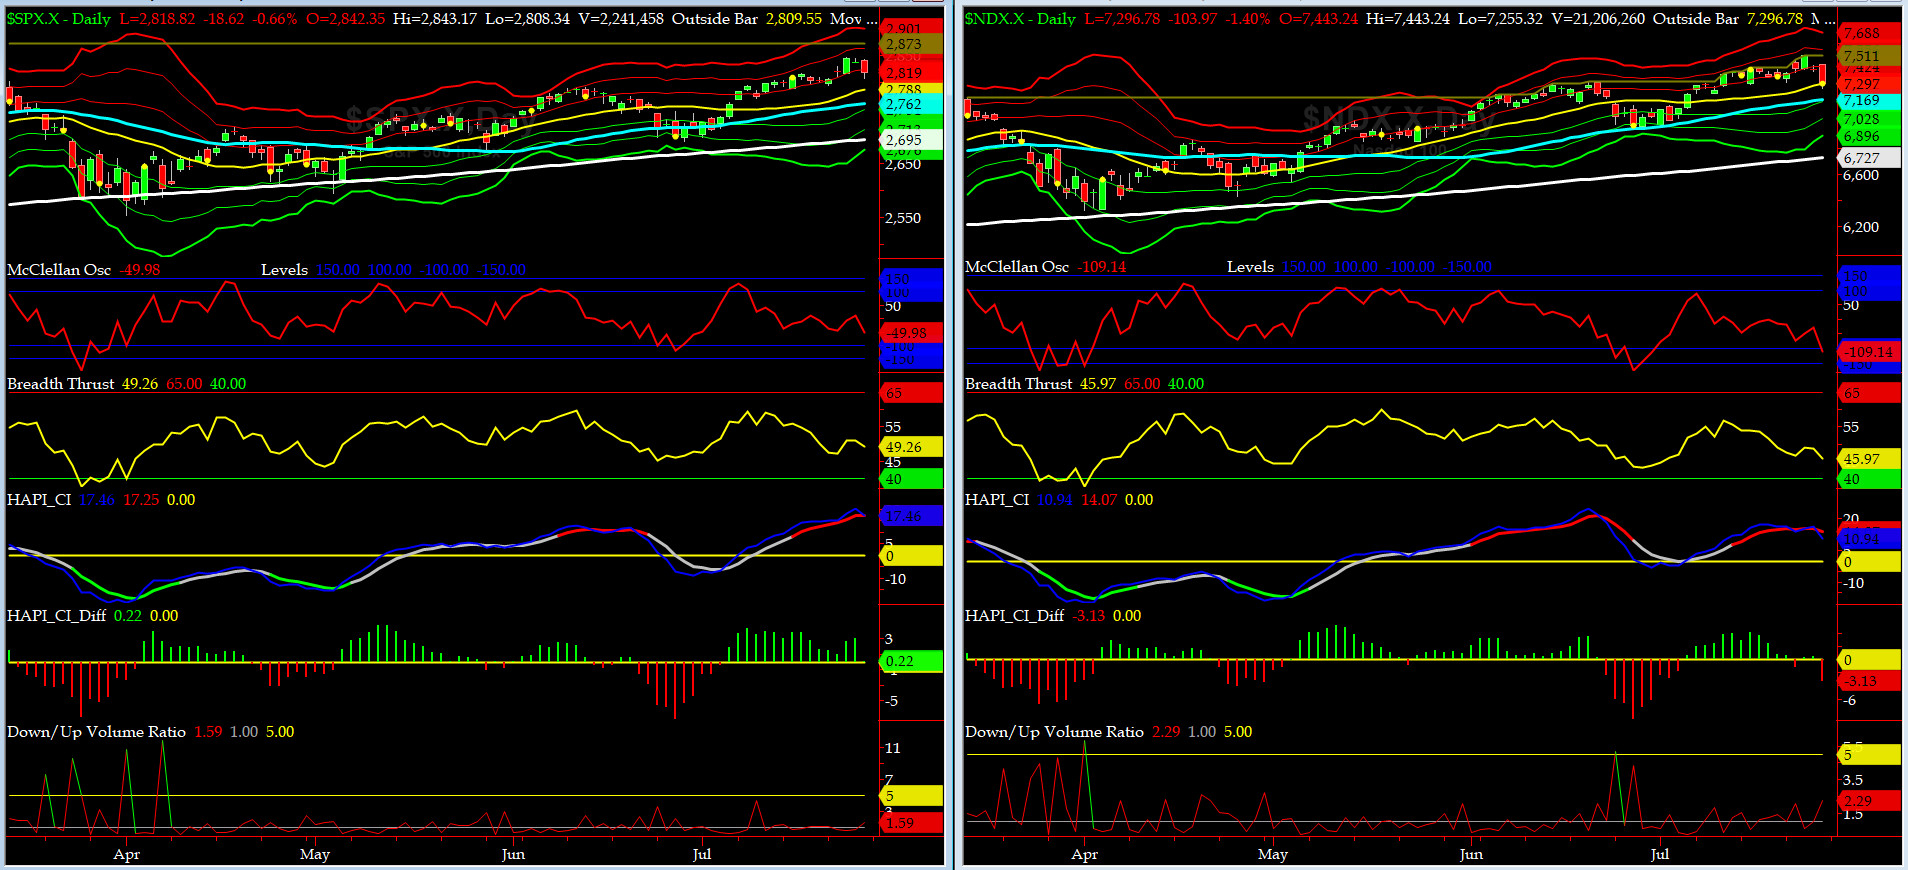
NYSE McClellan Oscillator = -50 (-150 is start of the O/S area; around -275 to -300 area or lower, we go into the �launch-pad� mode, over +150, we are in O/B area)
NYSE Breadth Thrust = 49.3 (40 is considered as oversold and 65 as overbought)
This week shall be etched in most daytraders' memory banks for some time. Talk about intraday vol. Between EPS Reports (both disappointing ones and out-of-the-ballparks), Grumpino related news and GDP coming over 4%, traders had many choppy waters to navigate.
The venerable @Capt_Tiko cashed out on Wednesday when both of his primary & secondary profit targets were DESTROYED. GOT TUNA?
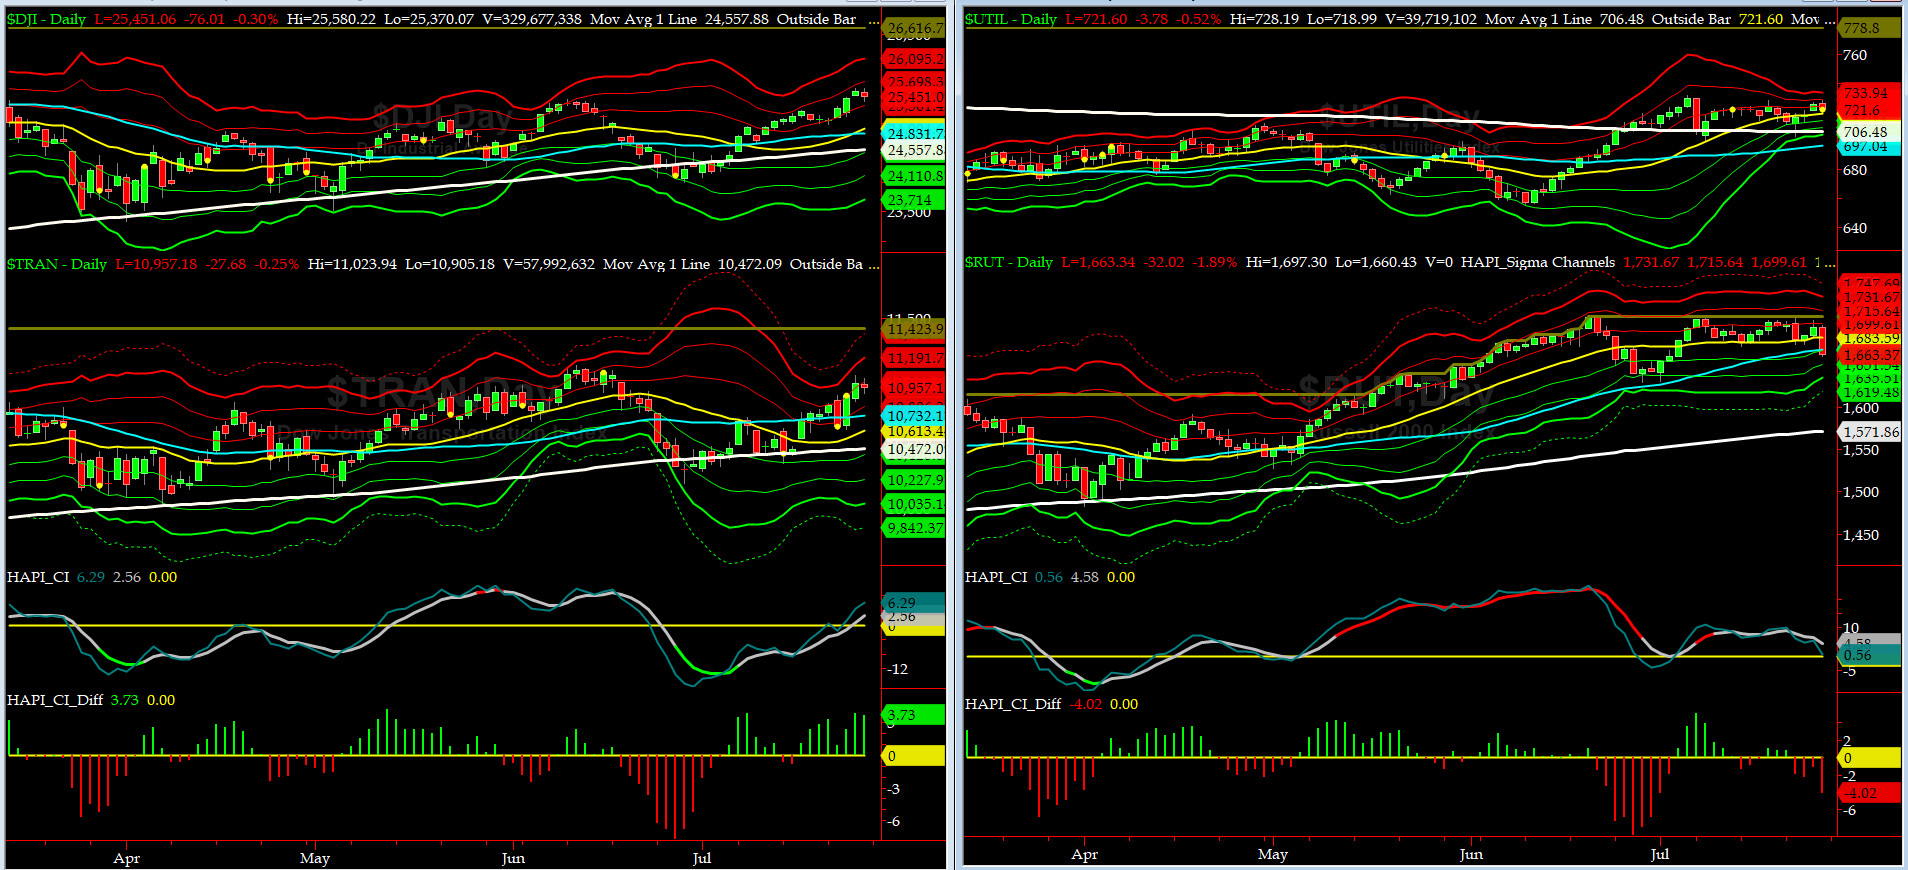
Canaries [in the Coal Mine] Chart for DJ TRAN & RUT Indices
200-Day MA DJ TRAN = 10,472 or 4.6% below DJ TRAN (max observed in last 7 yrs = 20.2%, min = -20.3%)
200-Day MA RUT = 1571 or 5.8% below RUT (max observed in last 7 yrs = 21.3%, min = -22.6%)
DJ Transportation Index (proxy for economic conditions 6 to 9 months hence) finally broke out of its 50-day MA congestion. Next target to get over 11,130.
Russell 2000 Small Caps Index (proxy for Risk ON/OFF) had another very bad day on Friday and sang "nobody loves me..." RISK ON could be at crossroads here (emphasis: could be).
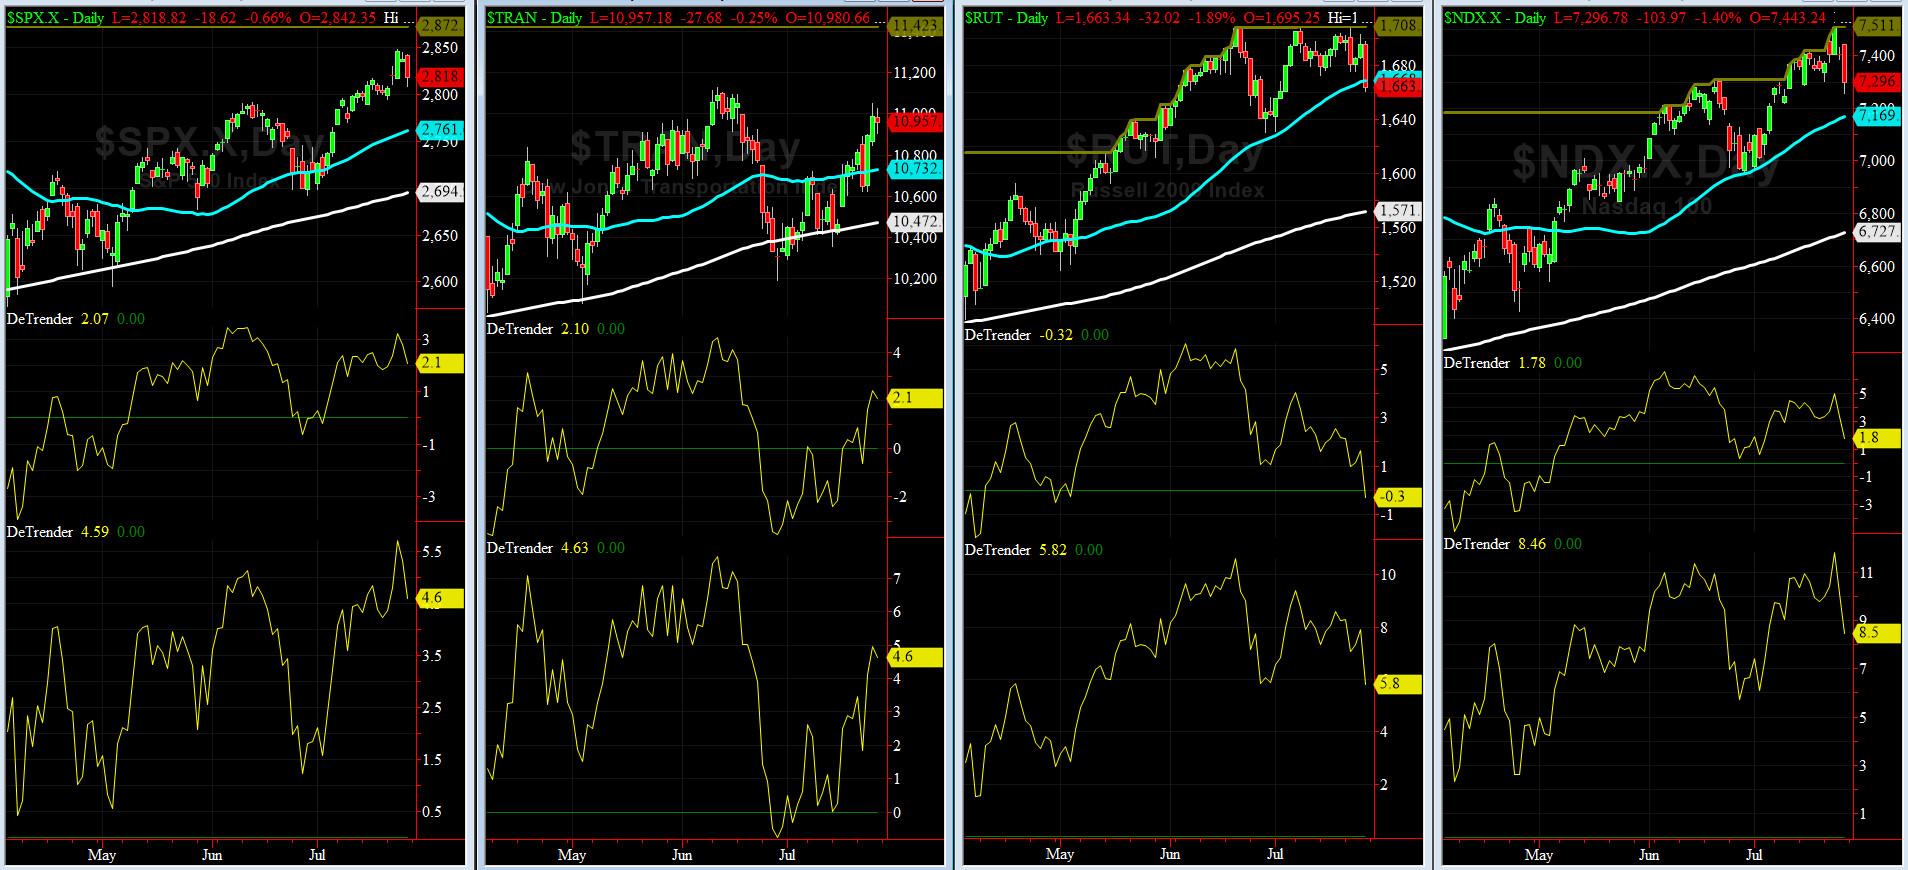
DeTrenders Charts for SPX, NDX, TRAN & RUT Indices
50-Day MA SPX = 2761 or 2.1% below SPX (max observed in last 7 yrs = +8.6%, min = -9.3%)
200-Day MA SPX = 2694 or 4.6% below SPX (max observed in last 7 yrs = 15.2%, min = -14%)
ALL of our EIGHT DeTrenders are in POSITIVE territory. The DeTrenders for DJ Tran & RUT will continue to be harbingers of future price behavior in broad indices.
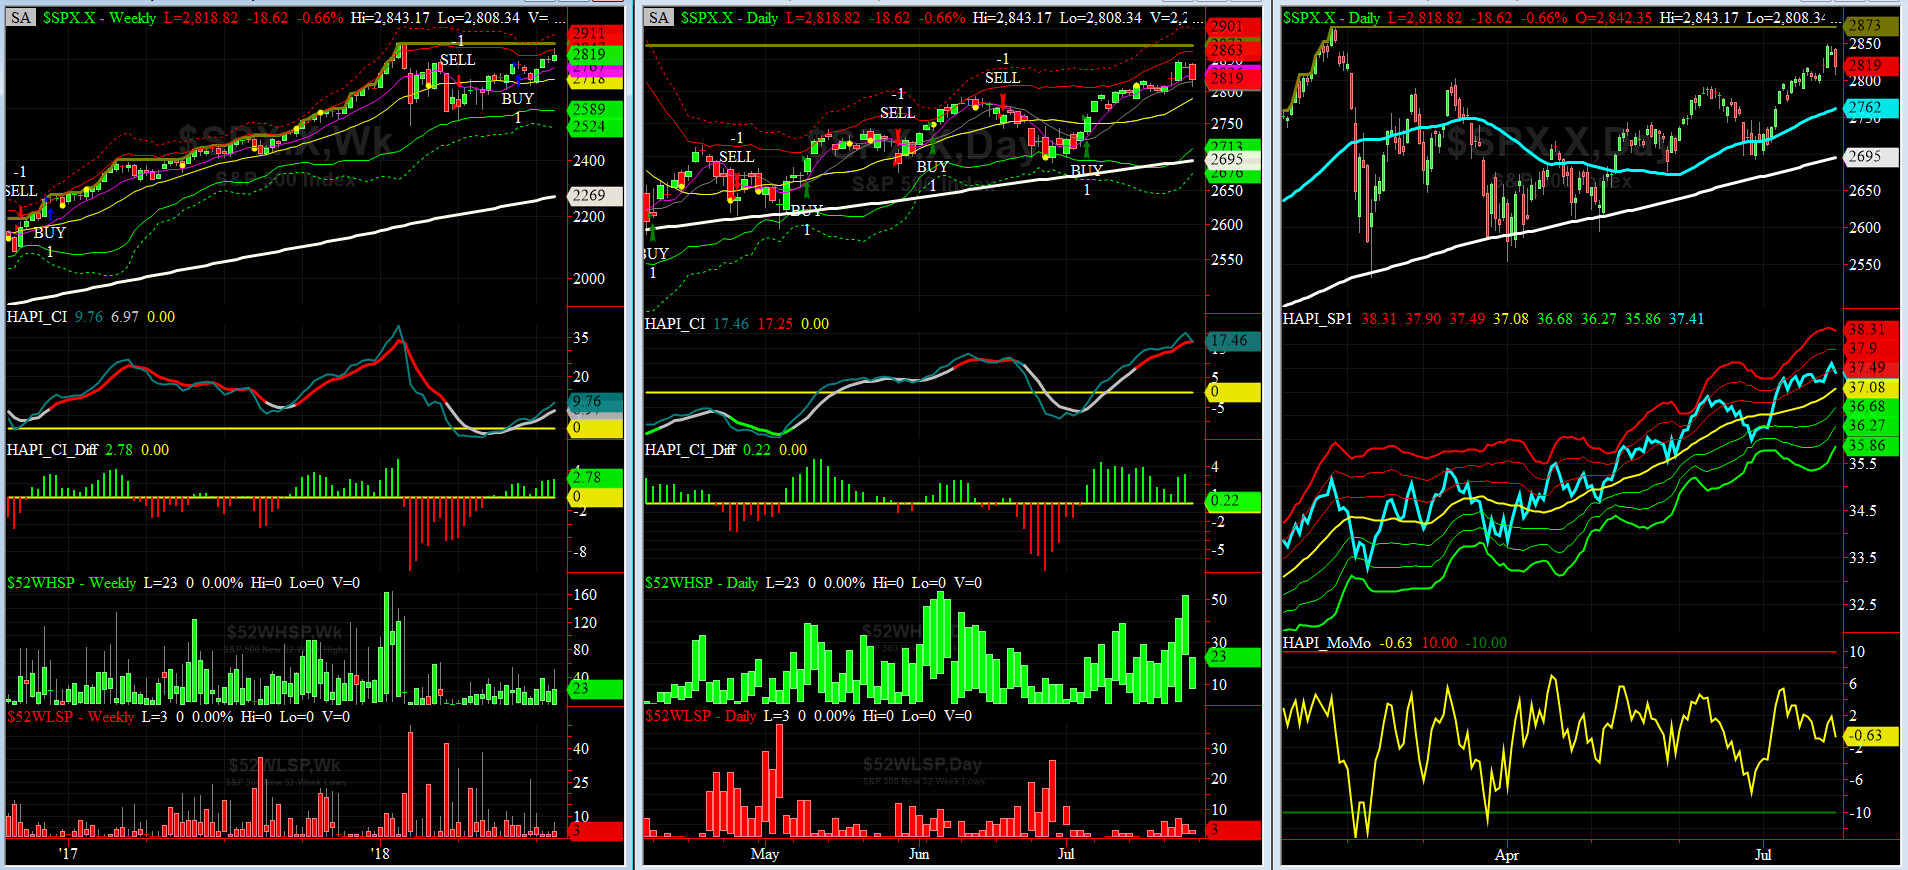
HA_SP1_Momo Chart
WEEKLY Timing Model = on a BUY Signal since Friday, June 15, 2018 CLOSE at 2779
DAILY Timing Model = on a BUY Signal since Friday, July 6, 2018 CLOSE at 2760
Max SPX 52wk-highs reading last week = 52 (over 120-140, the local maxima is in)
Max SPX 52wk-Lows reading last week = 7 (over 40-60, the local minima is in)
HA_SP1 closed above its +1 sigma channels
HA_Momo = -0.6 (reversals most likely occur above +10 or below -10)
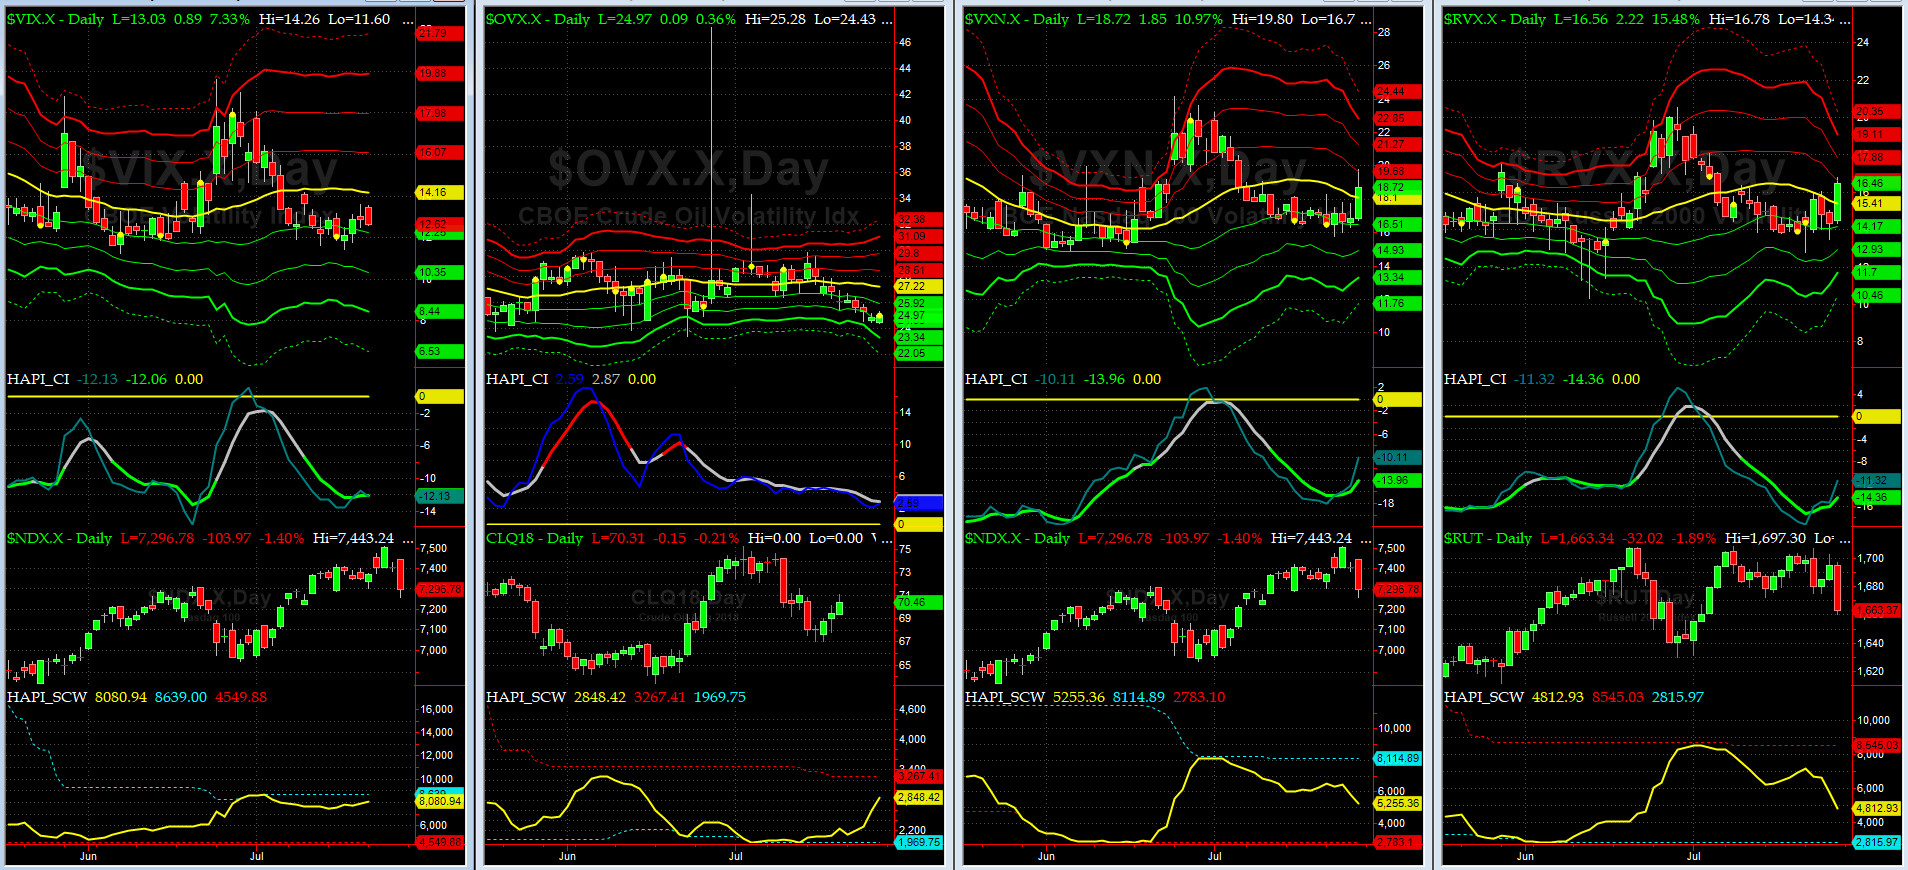
Vol of the Vols Chart
Spot VIX currently stands at 12.62, just a tad above its -1 sigma (remember it's the VIX volatility pattern aka "its sigma channels" that matters, and not the level of VIX itself (this is per Dr. Robert Whaley, a great mentor and inventor of original VIX, now called VXO). VIX usually peaks around a test of its +4 sigma).
VIX continued to flatten out. Should it trade above 14.2 (its current zero sigma), IHOO, it will serve as a decent warning for another sharp drop.
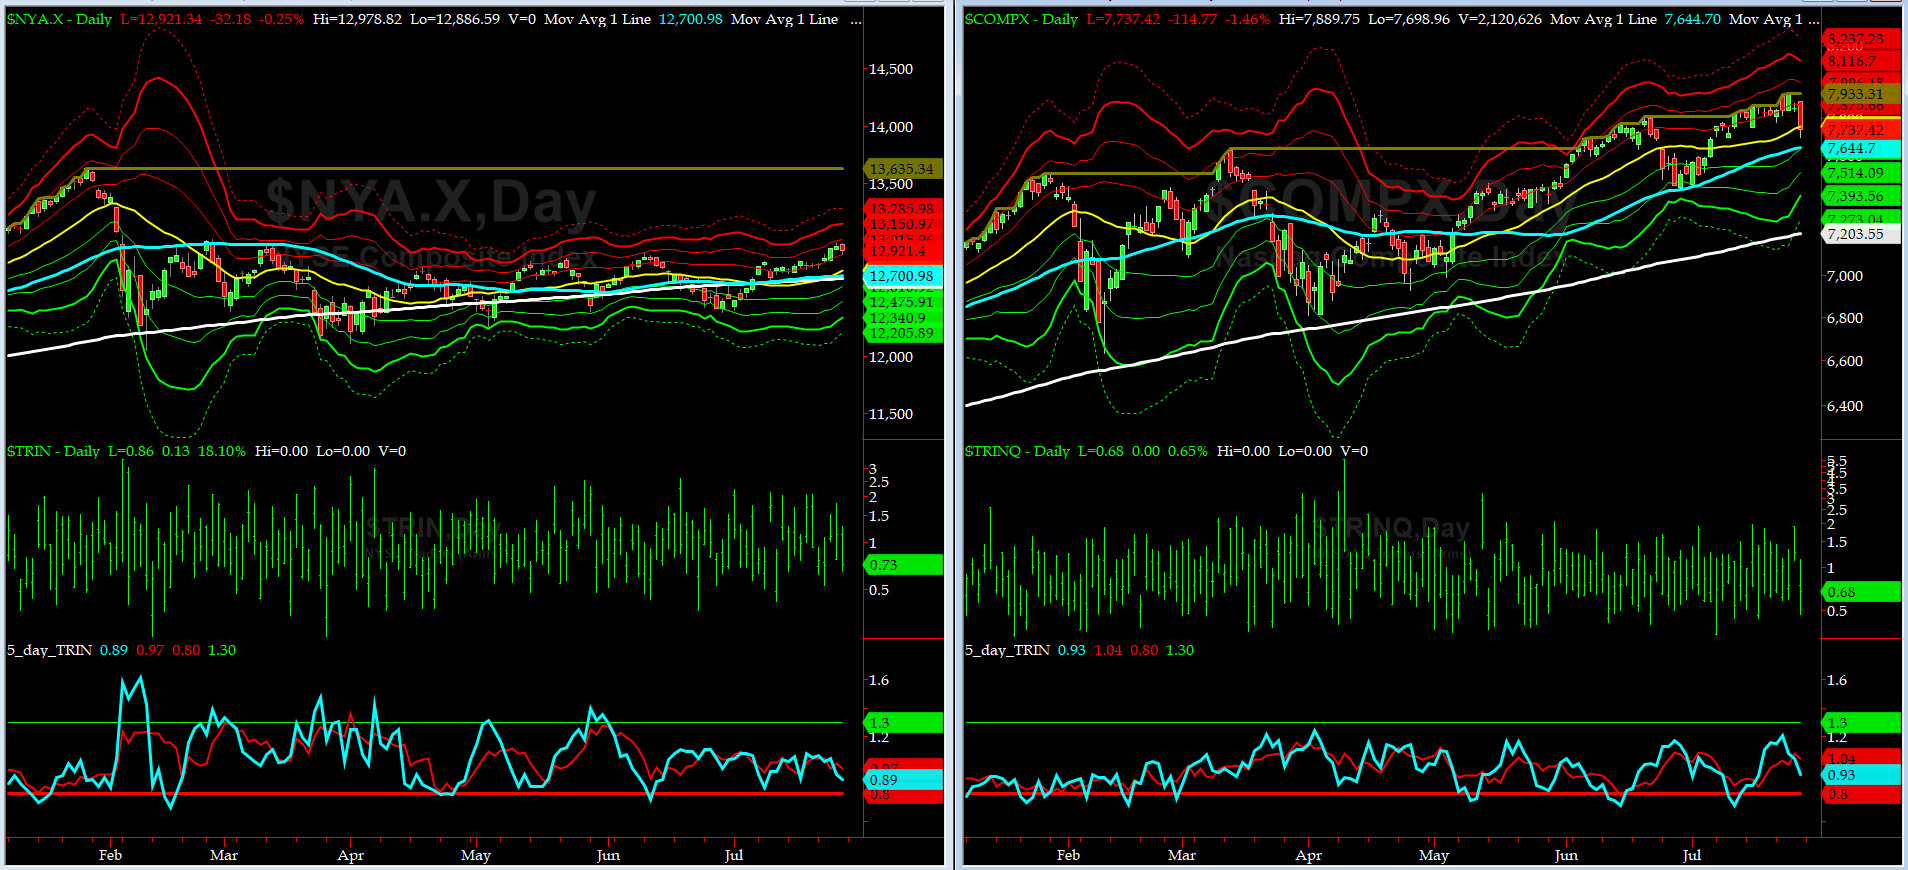
5-day TRIN & TRINQ Charts
Both NYSE & NASDAQ 5-day TRINs are in NEUTRAL zone.
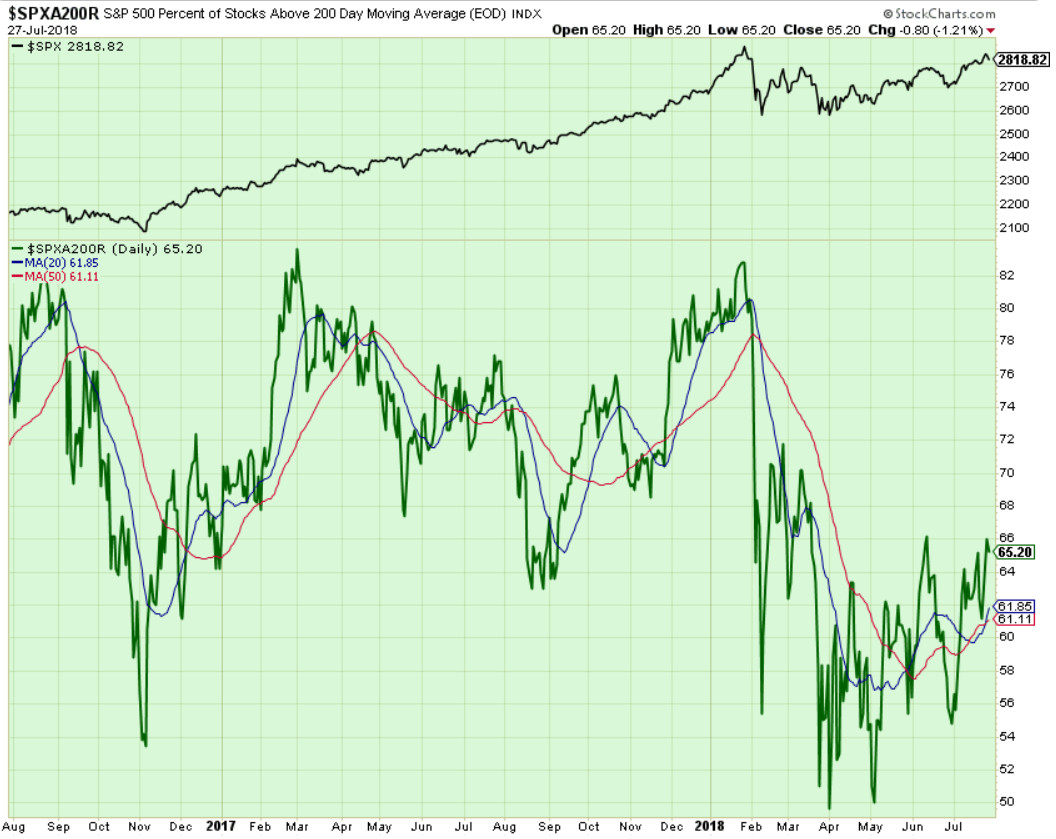
Components of SPX above their respective 200day MA Chart
This scoring indicator finally started it ascend to mid-60s area. Next targets remain the same: should we continue to move up is a break out to 72% area and then the low 80%s.

SPX SKEW (Tail Risk) Chart
On Friday, SPX SKEW (Tail Risk) closed near 144.6, right about its zero sigma (normal = 120-125, range 100-150).
Is all quiet on the Eastern & Mid-Western Fronts? Our beloved @Capt_Tiko gives us a lukewarm yes this week now we have drifted down from ATHs.
How to interpret the value of SPX SKEW? (from CBOE white paper on SKEW)

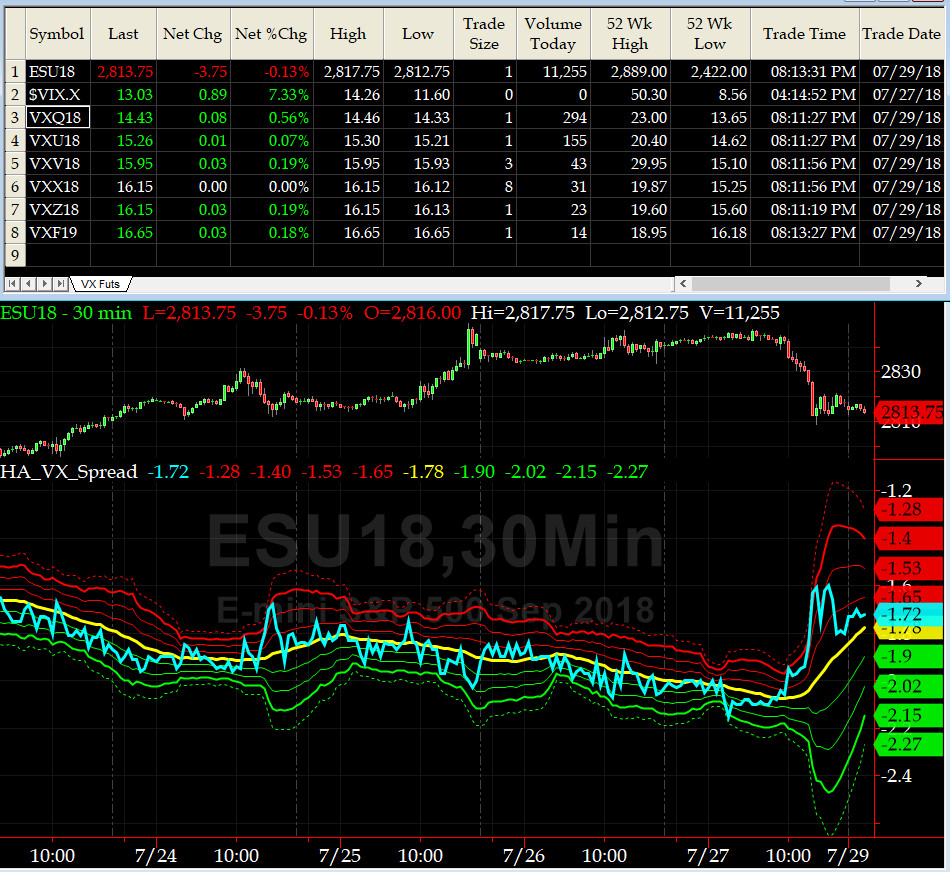
3-month VIX Futures Spread(VX) Chart
This popular timing indicator, (long AUG, & short NOV VIX Futures) is at -1.75. This is a very NEUTRAL reading.
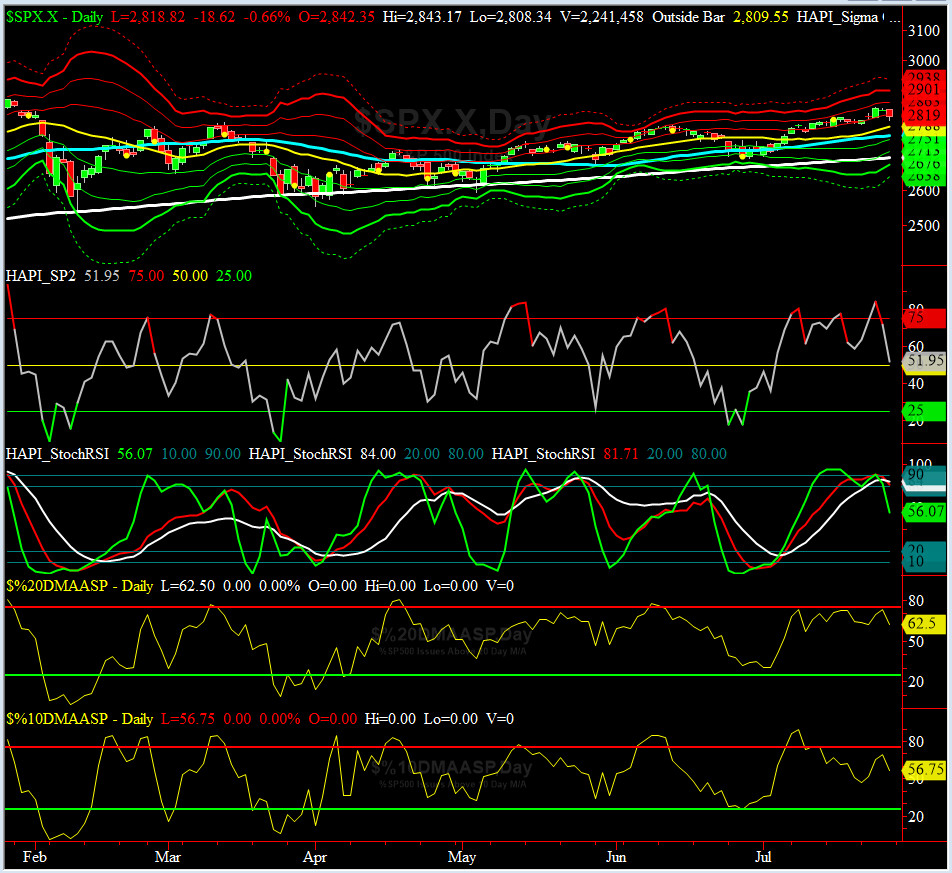
HA_SP2 Chart
HA_SP2 = 52 (Buy signal <= 25, Sell Signal >= 75)
Our coveted SP2 prop indicator rose up to 84 on Wednesday (right before FB missed revenue and global daily active user projections & then guided lower) and then on Friday with GDP out, sold off hard to near its NEUTRAL area.
As discussed before here all three-timeframe StockRSIs went thru a 'potential' short-term top formation.
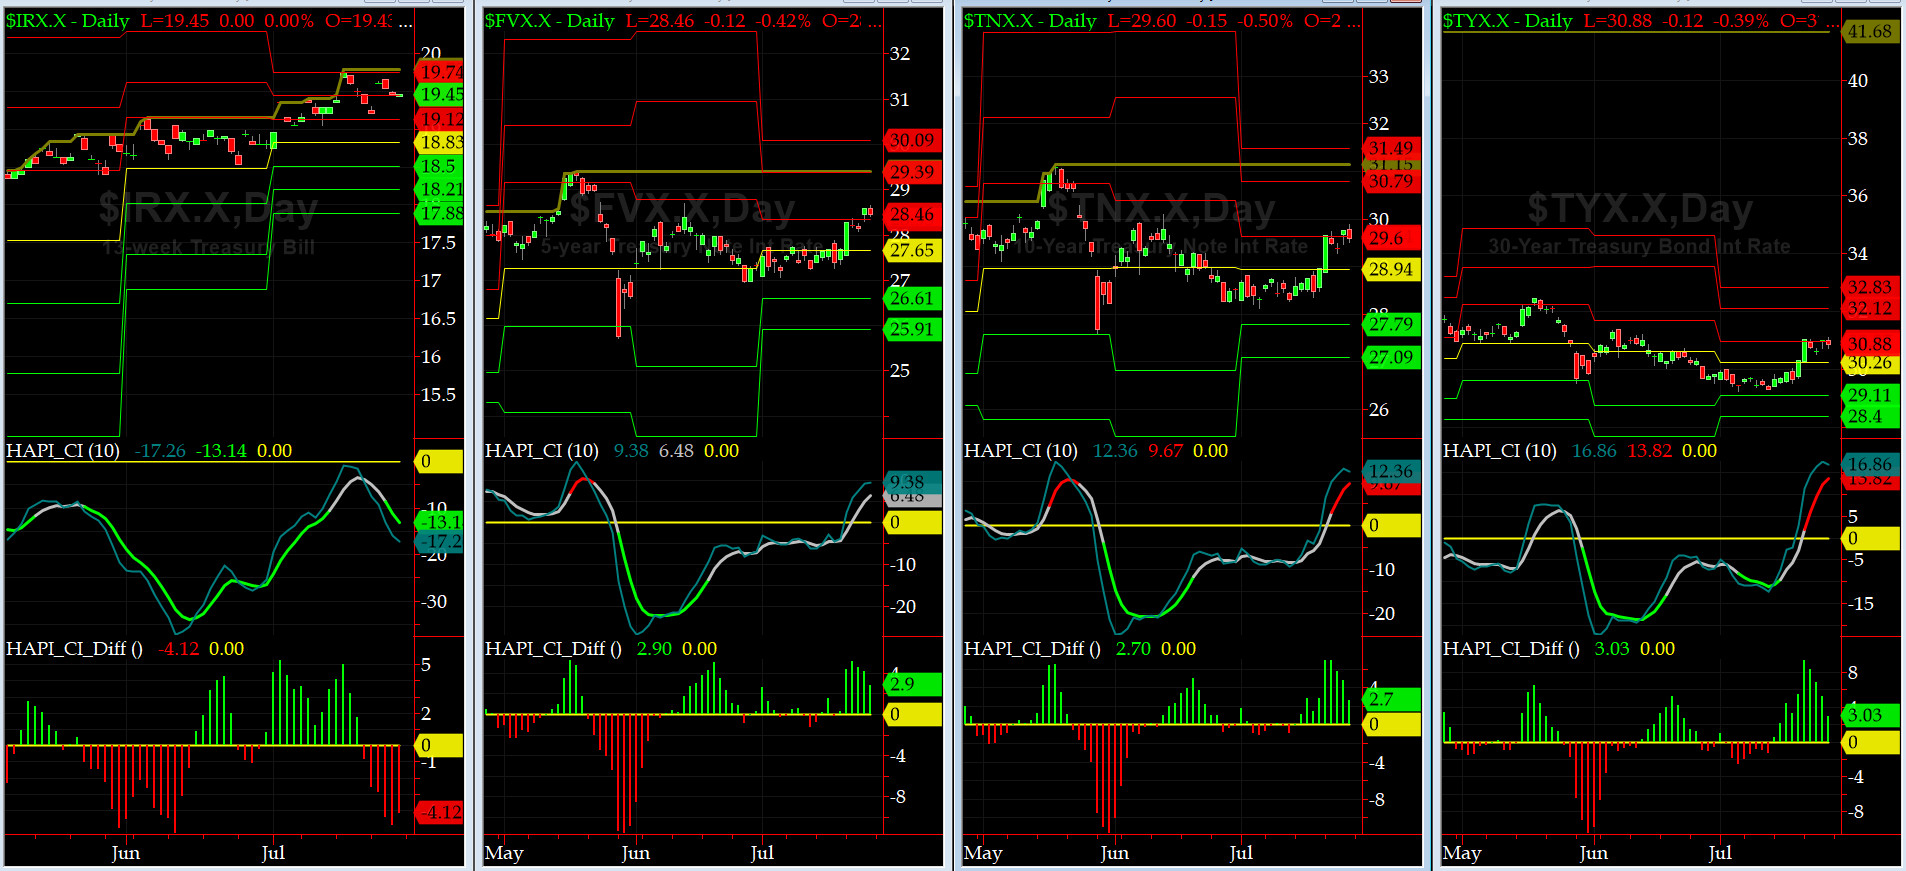
US Treasury T-Notes & T-Bonds Yields Chart
During this past week, the YTMs for the Notes & Bonds, moved very hard on Monday and then traded pretty much for balance of the week. Our beloved Maury is happy as a clam now.
Fari Hamzei
|


 Proactive Market Timing