|
Sunday, September 2nd, 2018, 1600ET
Market Timing Charts, Analysis & Commentary for Issue #256
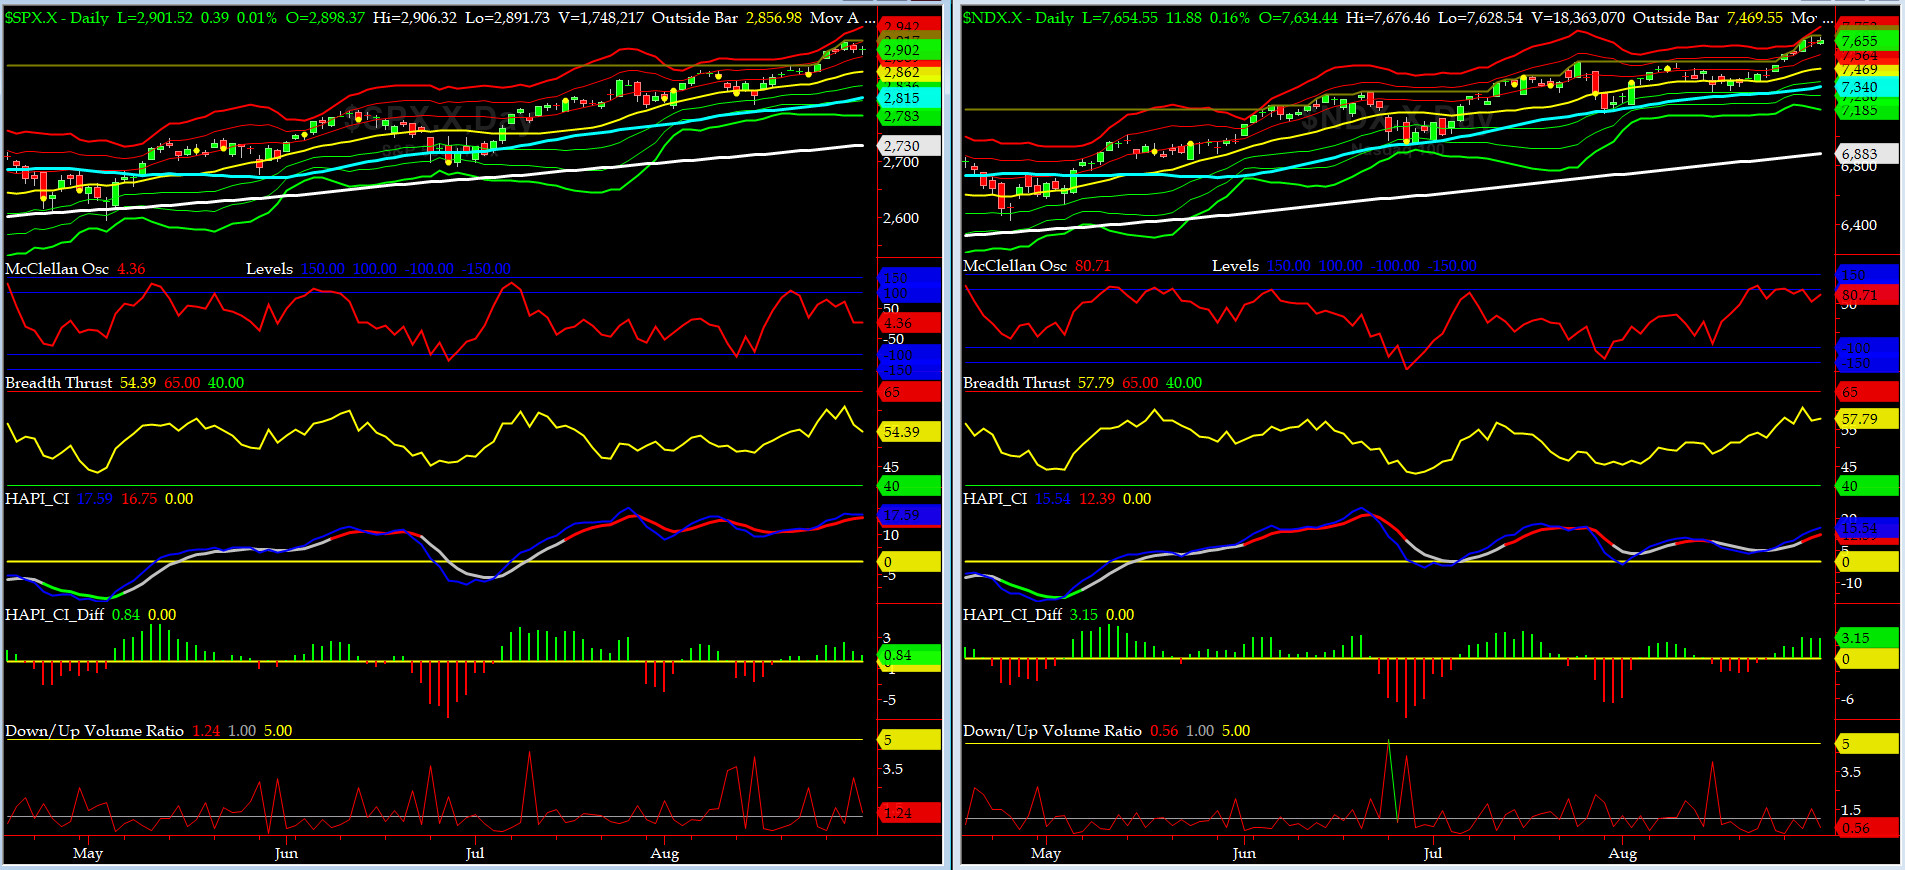
Timer Charts of S&P-500 Cash Index (SPX) + NASDAQ-100 Cash Index (NDX)
Most recent S&P-500 Cash Index (SPX): 2902 up +28 (up +0.97%) for the week ending on Friday, August 31, 2018, which closed about its +1.5 sigma.
DJIA ALL TIME INTRADAY HIGH = 26617 (reached on Friday, January 26, 2018)
TRAN ALL TIME INTRADAY HIGH = 11475 (reached on Tuesday, August 28, 2018)
SPX ALL TIME INTRADAY HIGH = 2916 (reached on Wednesday, August 29, 2018)
NDX ALL TIME INTRADAY HIGH = 7691 (reached on Thursday, August 30, 2018)
RUT ALL TIME INTRADAY HIGH = 1742 (reached on Friday, August 31, 2018)
Current DAILY +2 Sigma SPX = 2917 with WEEKLY +2 Sigma = 2906
Current DAILY 0 Sigma SPX = 2862 with WEEKLY 0 Sigma = 2771
Current DAILY -2 Sigma SPX = 2809 with WEEKLY -2 Sigma = 2636
NYSE McClellan Oscillator = +4 (-150 is start of the O/S area; around -275 to -300 area or lower, we go into the �launch-pad� mode; over +150, we are in O/B area)
NYSE Breadth Thrust = 54.4 (40 is considered as oversold and 65 as overbought)
In the last two weeks, all major indices have put in new ATHs....... Cheers!!
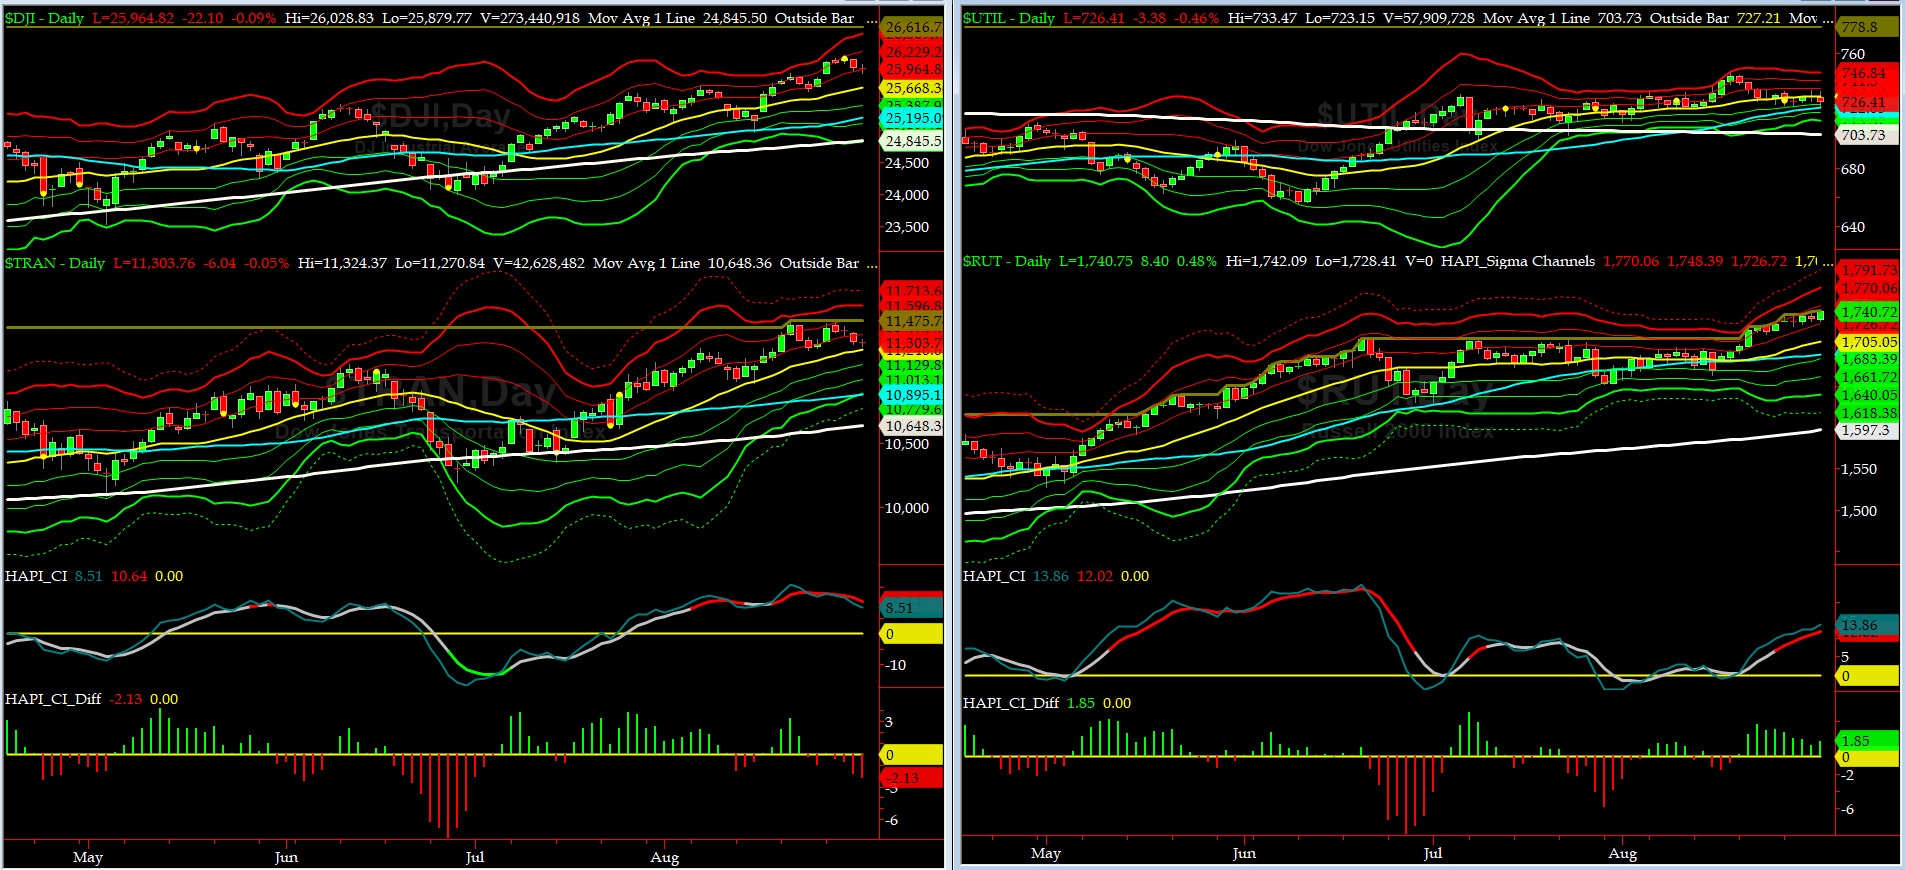
Canaries [in the Coal Mine] Chart for DJ TRAN & RUT Indices
200-Day MA DJ TRAN = 10,648 or 6.2% below DJ TRAN (max observed in last 7 yrs = 20.2%, min = -20.3%)
200-Day MA RUT = 1597 or 9% below RUT (max observed in last 7 yrs = 21.3%, min = -22.6%)
DJ Transportation Index (proxy for economic conditions 6 to 9 months hence) again put in a new all-time high(ATH) on Tuesday but sold off for the rest of the week.
Russell 2000 Small Caps Index (proxy for Risk ON/OFF) made three new ATHs last week and closed near 1741. RISK is ON again.
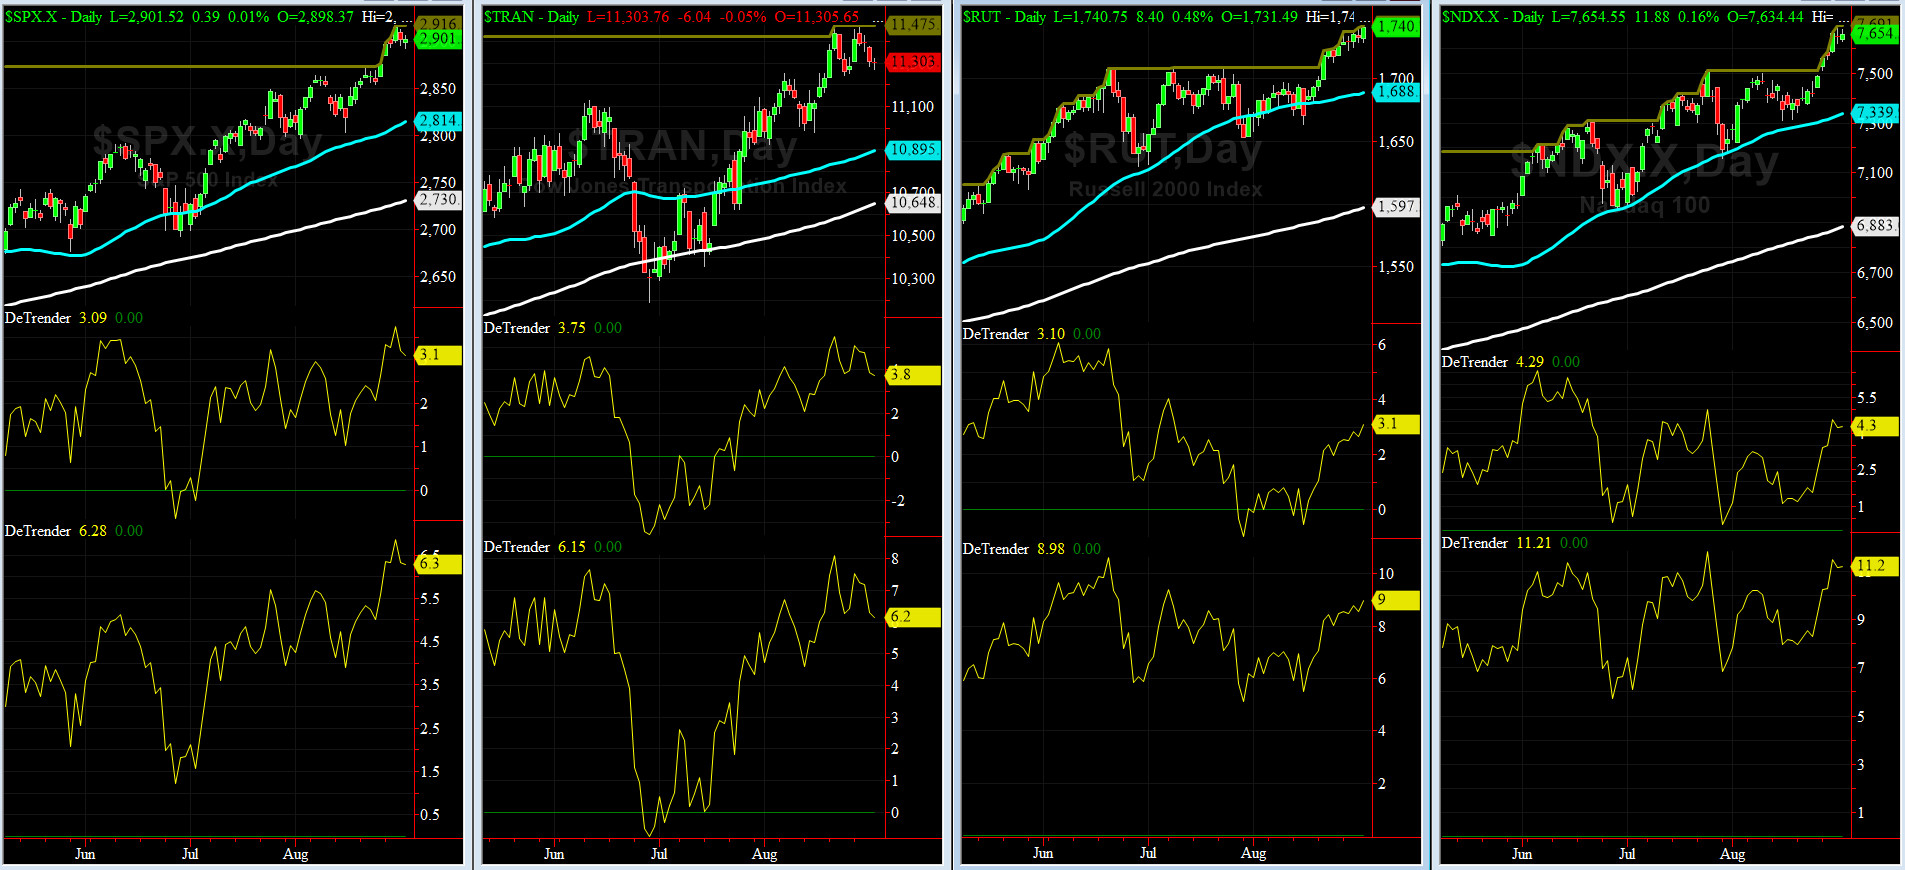
DeTrenders Charts for SPX, NDX, TRAN & RUT Indices
50-Day MA SPX = 2814 or 3.1% below SPX (max observed in last 7 yrs = +8.6%, min = -9.3%)
200-Day MA SPX = 2730 or 6.3% below SPX (max observed in last 7 yrs = 15.2%, min = -14%)
ALL of our EIGHT DeTrenders are in POSITIVE territory. The DeTrenders for DJ Tran & RUT will continue to be harbingers of future price behavior in broad indices.
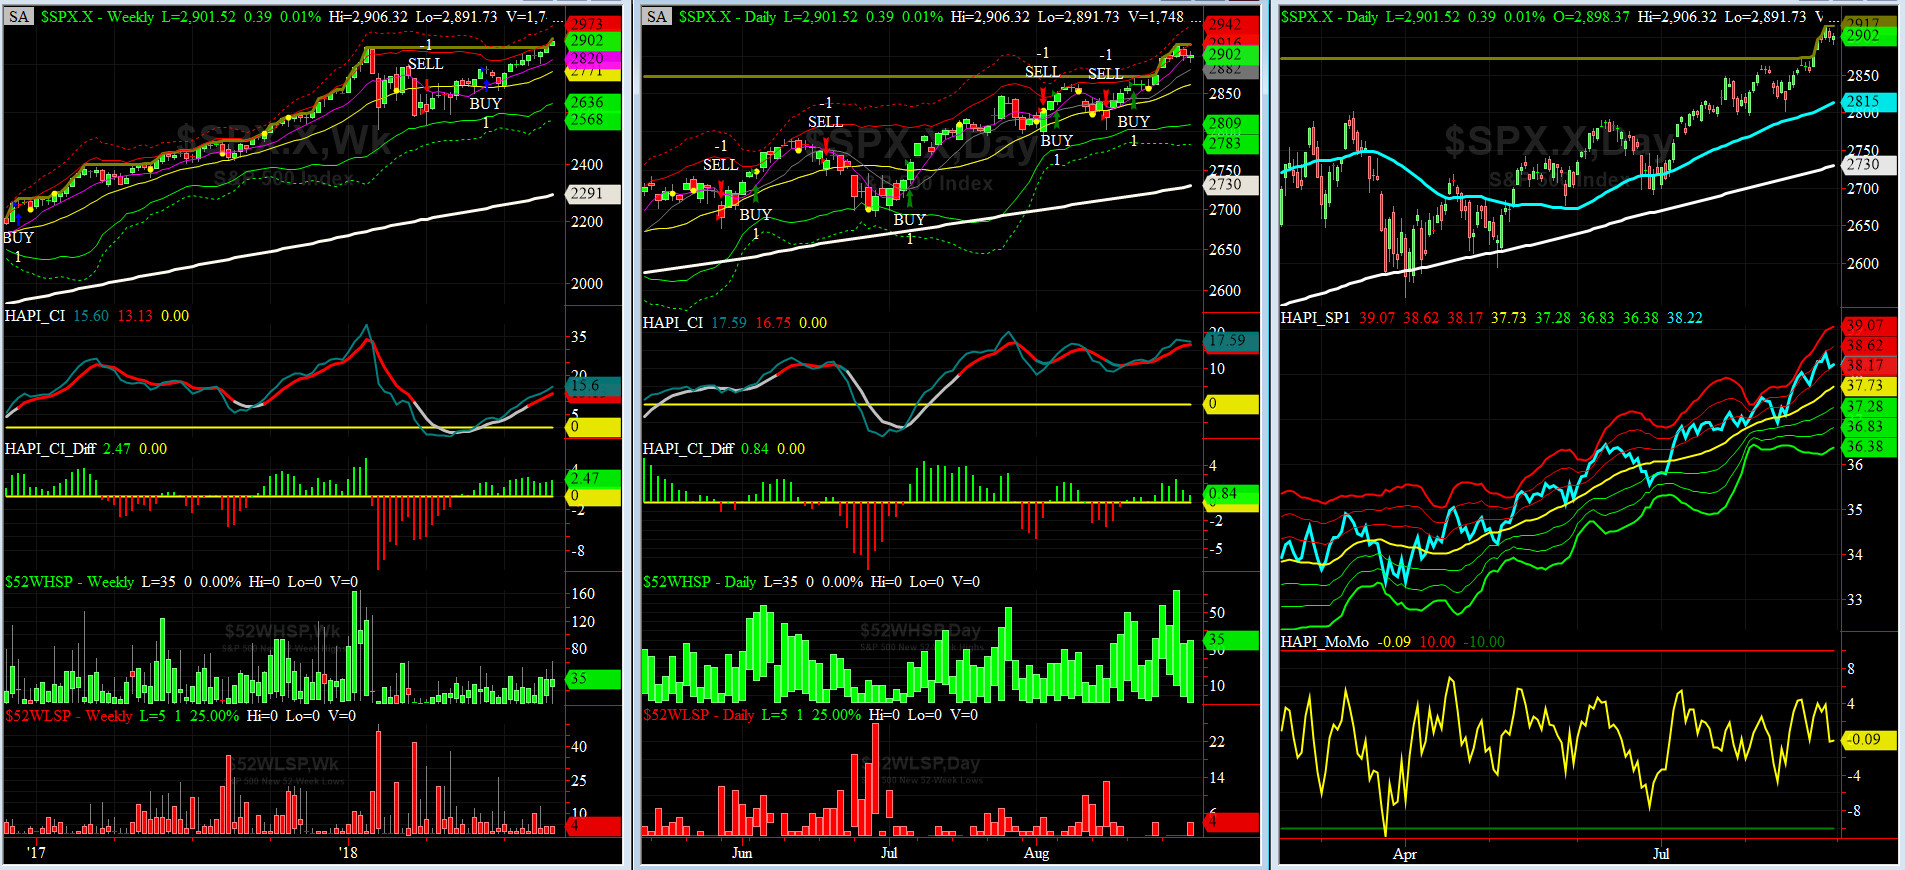
HA_SP1_Momo Chart
WEEKLY Timing Model = on a BUY Signal since Friday, June 15, 2018 CLOSE at 2779
DAILY Timing Model = on a BUY Signal since Tuesday, August 21, 2018 CLOSE at 2863
Max SPX 52wk-highs reading last week = 62 (over 120-140, the local maxima is in)
Max SPX 52wk-Lows reading last week = 4 (over 40-60, the local minima is in)
HA_SP1 closed just below its +1 sigma channels
HA_Momo = zero (reversals most likely occur above +10 or below -10)
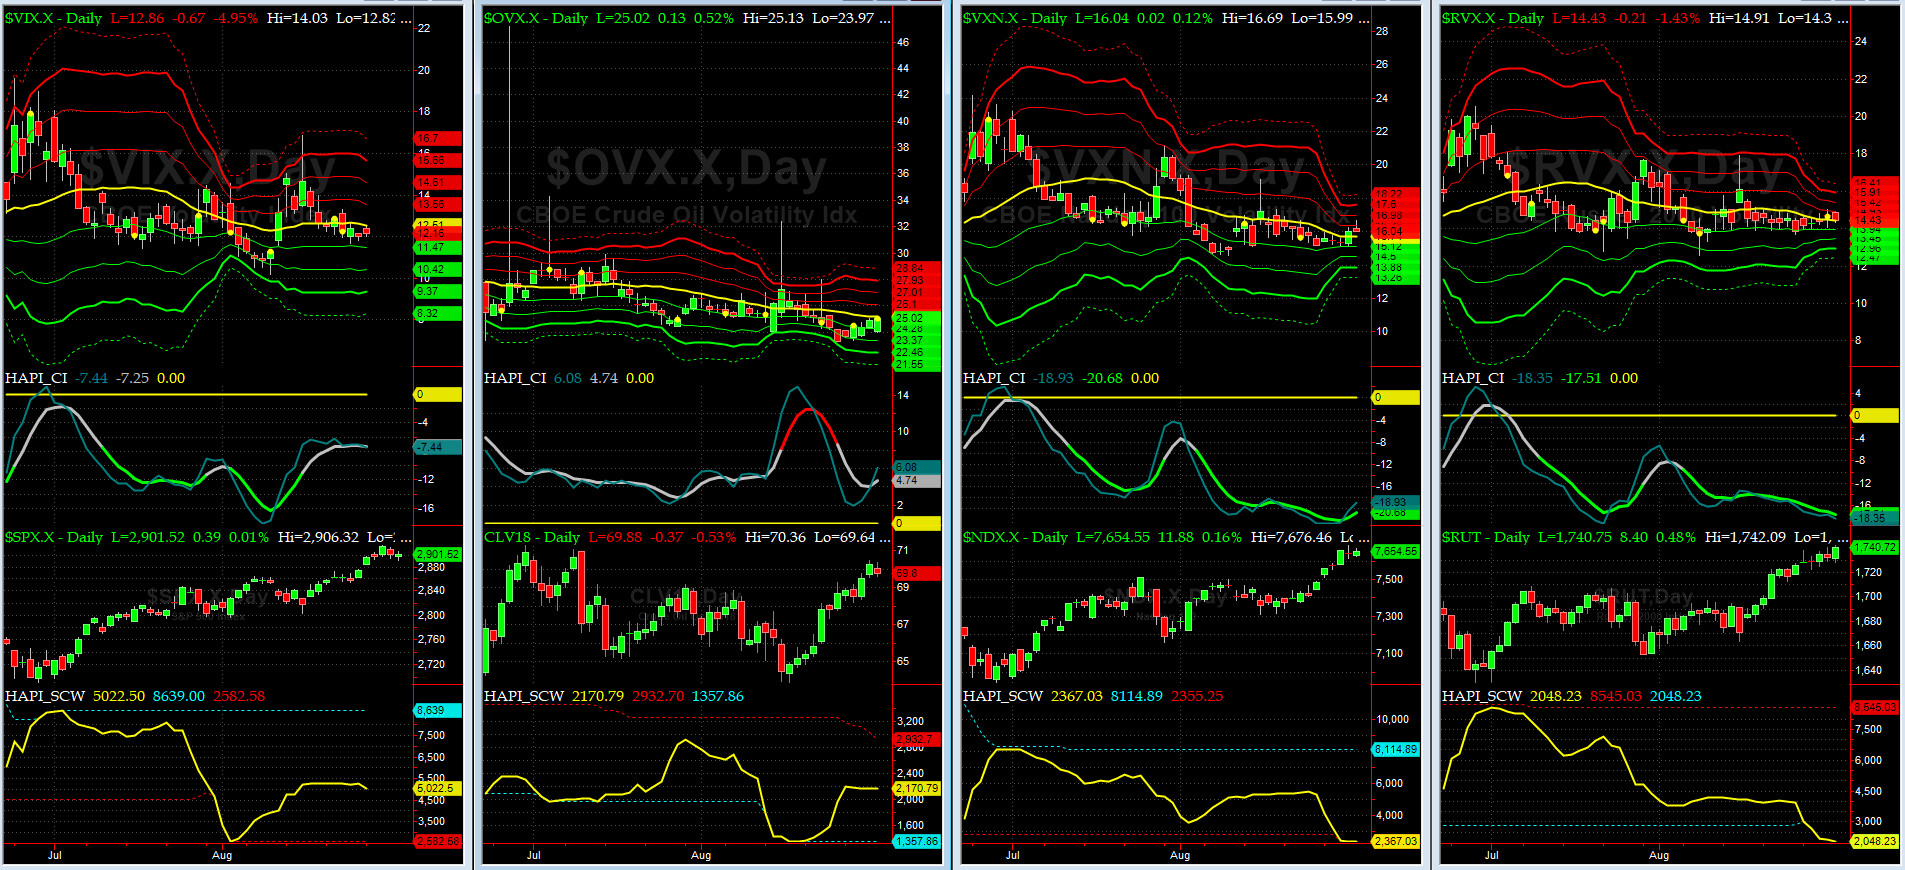
Vol of the Vols Chart
Spot VIX currently stands at 12.2, right about its -0.5 sigma (remember it's the VIX volatility pattern aka "its sigma channels" that matters, and not the level of VIX itself (this is per Dr. Robert Whaley, a great mentor and inventor of original VIX, now called VXO). VIX usually peaks around a test of its +4 sigma).
VIX was uber quiet this past week except on Tuesday.
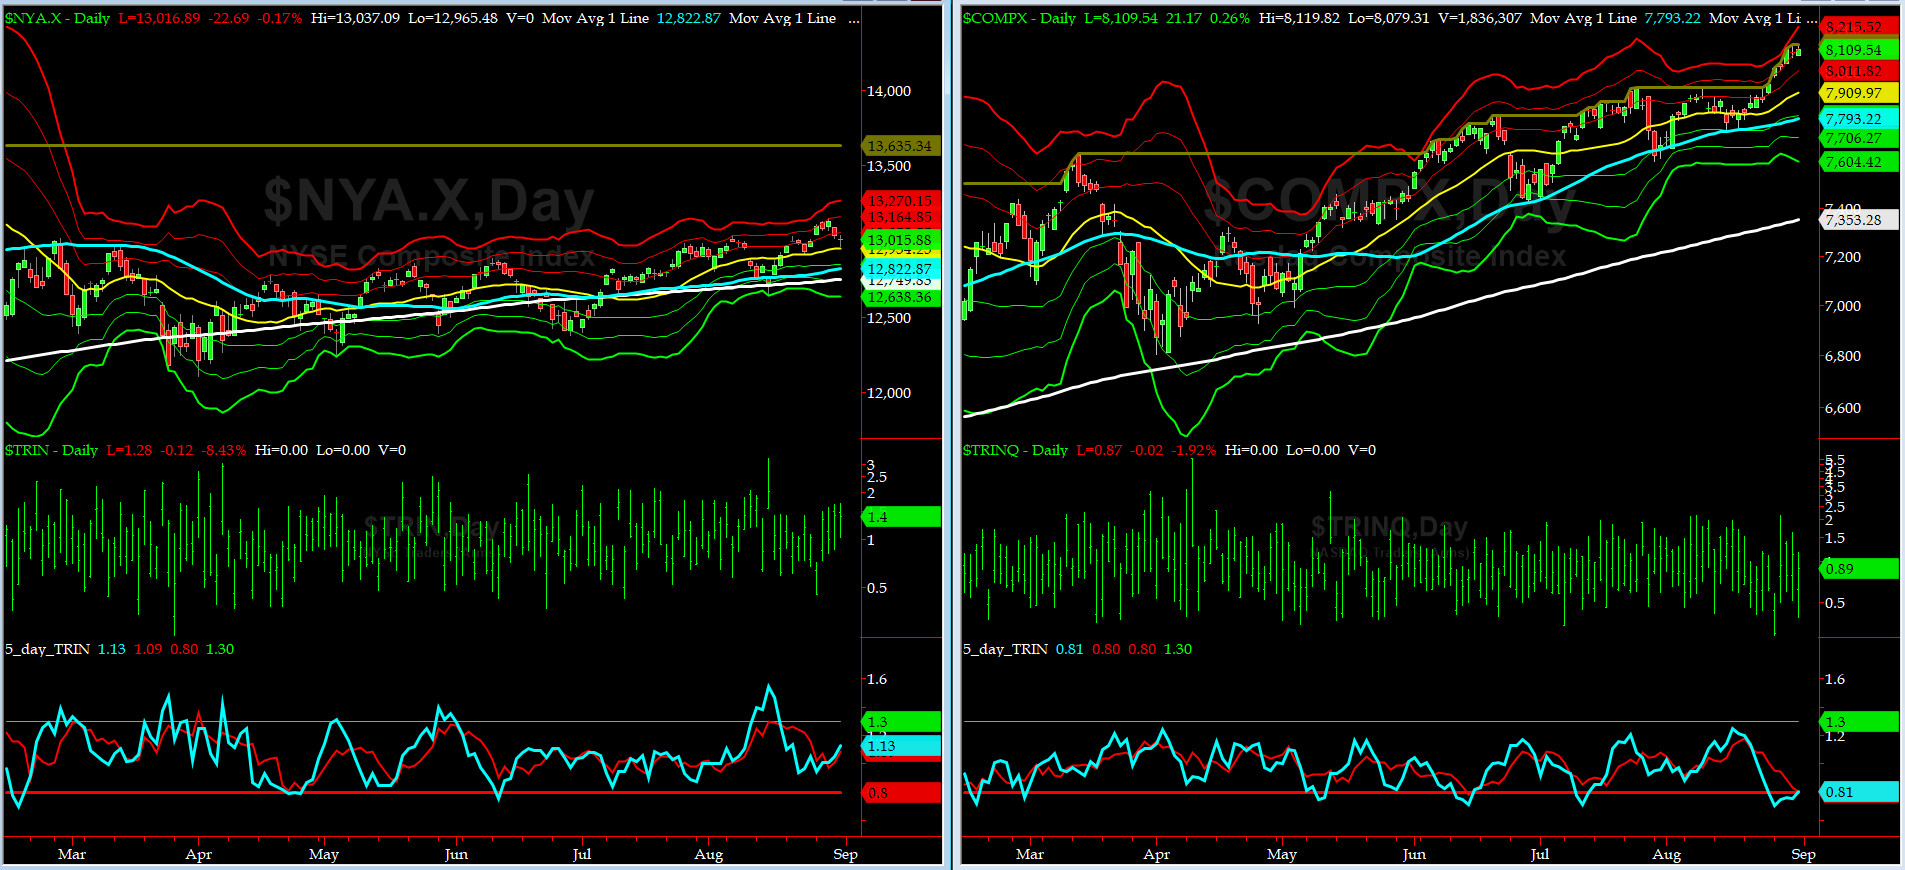
5-day TRIN & TRINQ Charts
Both NYSE 5-day TRIN & TRINQ (for NASDAQ) continue to remain in NEUTRAL & SELL zones, respectively.
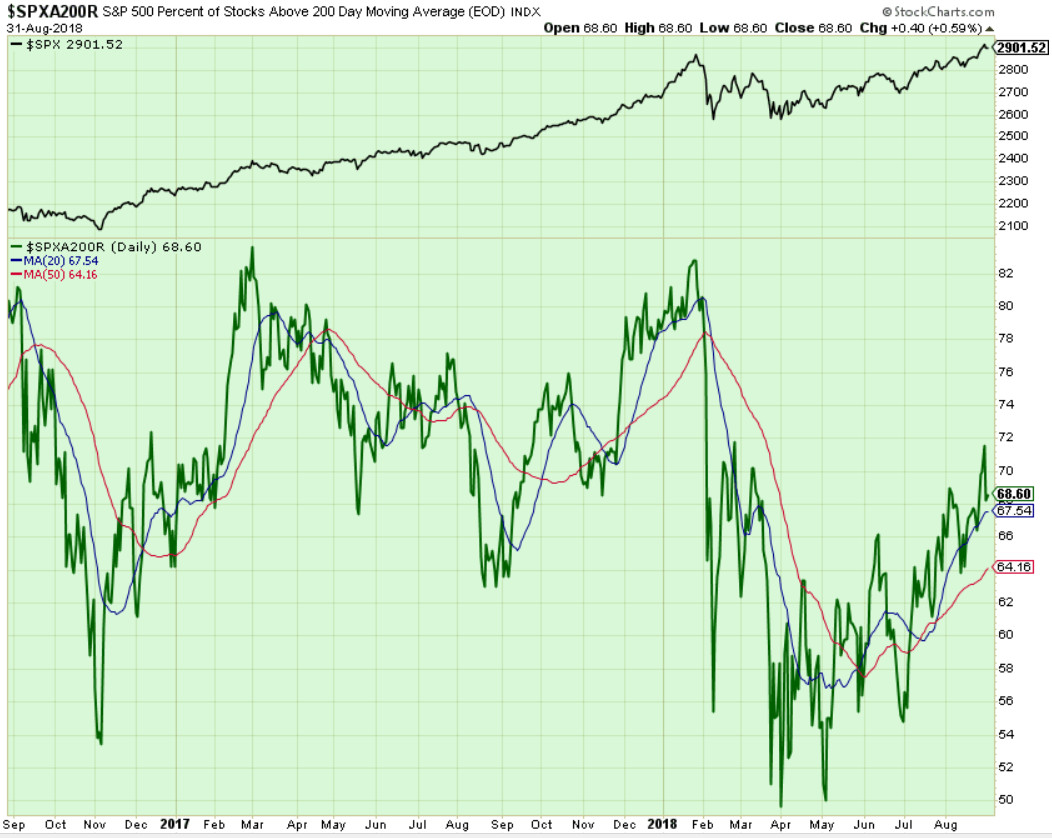
Components of SPX above their respective 200day MA Chart
On Wednesday, this scoring indicator rose to 72% but failed to hold it.
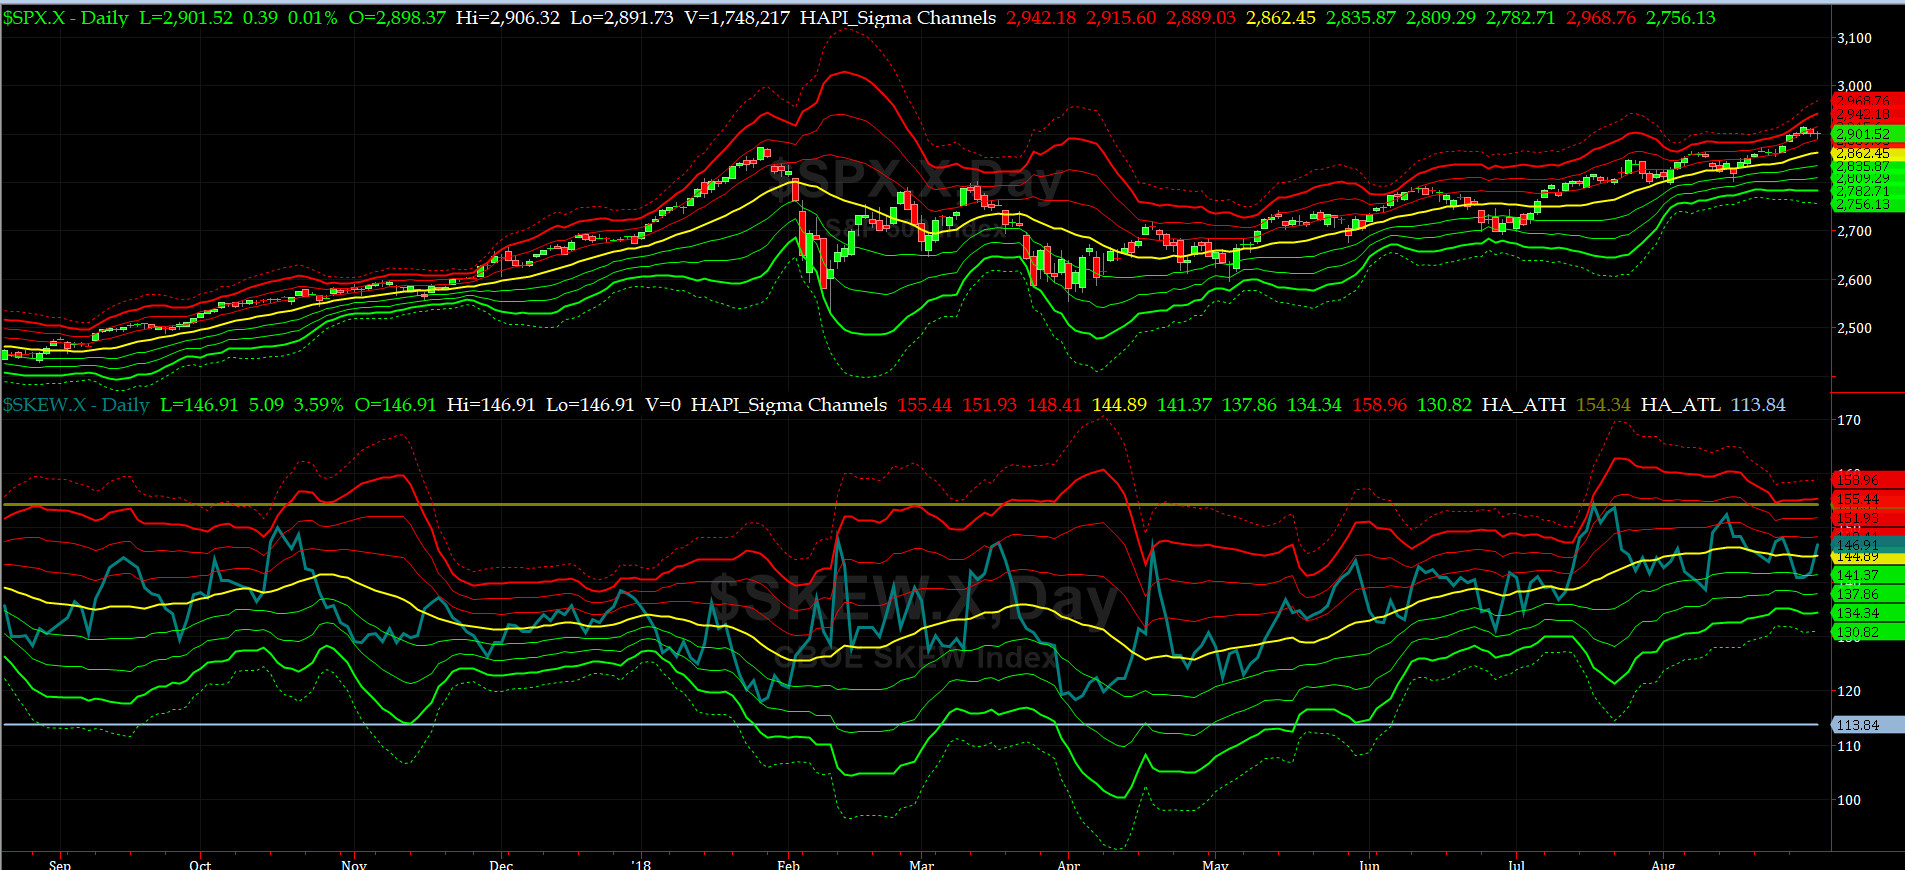
SPX SKEW (Tail Risk) Chart
On Friday, SPX SKEW (Tail Risk) closed near 147, a tad lower from its +1 sigma (normal = 120-125, range 100-150).
Is all quiet on the Eastern & Mid-Western Fronts? Our beloved @Capt_Tiko still says "maybe."
How to interpret the value of SPX SKEW? (from CBOE white paper on SKEW)


3-month VIX Futures Spread(VX) Chart
This popular timing indicator, (long Sep, & short Deez VIX Futures) is at -1.77. This reading is NEUTRAL.
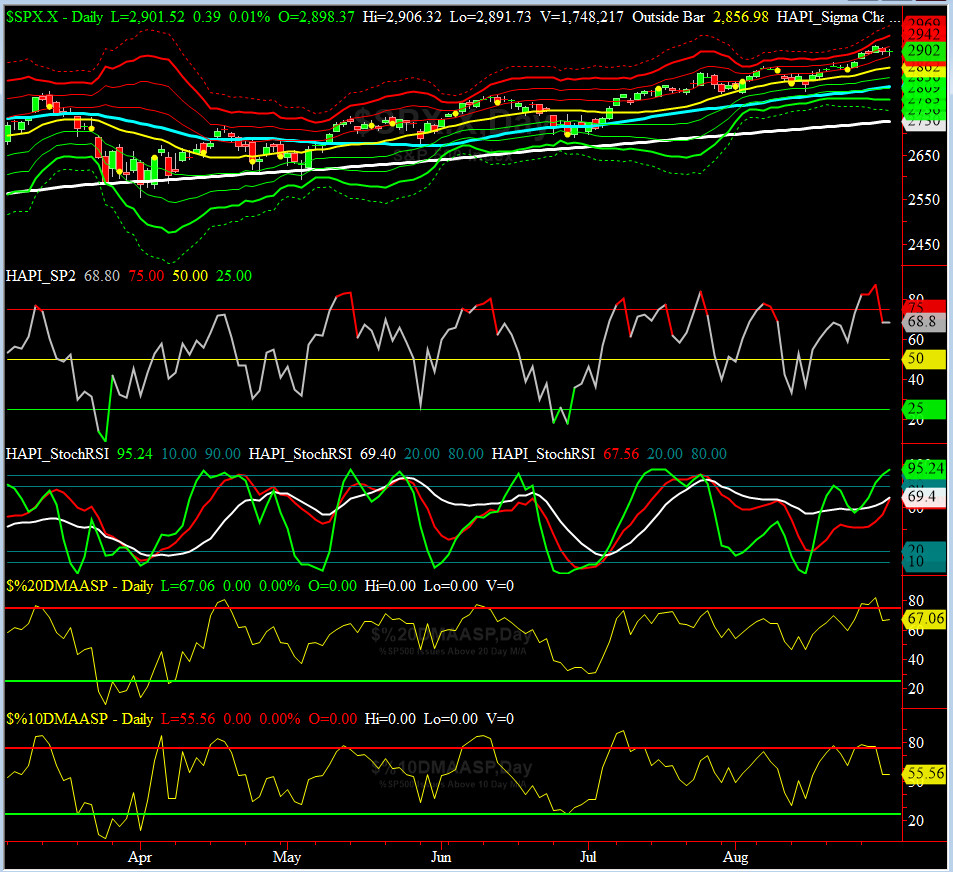
HA_SP2 Chart
HA_SP2 = 69 (Buy signal <= 25, Sell Signal >= 75)
Our coveted SP2 prop indicator rallied on Wednesday to almost 88 but closed the week almost 20 pts lower.
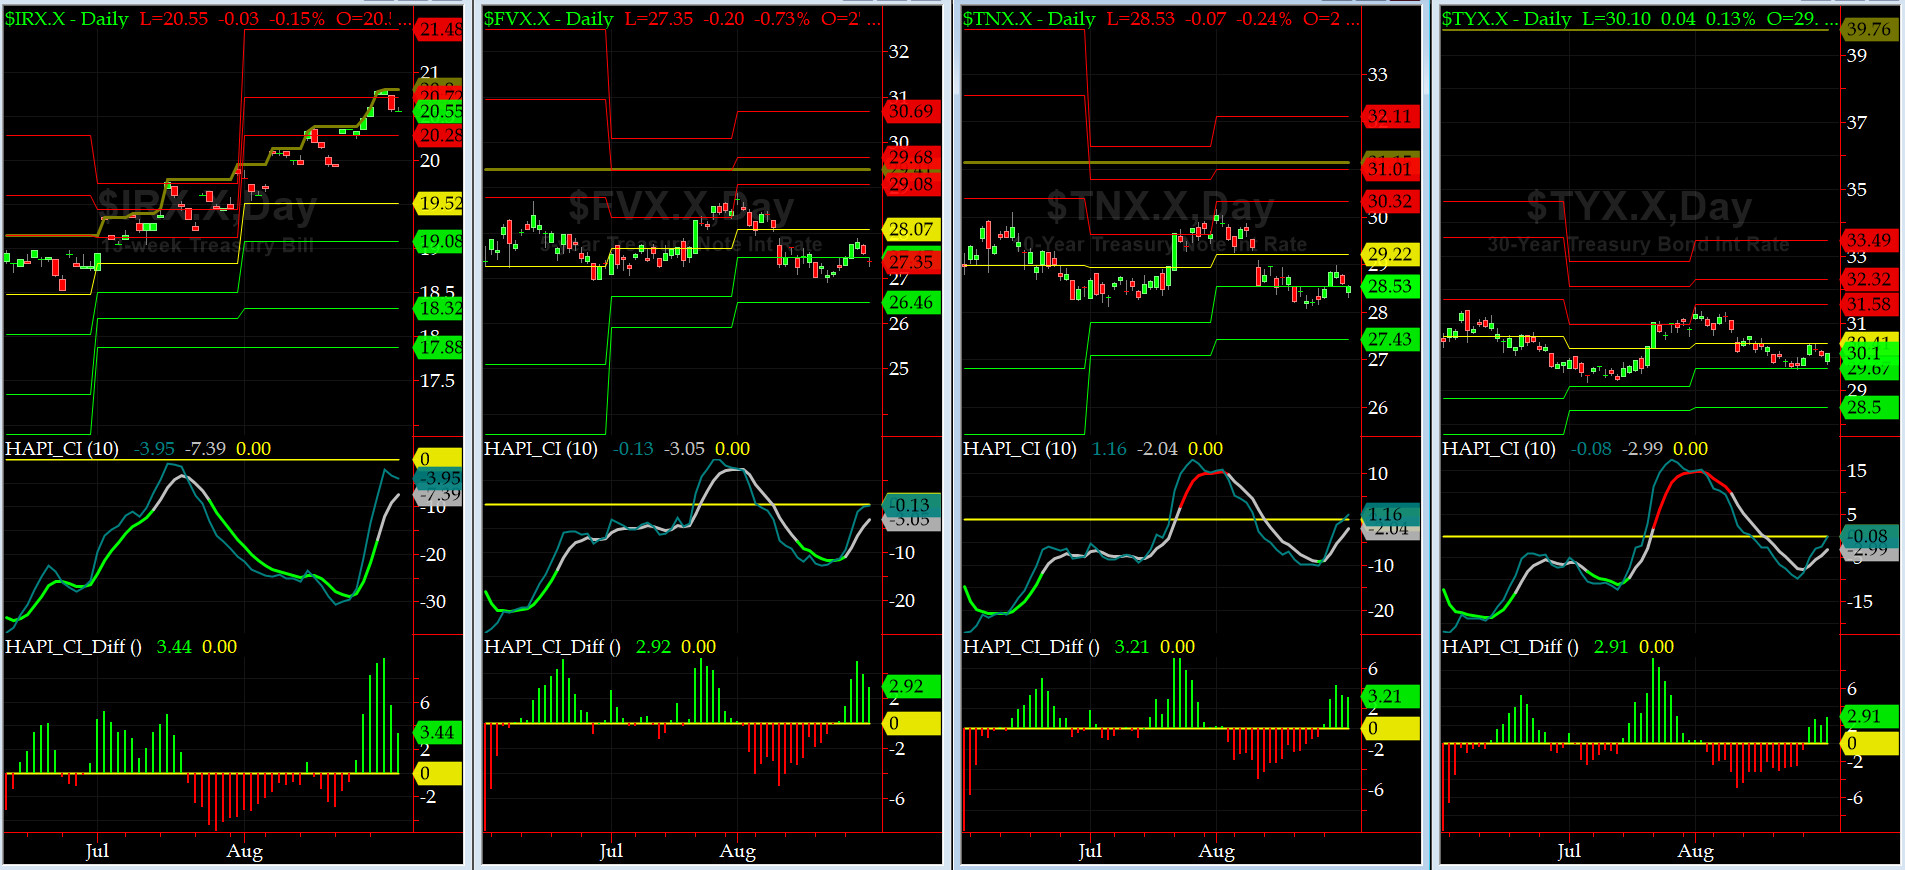
US Treasury T-Notes & T-Bonds Yields Chart
During this past week, the YTMs for the Notes & Bonds, upticked on Tuesday and Wednesday but then closed lower. Mrs Maury has to change her Rodeo Drive spending habits otherwise our beloved Maury is waist deep in trouble.
Fari Hamzei
|


 Proactive Market Timing


