|
Sunday, September 30th, 2018, 1345ET
Market Timing Charts, Analysis & Commentary for Issue #260

Timer Charts of S&P-500 Cash Index (SPX) + NASDAQ-100 Cash Index (NDX)
Most recent S&P-500 Cash Index (SPX): 2914 down -15 (down -0.51%) for the week ending on Friday, September 28, 2018, which closed just below its +1 sigma.
DJIA ALL TIME INTRADAY HIGH = 26743 (reached on Friday, September 21, 2018)
DJ TRAN ALL TIME INTRADAY HIGH = 11623 (reached on Friday, September 14, 2018)
SPX ALL TIME INTRADAY HIGH = 2941 (reached on Friday, September 21, 2018)
NDX ALL TIME INTRADAY HIGH = 7691 (reached on Thursday, August 30, 2018)
RUT ALL TIME INTRADAY HIGH = 1742 (reached on Friday, August 31, 2018)
Current DAILY +2 Sigma SPX = 2934 with WEEKLY +2 Sigma = 2939
Current DAILY 0 Sigma SPX = 2902 with WEEKLY 0 Sigma = 2806
Current DAILY -2 Sigma SPX = 2869 with WEEKLY -2 Sigma = 2673
NYSE McClellan Oscillator = -51 (-150 is start of the O/S area; around -275 to -300 area or lower, we go into the �launch-pad� mode; over +150, we are in O/B area)
NYSE Breadth Thrust = 47.4 (40 is considered as oversold and 65 as overbought)
Another tough week for the market: courtesy of FOMC and the Circus (aka Senate Judiciary Committee) no matter which side one takes. Our beloved Capt Tiko was correct, again !!!
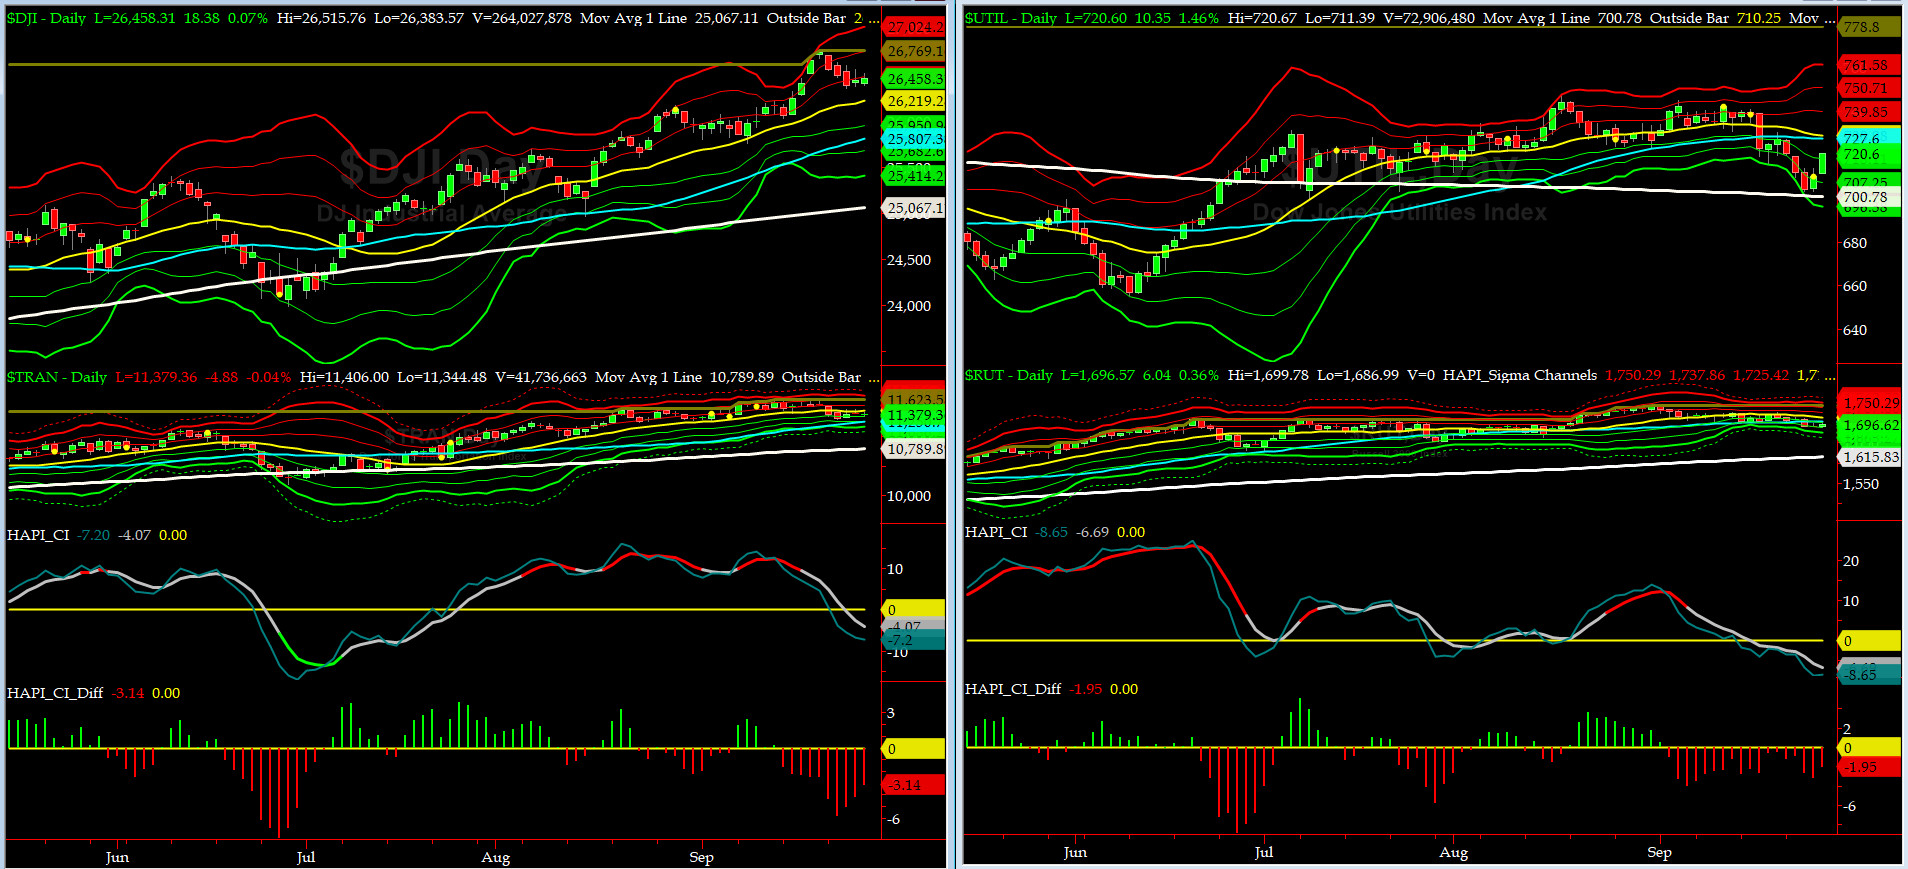
Canaries [in the Coal Mine] Chart for DJ TRAN & RUT Indices
200-Day MA DJ TRAN = 10,789 or 5.5% below DJ TRAN (max observed in last 7 yrs = 20.2%, min = -20.3%)
200-Day MA RUT = 1615 or 5.0% below RUT (max observed in last 7 yrs = 21.3%, min = -22.6%)
DJ Transportation Index (proxy for economic conditions 6 to 9 months hence) after a huge move on Monday & Tuesday, DJ Trans went nowhere fast.
Russell 2000 Small Caps Index (proxy for Risk ON/OFF) sold off hard on FOMC (last Wednesday) and broke its 50day MA. Is RISK still on, we think so (but the KoolAid mix could be under review....LOL).
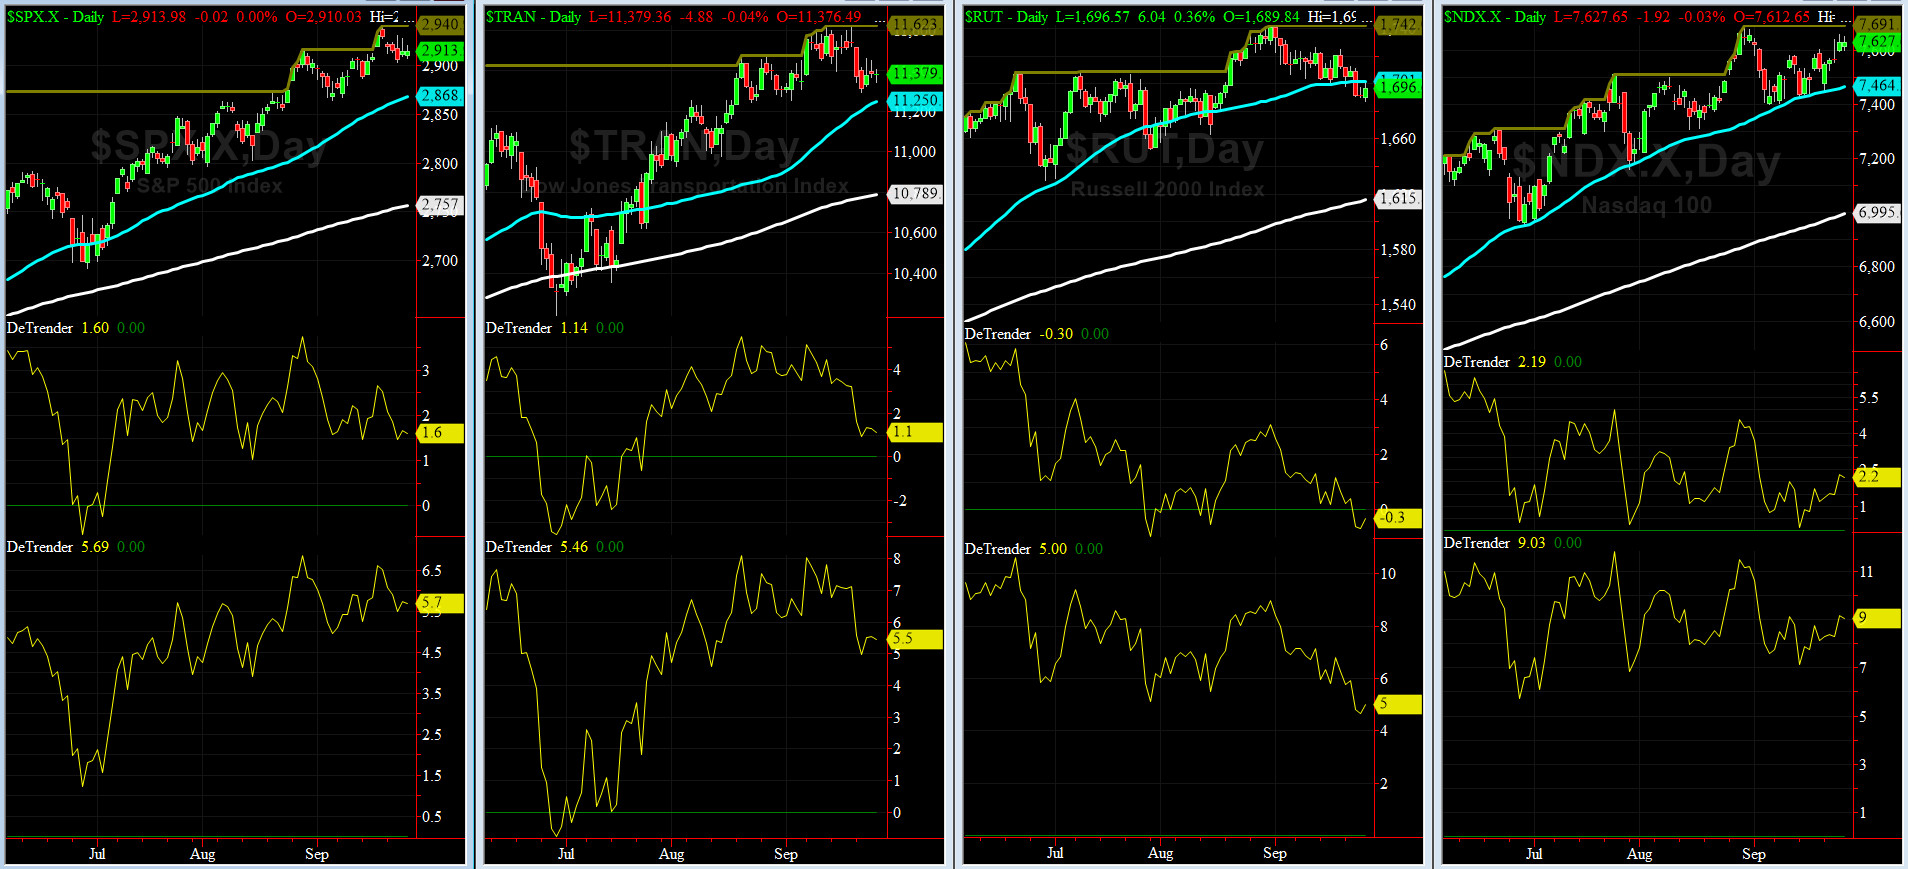
DeTrenders Charts for SPX, NDX, TRAN & RUT Indices
50-Day MA SPX = 2868 or 1.6% below SPX (max observed in last 7 yrs = +8.6%, min = -9.3%)
200-Day MA SPX = 2757 or 5.7% below SPX (max observed in last 7 yrs = 15.2%, min = -14%)
SEVEN of our EIGHT DeTrenders are in POSITIVE territory. The DeTrenders for DJ Tran & RUT will continue to be harbingers of future price behavior in broad indices.

HA_SP1_Momo Chart
WEEKLY Timing Model = on a BUY Signal since Friday, June 15, 2018 CLOSE at 2779
DAILY Timing Model = on a BUY Signal since Friday, September 14, 2018 CLOSE at 2872
Max SPX 52wk-highs reading last week = 30 (over 120-140, the local maxima is in)
Max SPX 52wk-Lows reading last week = 18 (over 40-60, the local minima is in)
HA_SP1 closed at its +0.5 sigma channels
HA_Momo = -2.2 (reversals most likely occur above +10 or below -10)
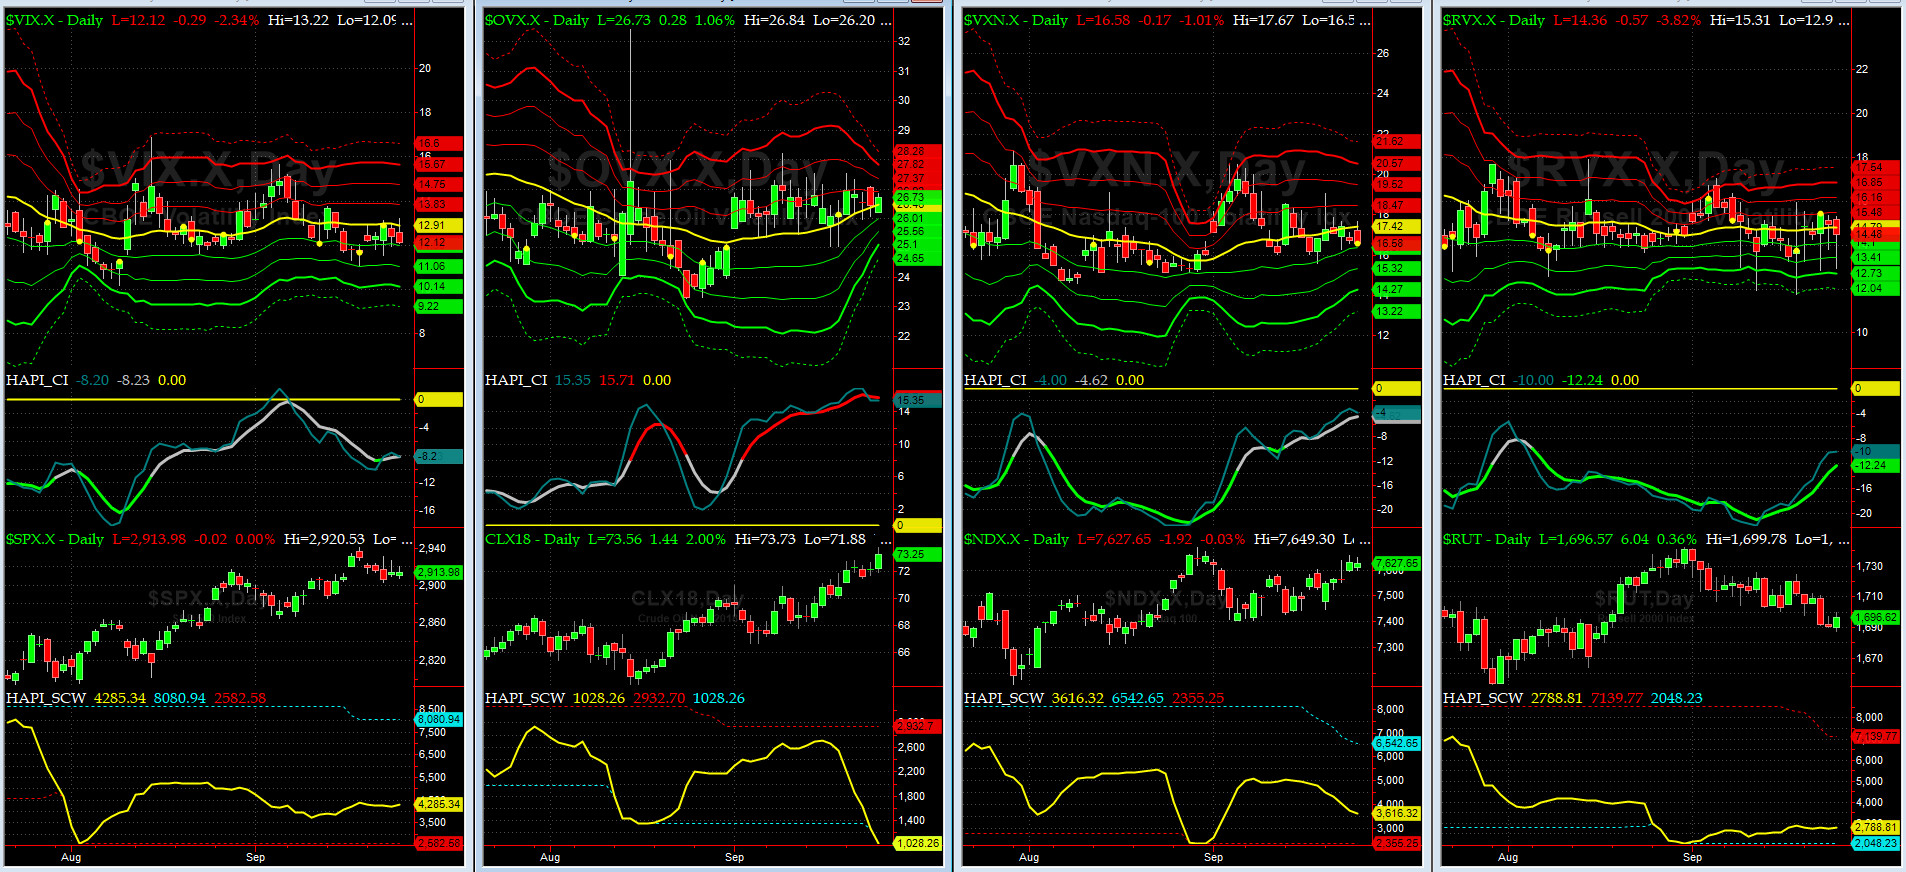
Vol of the Vols Chart
Spot VIX currently stands at 12.1, right about its -0.5 sigma (remember it's the VIX volatility pattern aka "its sigma channels" that matters, and not the level of VIX itself (this is per Dr. Robert Whaley, a great mentor and inventor of original VIX, now called VXO). VIX usually peaks around a test of its +4 sigma).
VIX went sideway this past week......look for a test of Spot VIX at 11.
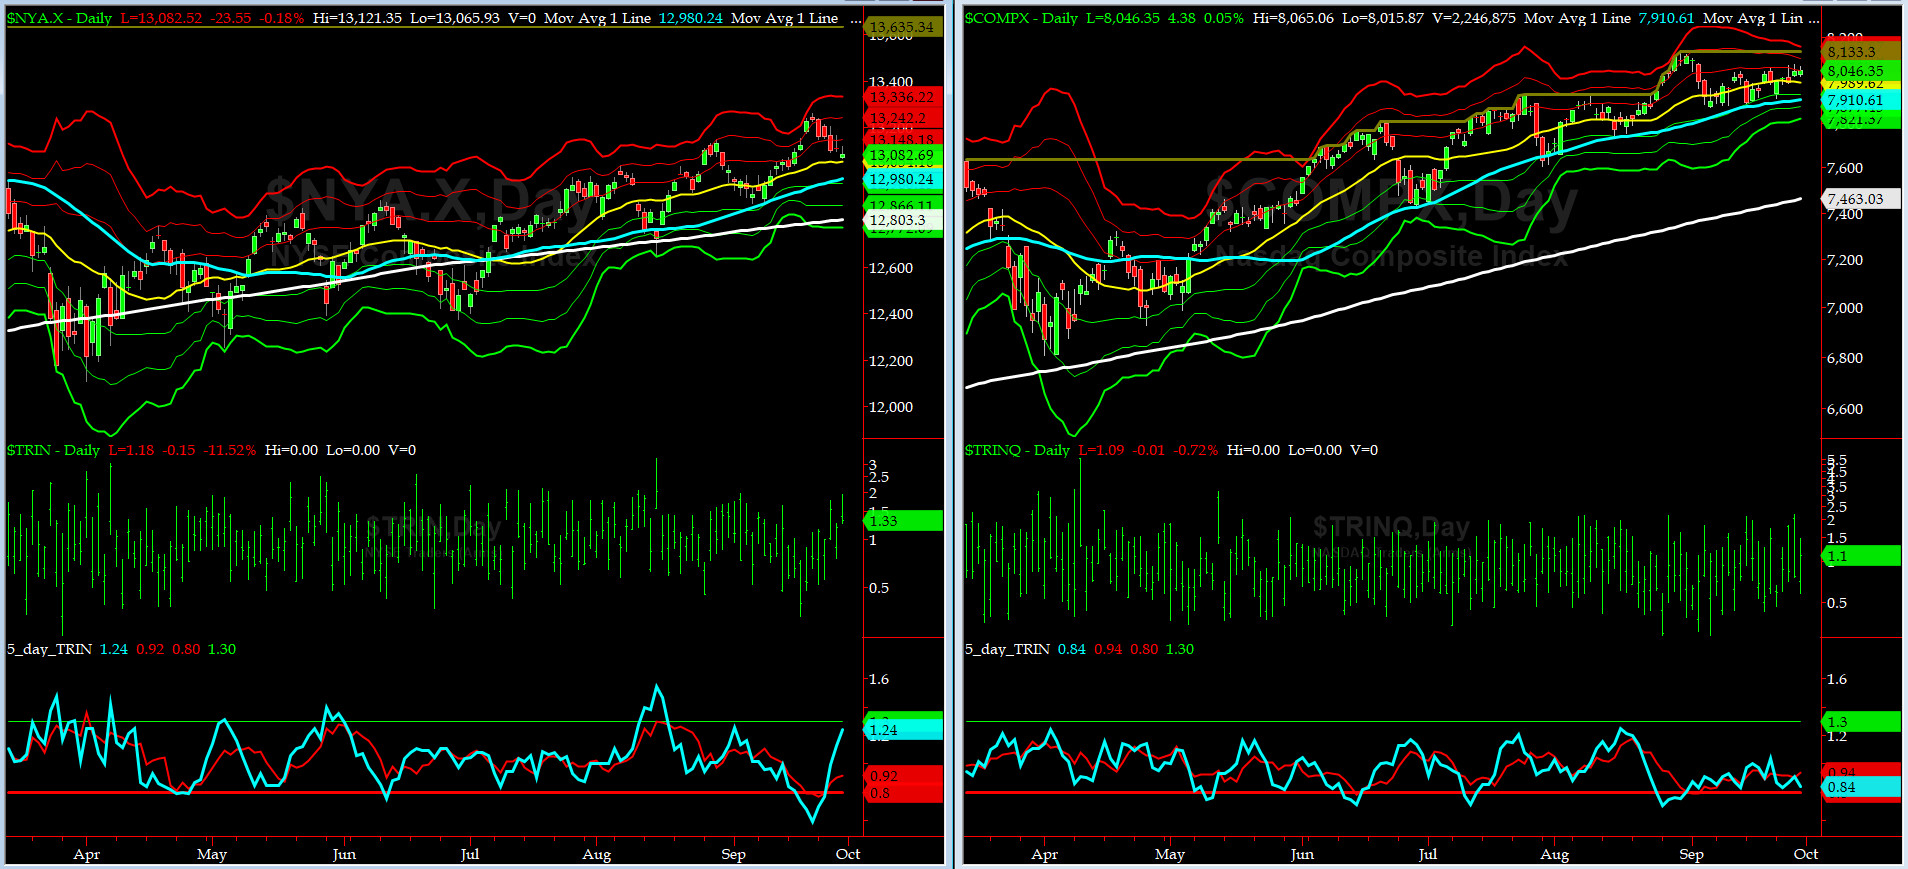
5-day TRIN & TRINQ Charts
NYSE 5-day TRIN is in **uber** OverSold zone while TRINQ (for NASDAQ) is near OverBought.... note: we have never seen this before.

Components of SPX above their respective 200day MA Chart
This scoring indicator had a huge drop to 64% this past week after a huge run-up in the prior week. Was that a Bull Trap? only time will tell.
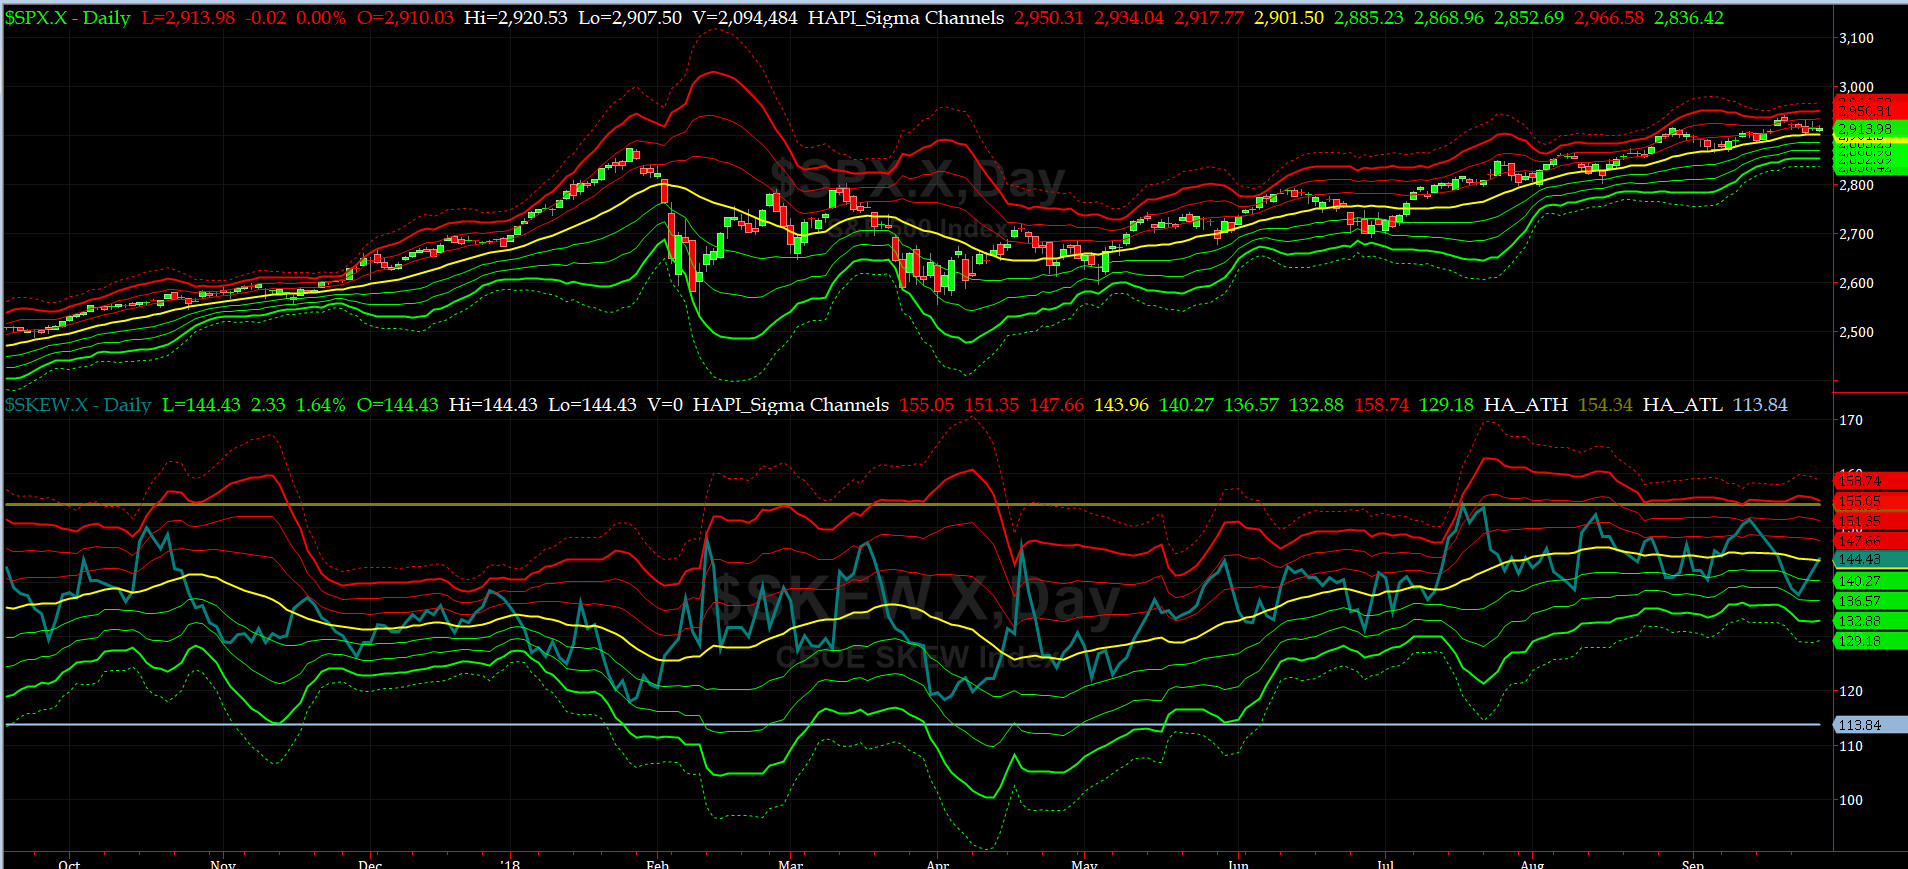
SPX SKEW (Tail Risk) Chart
On Friday, SPX SKEW (Tail Risk) closed near 144.8, a tad below its zero sigma (normal = 120-125, range 100-150).
Is all quiet on the Eastern & Mid-Western Fronts? Our beloved @Capt_Tiko said "maybe...." last week, but by Friday close, after a two sigma run-up, now says: all bets are off. Go figure (reminder: note his track record first before any actionable trade)!!
How to interpret the value of SPX SKEW? (from CBOE white paper on SKEW)

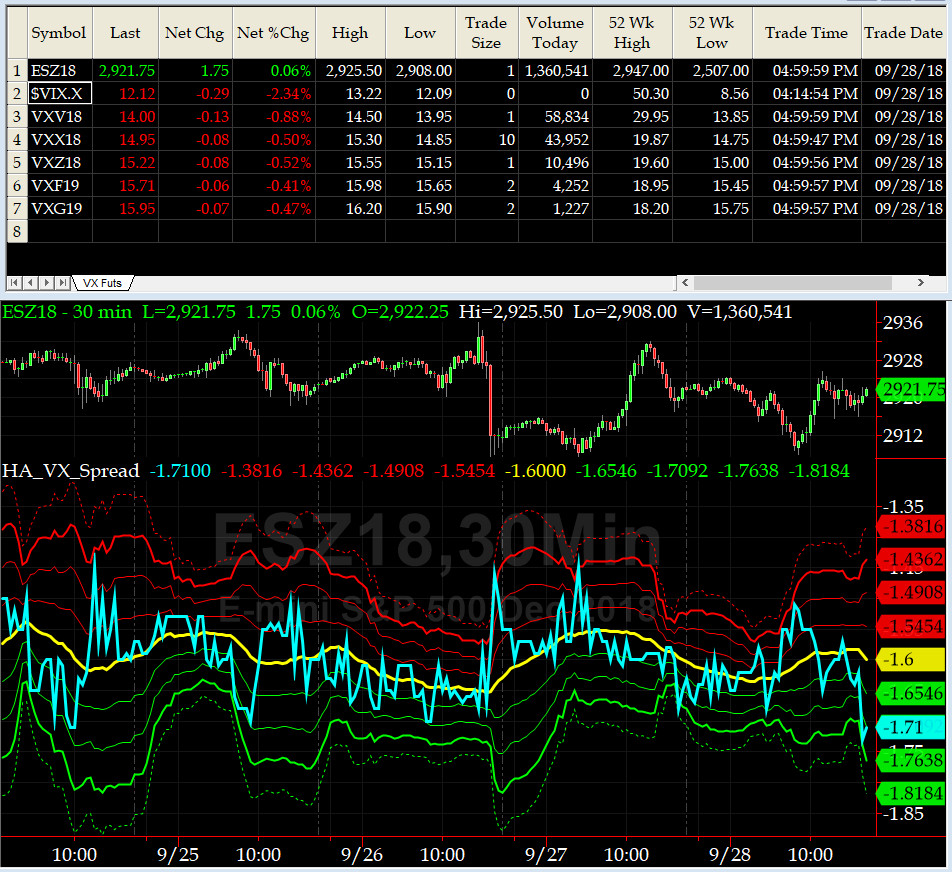
3-month VIX Futures Spread(VX) Chart
This popular timing indicator, (long OCT18, & short JAN19 VIX Futures) closed at -1.71. This reading remains in NEUTRAL zone.
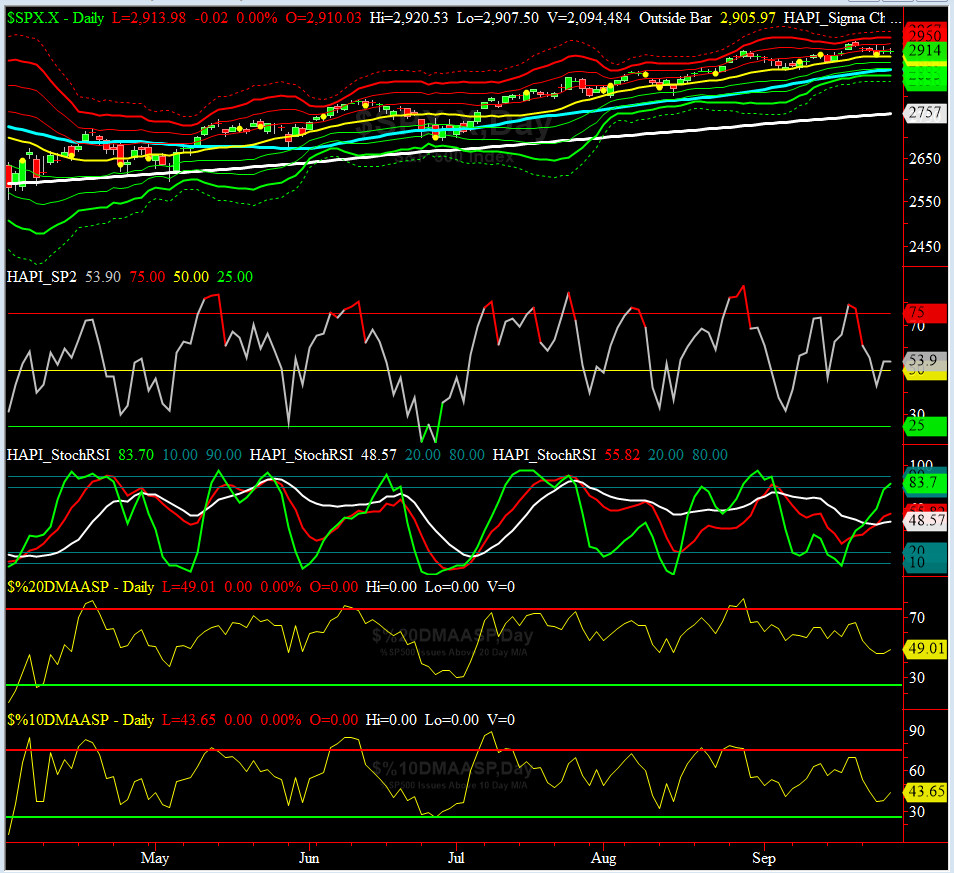
HA_SP2 Chart
HA_SP2 = 53.9 (Buy signal <= 25, Sell Signal >= 75)
Our coveted SP2 prop indicator has now entered its NEUTRAL zone after a huge drop midweek (post FOMC).
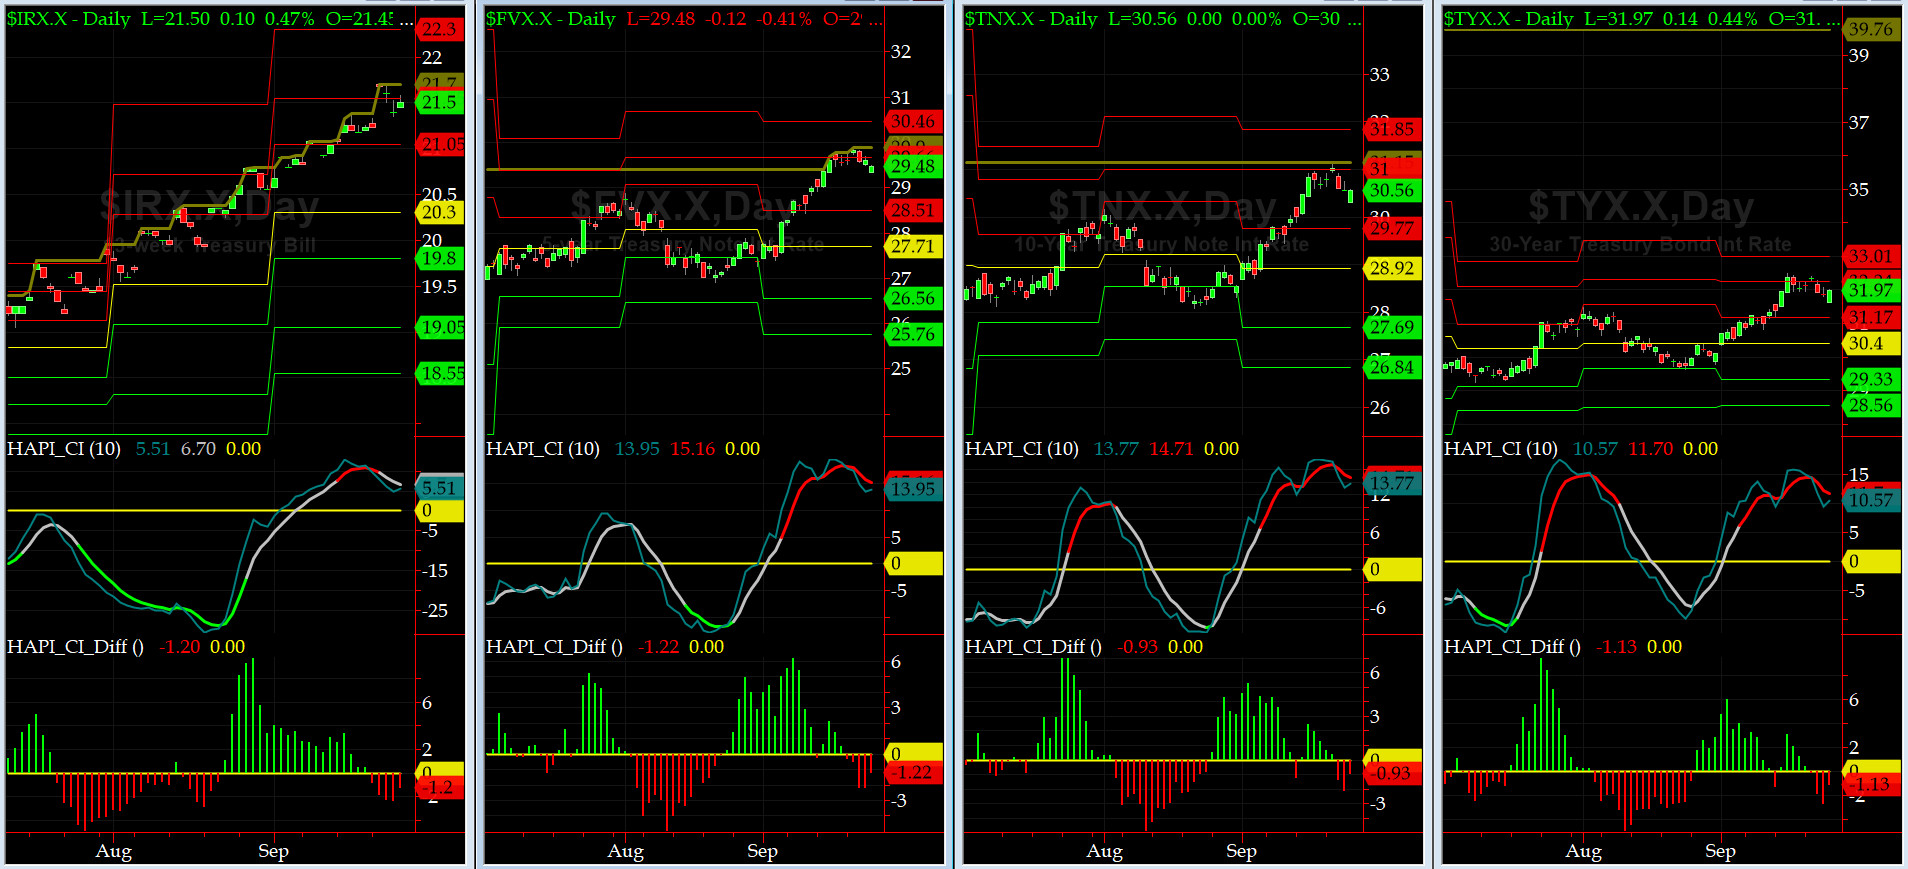
US Treasury T-Notes & T-Bonds Yields Chart
This past week all YTMs pulled back after 5 & 10 yr T-Notes hit their 7-yr highs (which we have highlighted here for months now).
Fari Hamzei
|


 Proactive Market Timing


