|
Saturday, October 27, 2018, 1845ET
Market Timing Charts, Analysis & Commentary for Issue #264
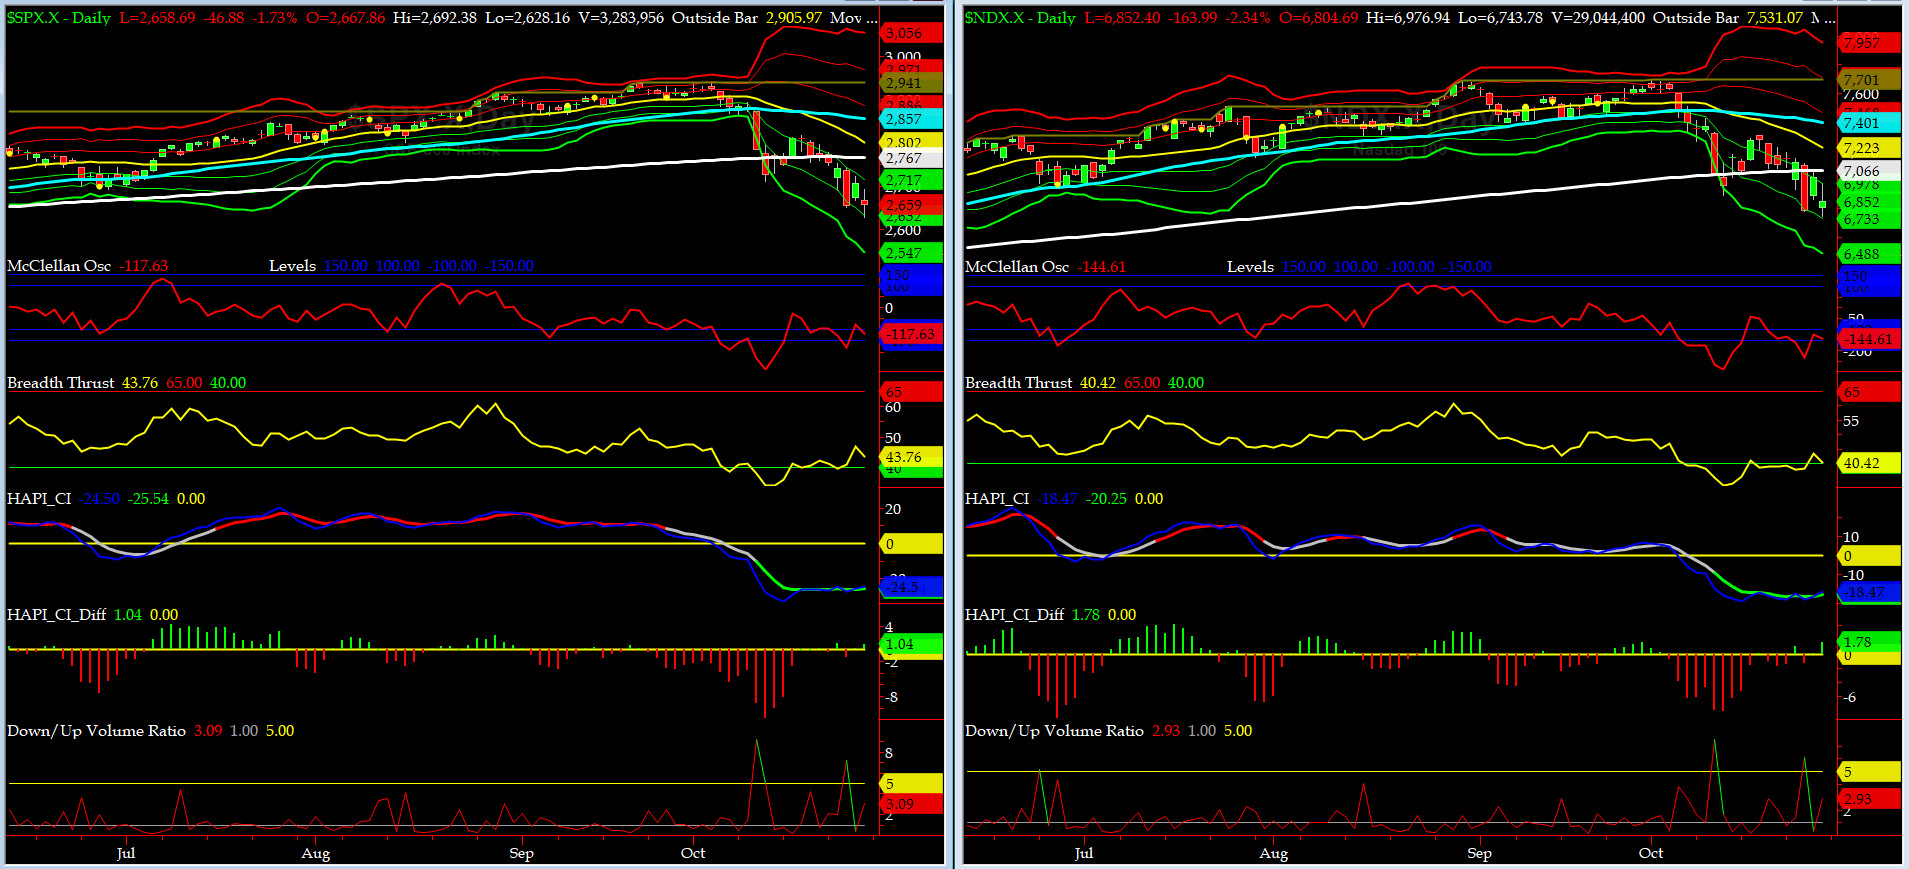
Timer Charts of S&P-500 Cash Index (SPX) + NASDAQ-100 Cash Index (NDX)
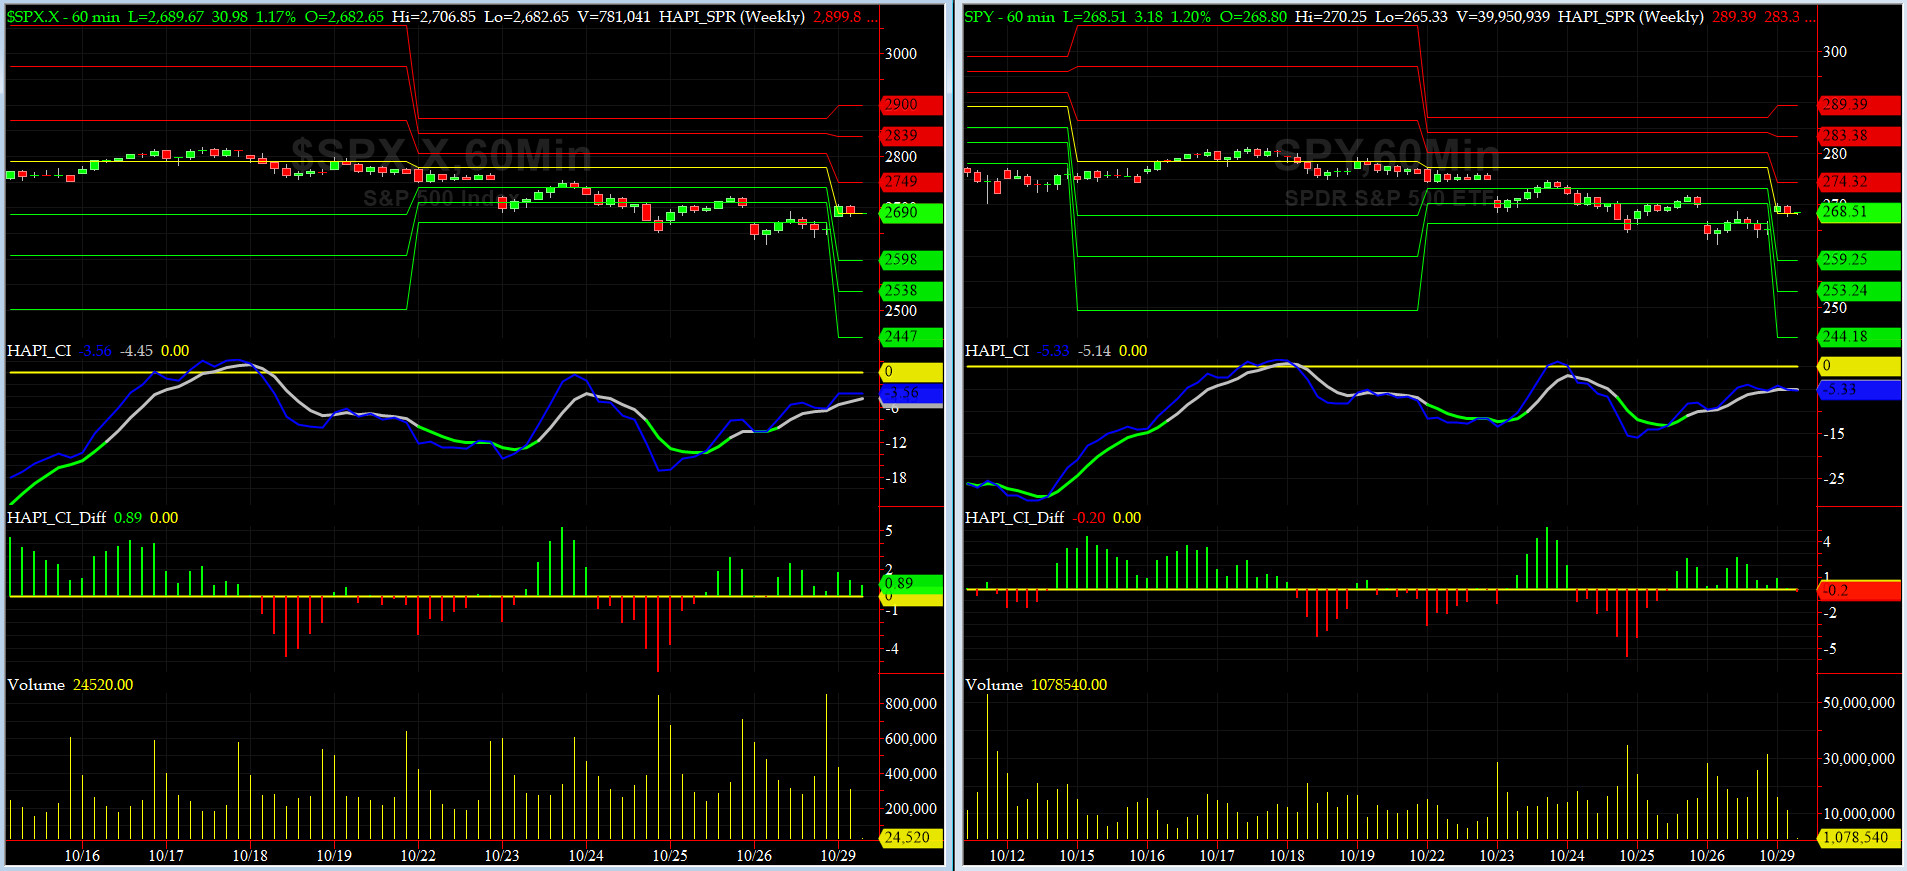
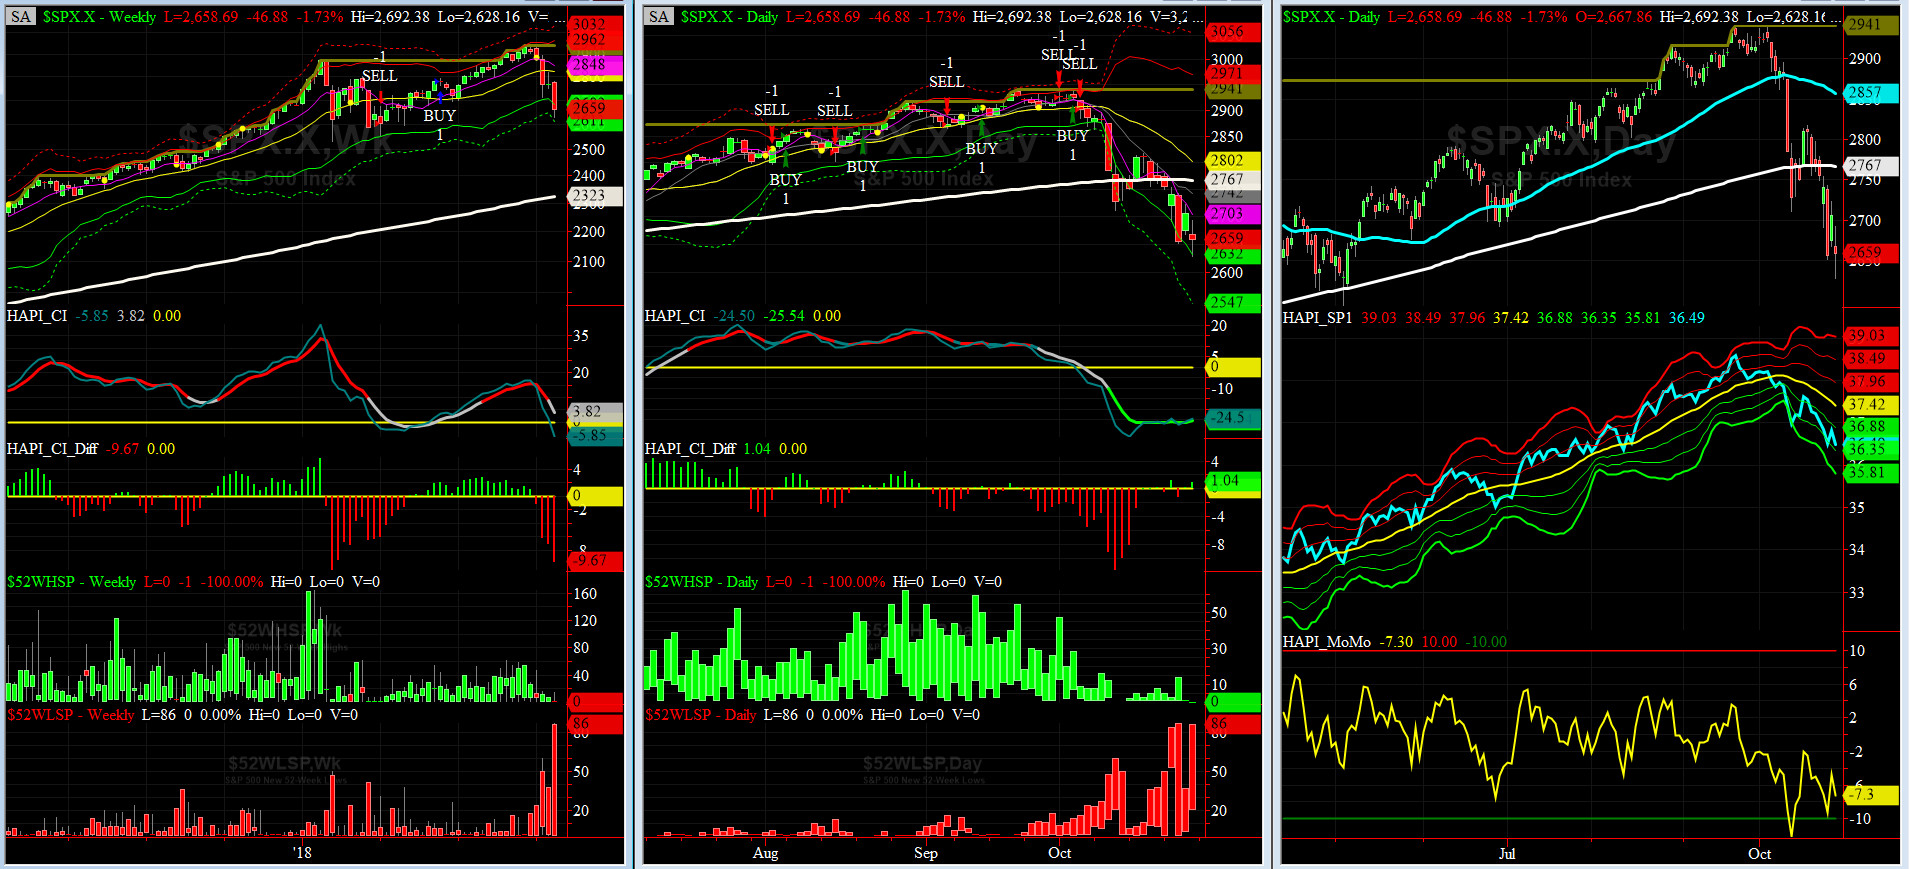
Most recent S&P-500 Cash Index (SPX): 2658 down -110 (down -3.97%) for the week ending on Friday, October 26, 2018, which closed just about its -1.5 sigma.
DJIA ALL TIME INTRADAY HIGH = 26951 (reached on Wednesday, October 3, 2018)
DJ TRAN ALL TIME INTRADAY HIGH = 11623 (reached on Friday, September 14, 2018)
SPX ALL TIME INTRADAY HIGH = 2941 (reached on Friday, September 21, 2018)
NDX ALL TIME INTRADAY HIGH = 7700 (reached on Thursday, October 1, 2018)
RUT ALL TIME INTRADAY HIGH = 1742 (reached on Friday, August 31, 2018)
Current DAILY +2 Sigma SPX = 2971 with WEEKLY +2 Sigma = 2962
Current DAILY 0 Sigma SPX = 2802 with WEEKLY 0 Sigma = 2822
Current DAILY -2 Sigma SPX = 2632 with WEEKLY -2 Sigma = 2682
NYSE McClellan Oscillator = -117 (-150 is start of the O/S area; around -275 to -300 area or lower, we go into the �launch-pad� mode; over +150, we are in O/B area)
NYSE Breadth Thrust = 43.8 (40 is considered as oversold and 65 as overbought)
Wednesday & Friday were two big negative days last week. In addition to political terrorism unleashed by an ardent & down-and-out Grumpino supporter, Alphabet & Amazon revenue misses dampened the investors' mood. Now all eyes are on Nov 1st when AAPL reports. All others things being equal, most likely, we will stay short this coming week and we should even take out last February lowest Close of SPX at 2619. In that event, the next SPX target could be the 2540-2470 area.
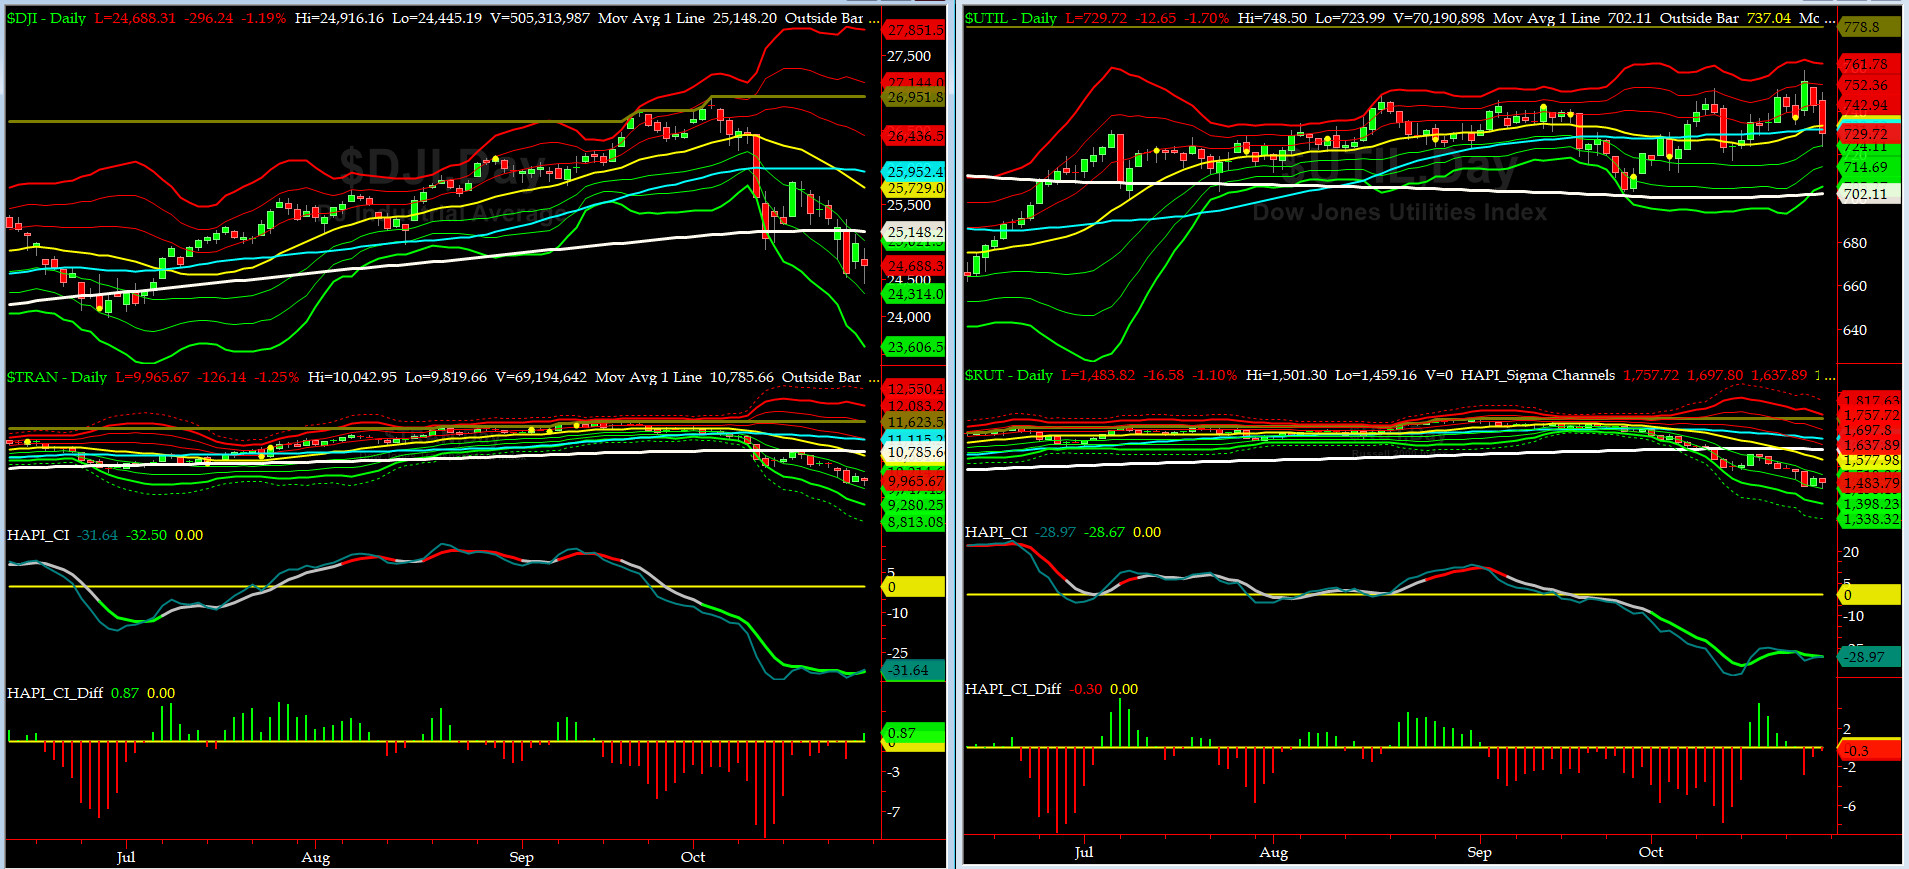
Canaries [in the Coal Mine] Chart for DJ TRAN & RUT Indices
200-Day MA DJ TRAN = 10,785 or 7.6% ABOVE DJ TRAN (max observed in last 7 yrs = 20.2%, min = -20.3%)
200-Day MA RUT = 1618 or 8.3% ABOVE RUT (max observed in last 7 yrs = 21.3%, min = -22.6%)
DJ Transportation Index (proxy for economic conditions 6 to 9 months hence) had another horrible week.
Russell 2000 Small Caps Index (proxy for Risk ON/OFF) did even worse. Wednesday was a very bad for both of these indices. RISK is OFF.
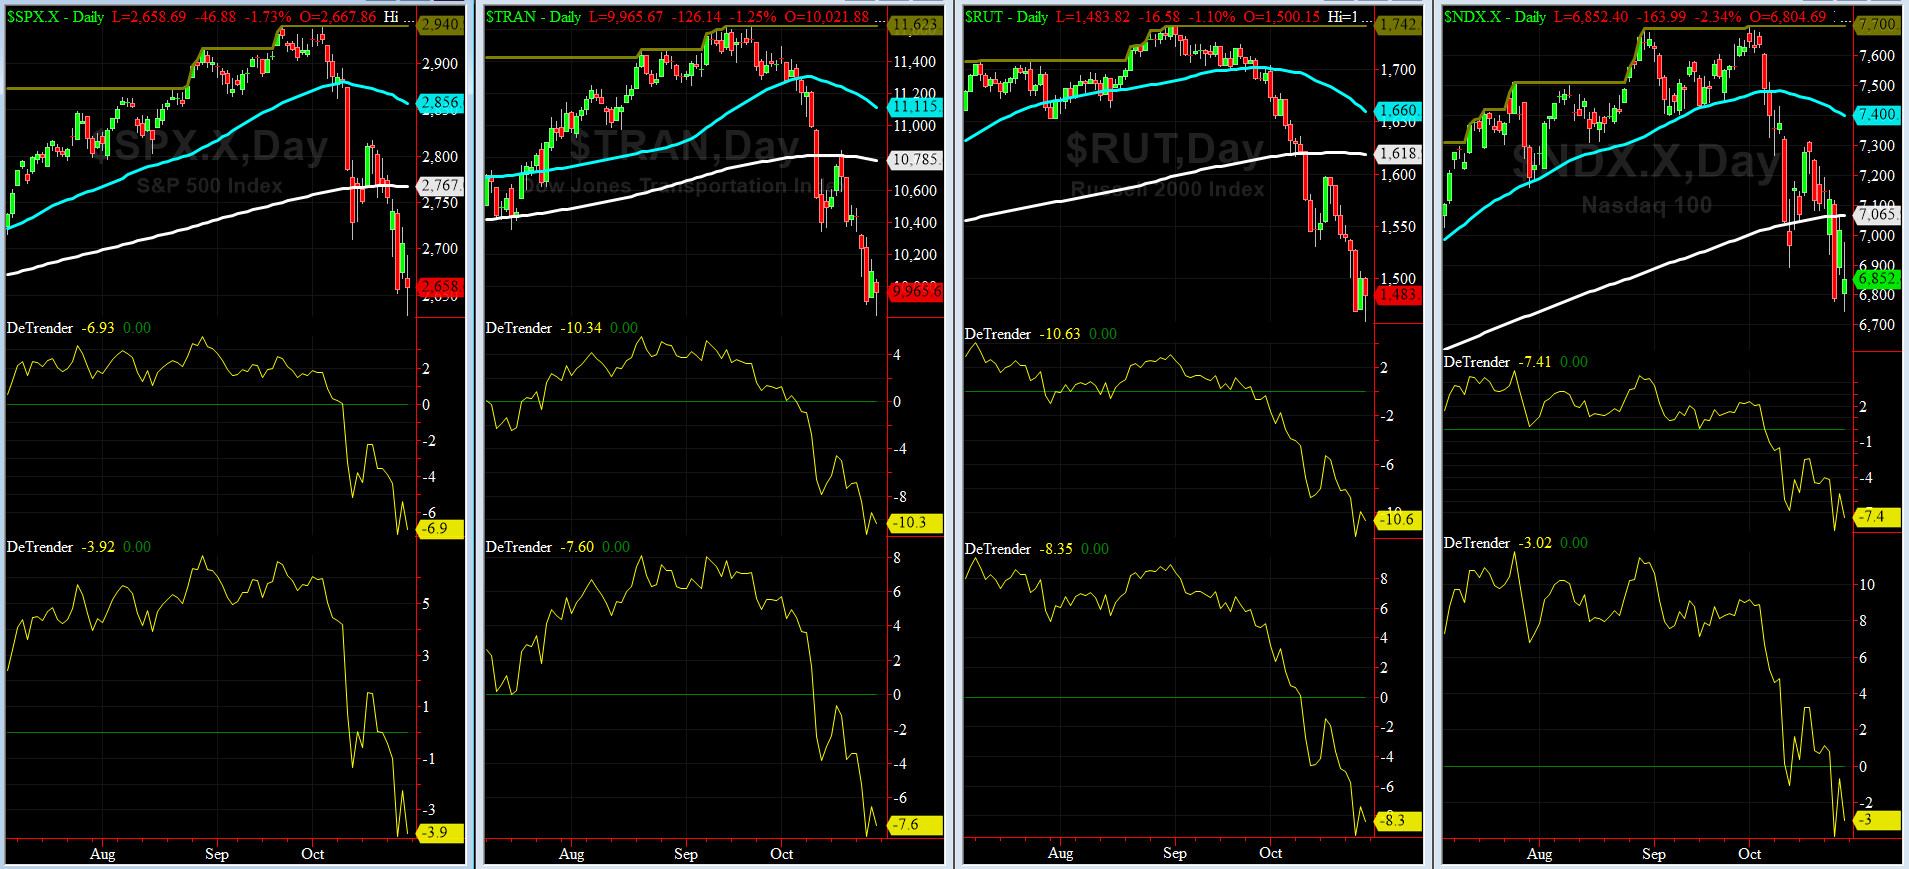
DeTrenders Charts for SPX, NDX, TRAN & RUT Indices
50-Day MA SPX = 2856 or 6.9% ABOVE SPX (max observed in last 7 yrs = +8.6%, min = -9.3%)
200-Day MA SPX = 2767 or 3.9% ABOVE SPX (max observed in last 7 yrs = 15.2%, min = -14%)
NONE of our EIGHT DeTrenders are in POSITIVE territory. The DeTrenders for DJ Tran & RUT will continue to be harbingers of future price behavior in broad indices.
HA_SP1_Momo Chart
WEEKLY Timing Model = on a BUY Signal since Friday, June 15, 2018 CLOSE at 2779
DAILY Timing Model = on a SELL Signal since Thursday, October 4, 2018 CLOSE at 2901
Max SPX 52wk-highs reading last week = 14 (over 120-140, the local maxima is in)
Max SPX 52wk-Lows reading last week = 86 (over 40-60, the local minima is in)
HA_SP1 closed at its -1.5 sigma channels
HA_Momo = -7.3 (reversals most likely occur above +10 or below -10)

Vol of the Vols Chart
Spot VIX currently stands at 24.16, again right about its +1 sigma (remember it's the VIX volatility pattern aka "its sigma channels" that matters, and not the level of VIX itself (this is per Dr. Robert Whaley, a great mentor and inventor of original VIX, now called VXO). VIX usually peaks around a test of its +4 sigma).
VIX & VXN both rose this past week fairly orderly (now in +1 to +2 sigma channels), and imho, it is saying the current leg of the move down is NOT complete yet.
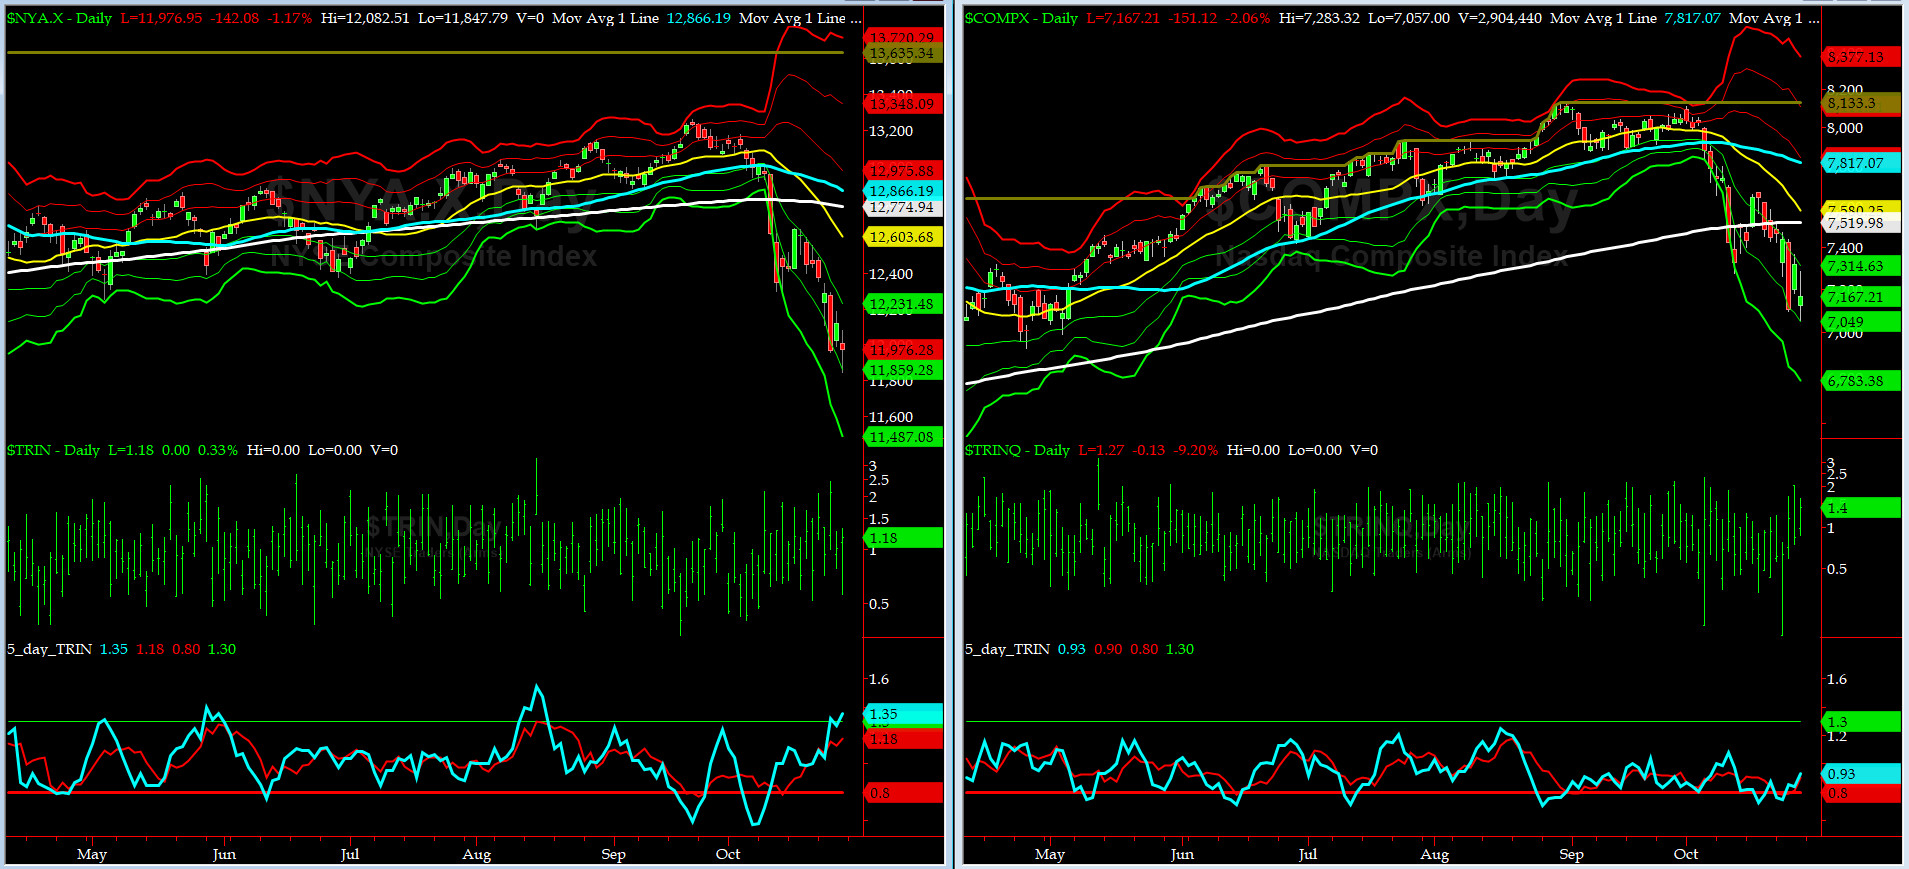
5-day TRIN & TRINQ Charts
NYSE 5-day TRIN is in BUY zone while NASDAQ 5-day TRINQ is in the NEUTRAL zone.
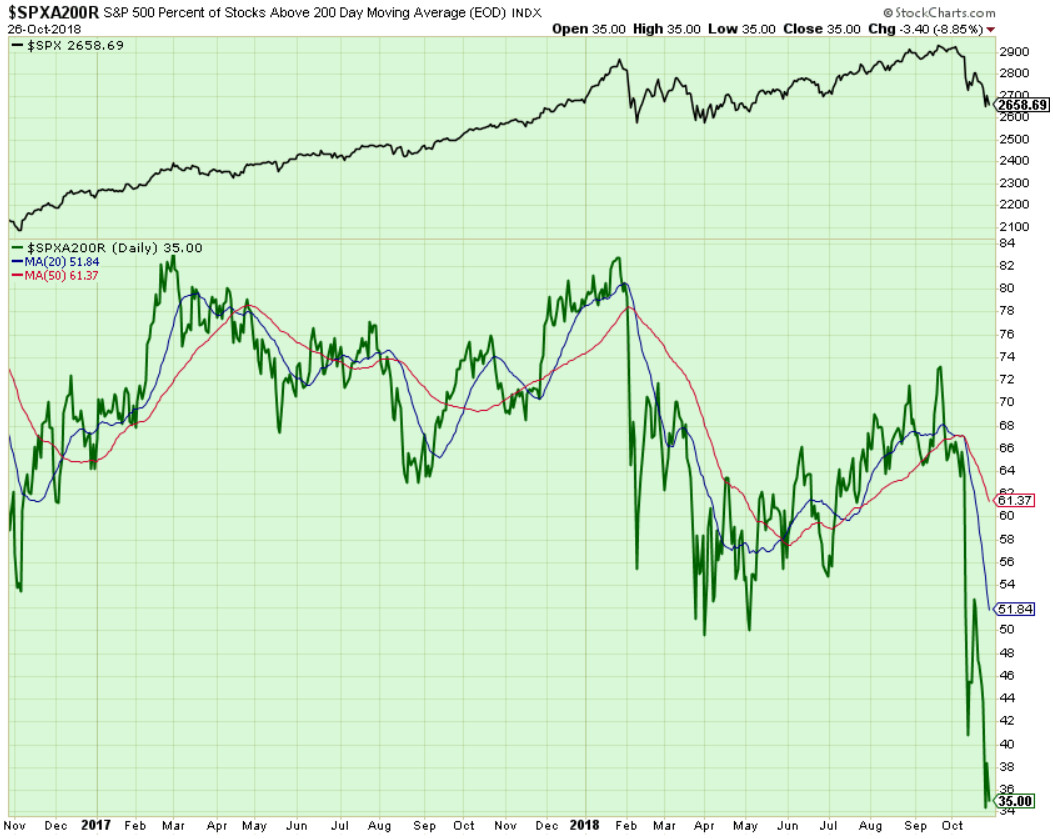
Components of SPX above their respective 200day MA Chart
This scoring indicator collapsed this week down to 35 area.
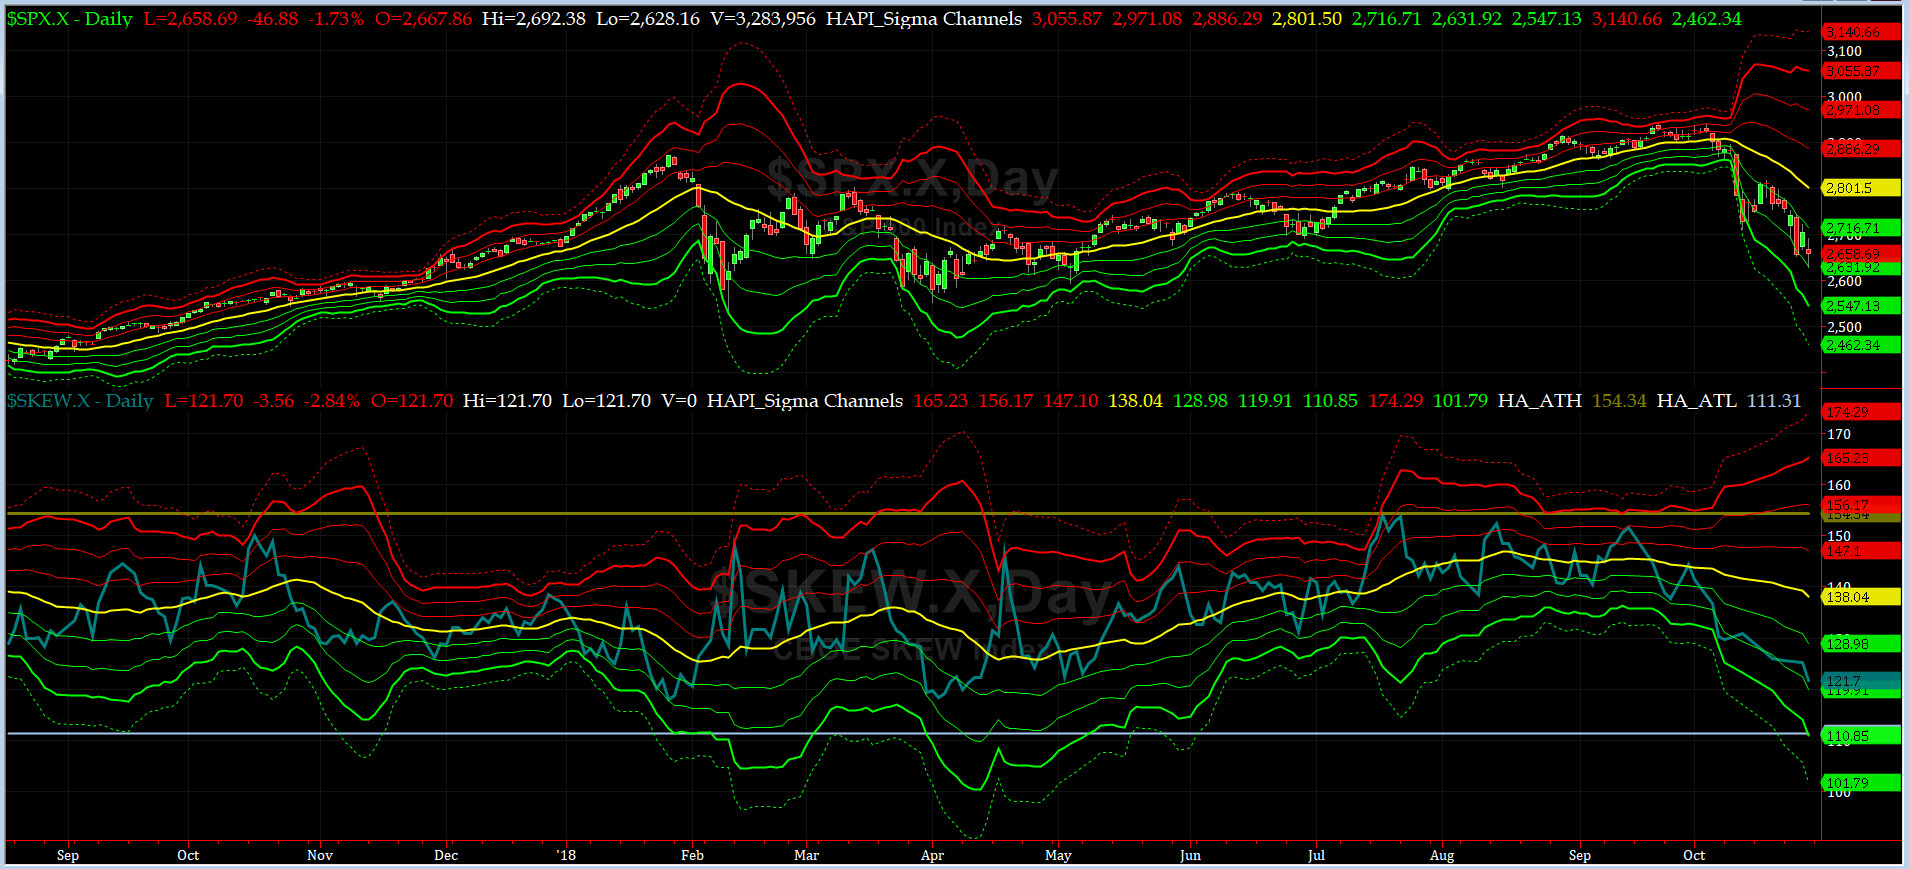
SPX SKEW (Tail Risk) Chart
On Friday, SPX SKEW (Tail Risk) closed near 121.7, right about its -2 sigma (normal = 120-125, range 100-150).
Is all quiet on the Eastern & Mid-Western Fronts? Our beloved @Capt_Tiko now says he is not sure....
How to interpret the value of SPX SKEW? (from CBOE white paper on SKEW)

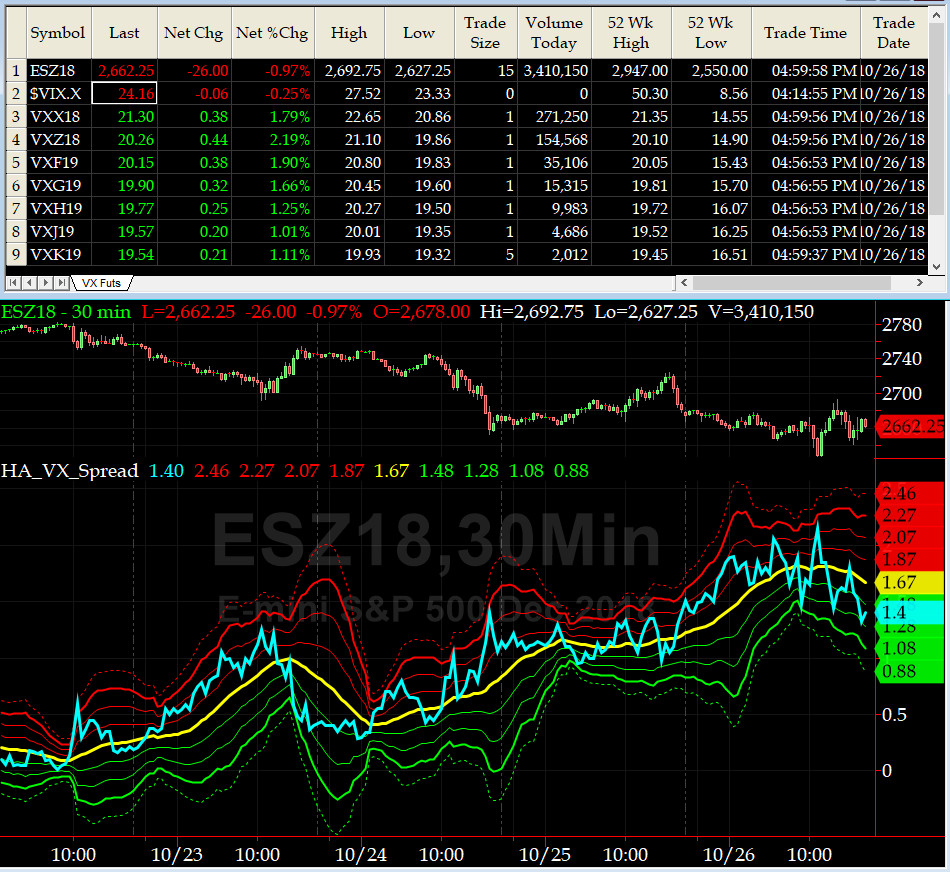
3-month VIX Futures Spread(VX) Chart
This popular timing indicator, (long NOV18, & short FEB19 VIX Futures) closed at +1.4 which is bullish here.

HA_SP2 Chart
HA_SP2 = 27.85 (Buy signal <= 25, Sell Signal >= 75)
Our coveted SP2 prop indicator is now searching for a possible tradable bottom, [soon?].
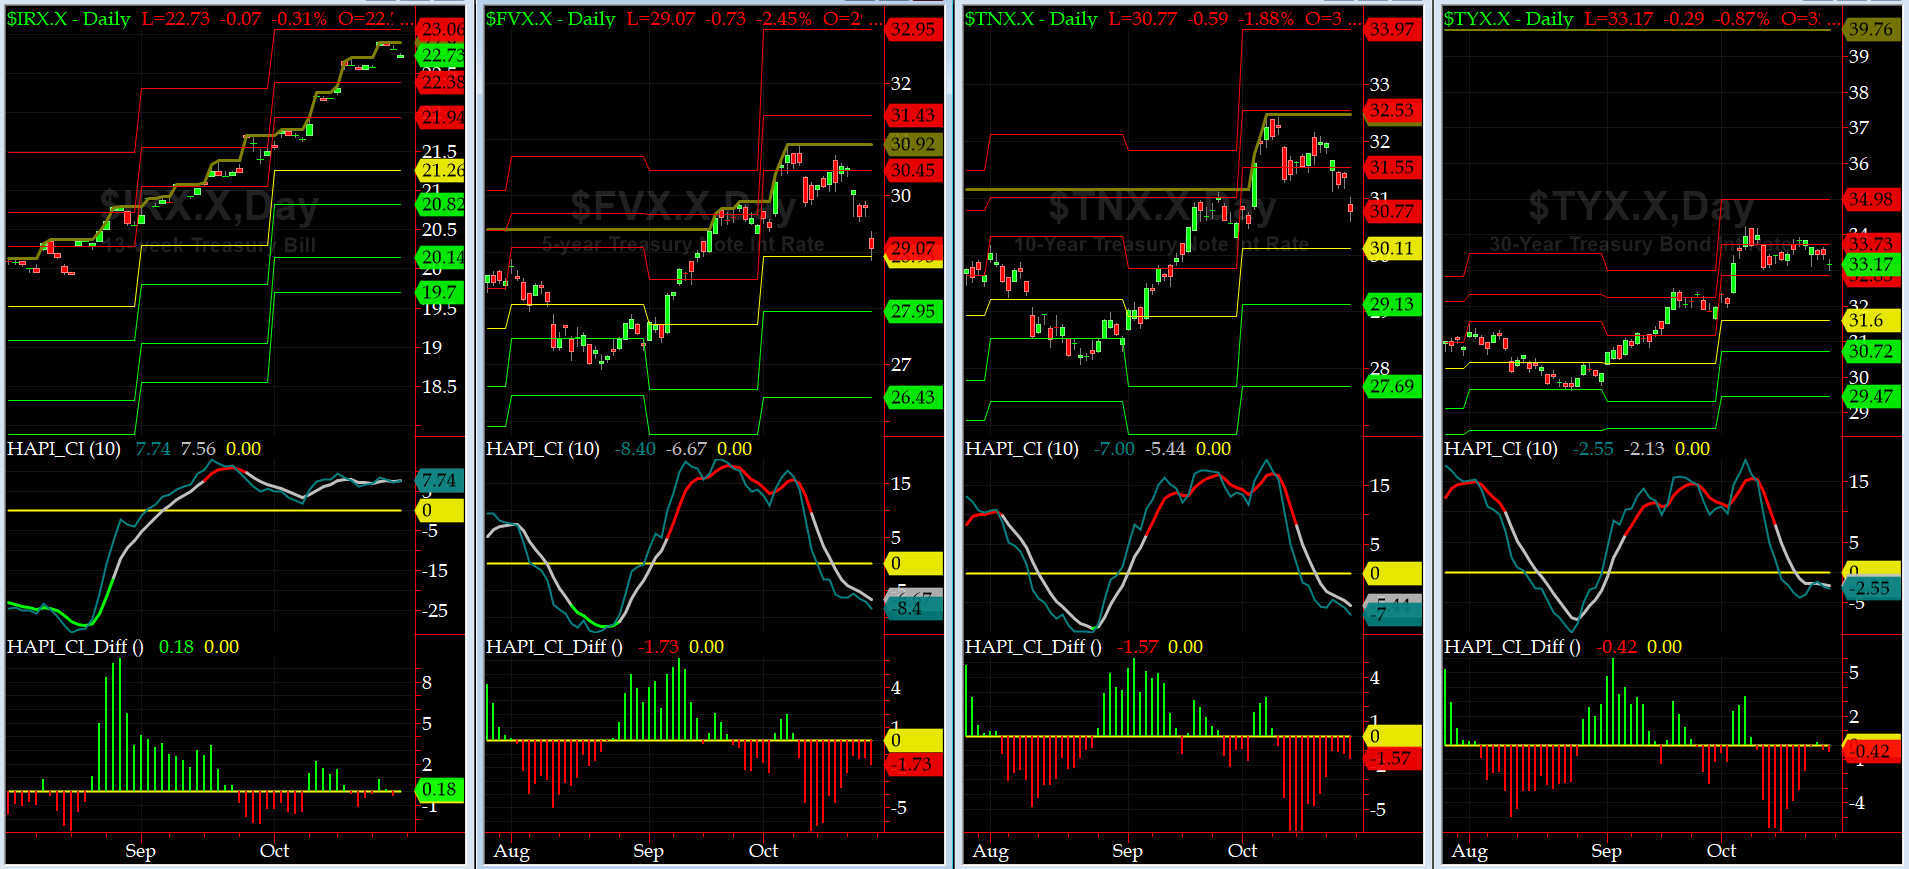
US Treasury T-Notes & T-Bonds Yields Chart
This past week the YTMs for T-Notes & T-Bonds pulled back while T-Bills EBYs rose somewhat.
Fari Hamzei
|


 Proactive Market Timing