|
Sunday, November 18, 2018, 2115ET
Market Timing Charts, Analysis & Commentary for Issue #267

Timer Charts of S&P-500 Cash Index (SPX) + NASDAQ-100 Cash Index (NDX)
Most recent S&P-500 Cash Index (SPX): 2736 down -45 (down -1.6%) for the week ending on Friday, November 16, 2018, which closed just about its zero sigma.
DJIA ALL TIME INTRADAY HIGH = 26951 (reached on Wednesday, October 3, 2018)
DJ TRAN ALL TIME INTRADAY HIGH = 11623 (reached on Friday, September 14, 2018)
SPX ALL TIME INTRADAY HIGH = 2941 (reached on Friday, September 21, 2018)
NDX ALL TIME INTRADAY HIGH = 7700 (reached on Thursday, October 1, 2018)
RUT ALL TIME INTRADAY HIGH = 1742 (reached on Friday, August 31, 2018)
Current DAILY +2 Sigma SPX = 2815 with WEEKLY +2 Sigma = 2962
Current DAILY 0 Sigma SPX = 2726 with WEEKLY 0 Sigma = 2821
Current DAILY -2 Sigma SPX = 2638 with WEEKLY -2 Sigma = 2680
NYSE McClellan Oscillator = +38 (-150 is start of the O/S area; around -275 to -300 area or lower, we go into the �launch-pad� mode; over +150, we are in O/B area)
NYSE Breadth Thrust = 50.3 (40 is considered as oversold and 65 as overbought)
What a difference 4 days make (Friday 9th thru Wednesday 14th) as the Nation gets ready for Thanksgiving and Bob Mueller gets ready to come out of hibernation. Capt Tiko is of the opinion that we should see some fireworks in the next 10 trading days. Judging by the observed chartpatterns, we think so too.
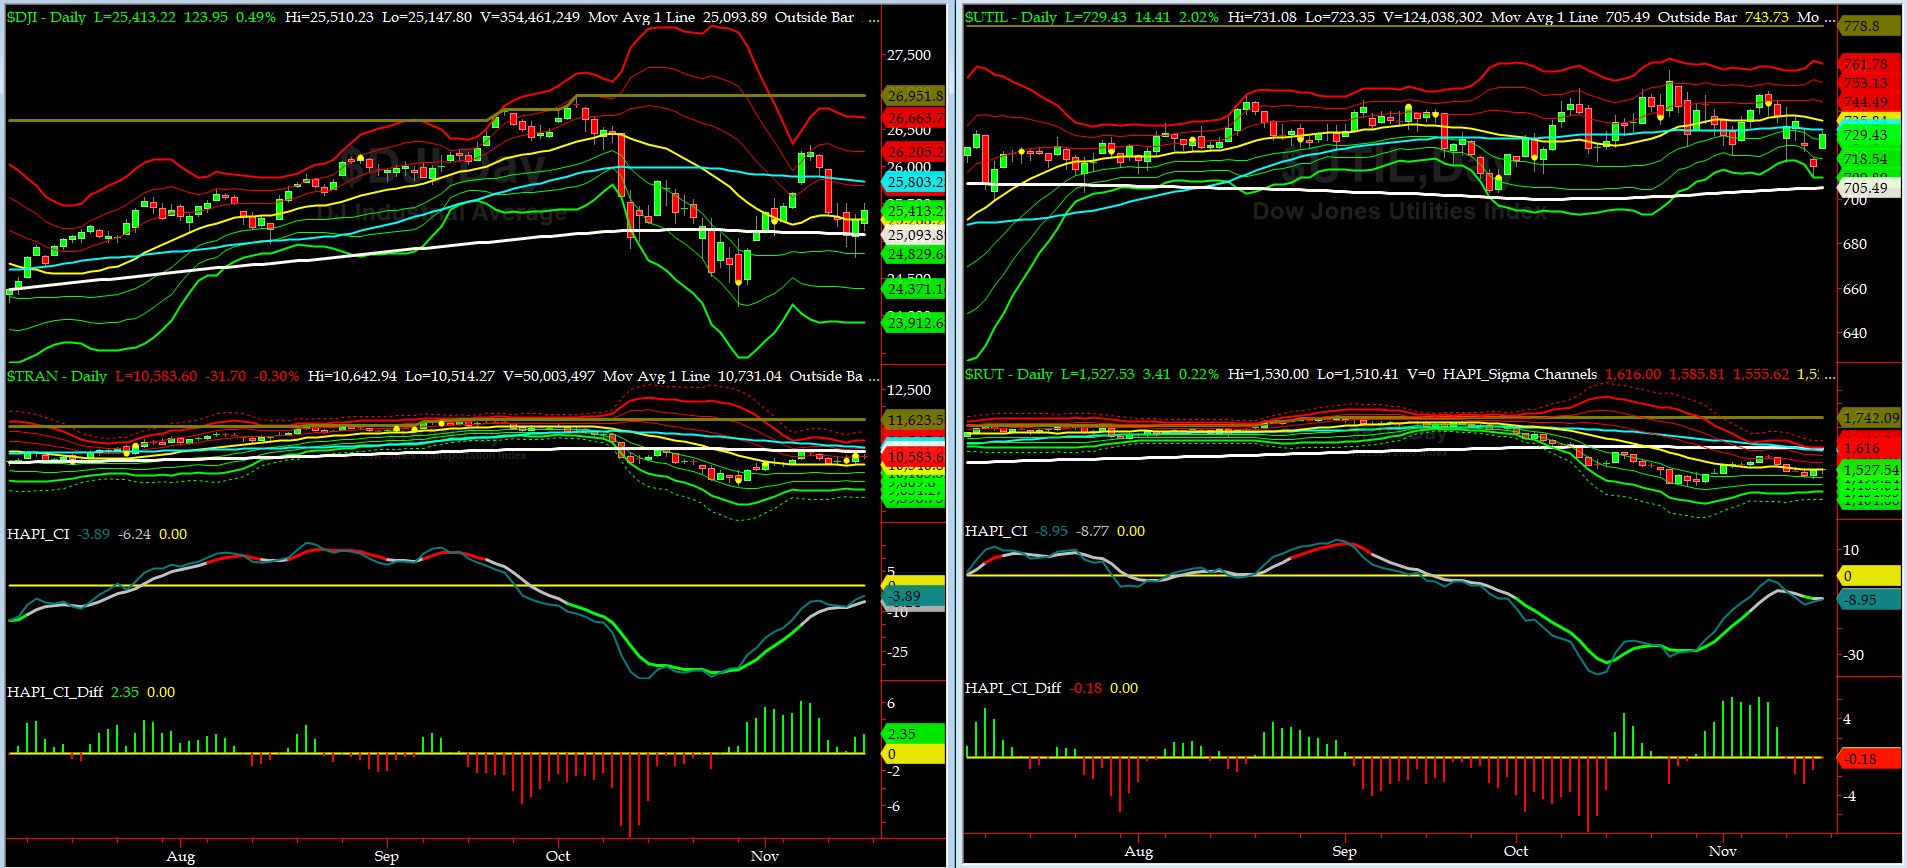
Canaries [in the Coal Mine] Chart for DJ TRAN & RUT Indices
200-Day MA DJ TRAN = 10,731 or 1.4% ABOVE DJ TRAN (max observed in last 7 yrs = 20.2%, min = -20.3%)
200-Day MA RUT = 1614 or 5.4% ABOVE RUT (max observed in last 7 yrs = 21.3%, min = -22.6%)
DJ Transportation Index (proxy for economic conditions 6 to 9 months hence) is now approaching its "death cross" (50-day MA crosses below its 200-day MA.
Russell 2000 Small Caps Index (proxy for Risk ON/OFF), as expected here, put in a "death cross". RISK is now in a big struggle to make a comeback.
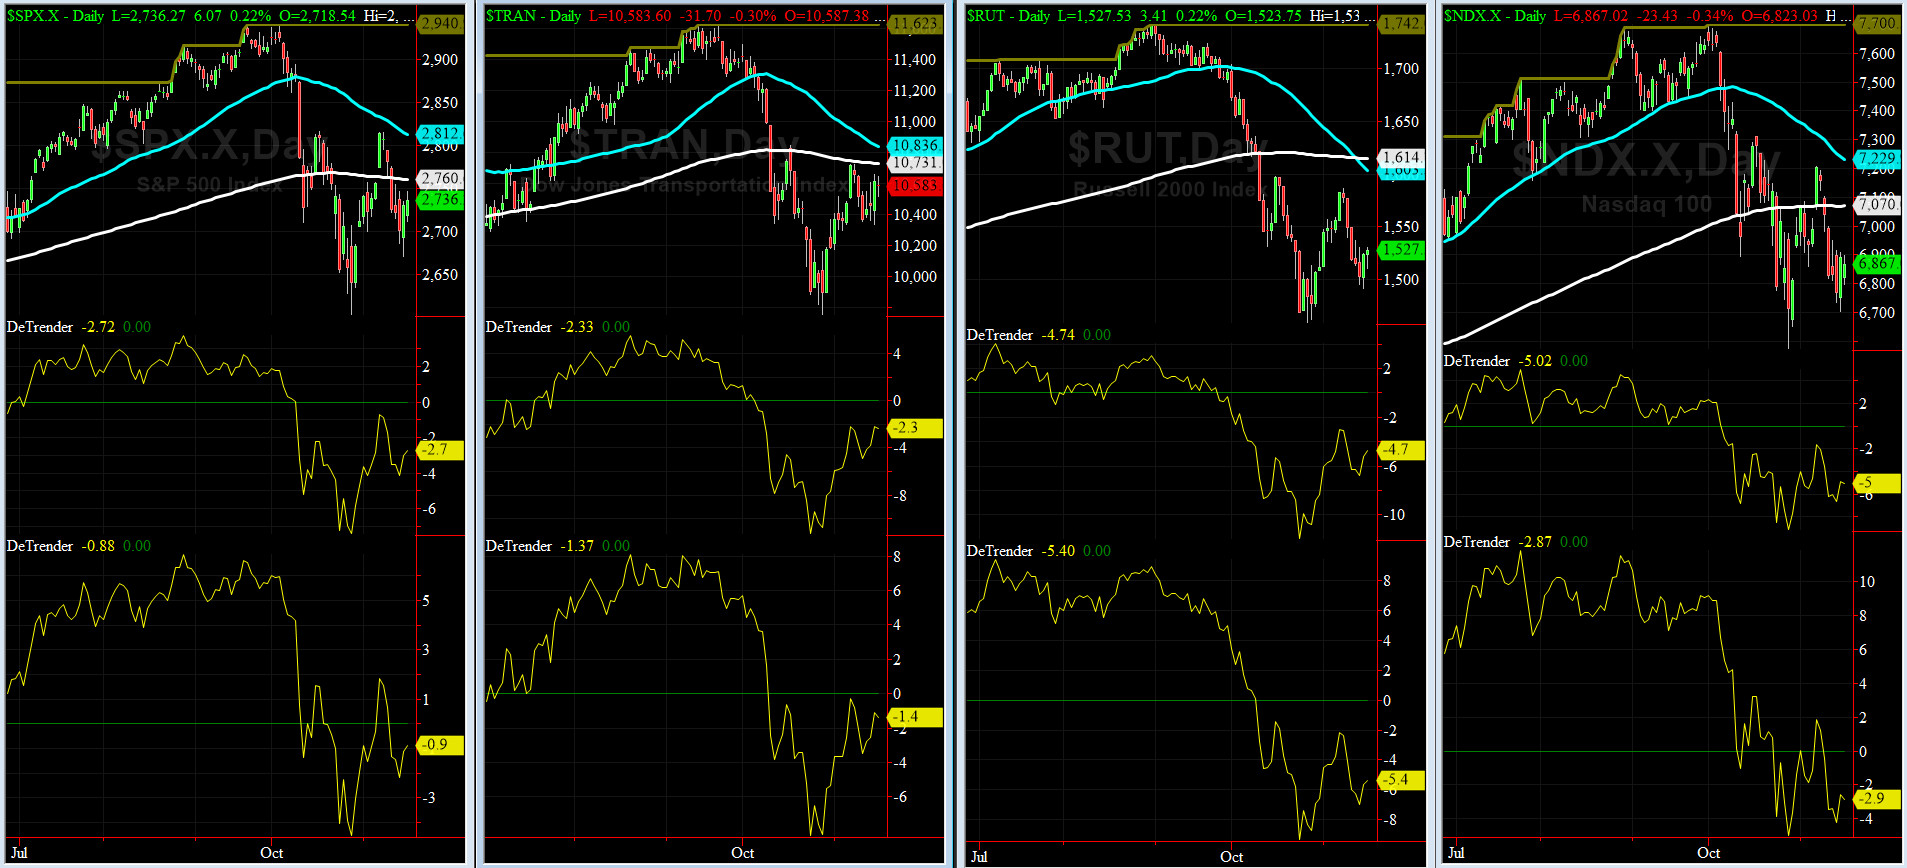
DeTrenders Charts for SPX, NDX, TRAN & RUT Indices
50-Day MA SPX = 2812 or 2.7% ABOVE SPX (max observed in last 7 yrs = +8.6%, min = -9.3%)
200-Day MA SPX = 2736 or 0.9% BELOW SPX (max observed in last 7 yrs = 15.2%, min = -14%)
For the THIRD week in the row, NONE of our EIGHT DeTrenders are in POSITIVE territory. The DeTrenders for DJ Tran & RUT will continue to be harbingers of future price behavior in broad indices.
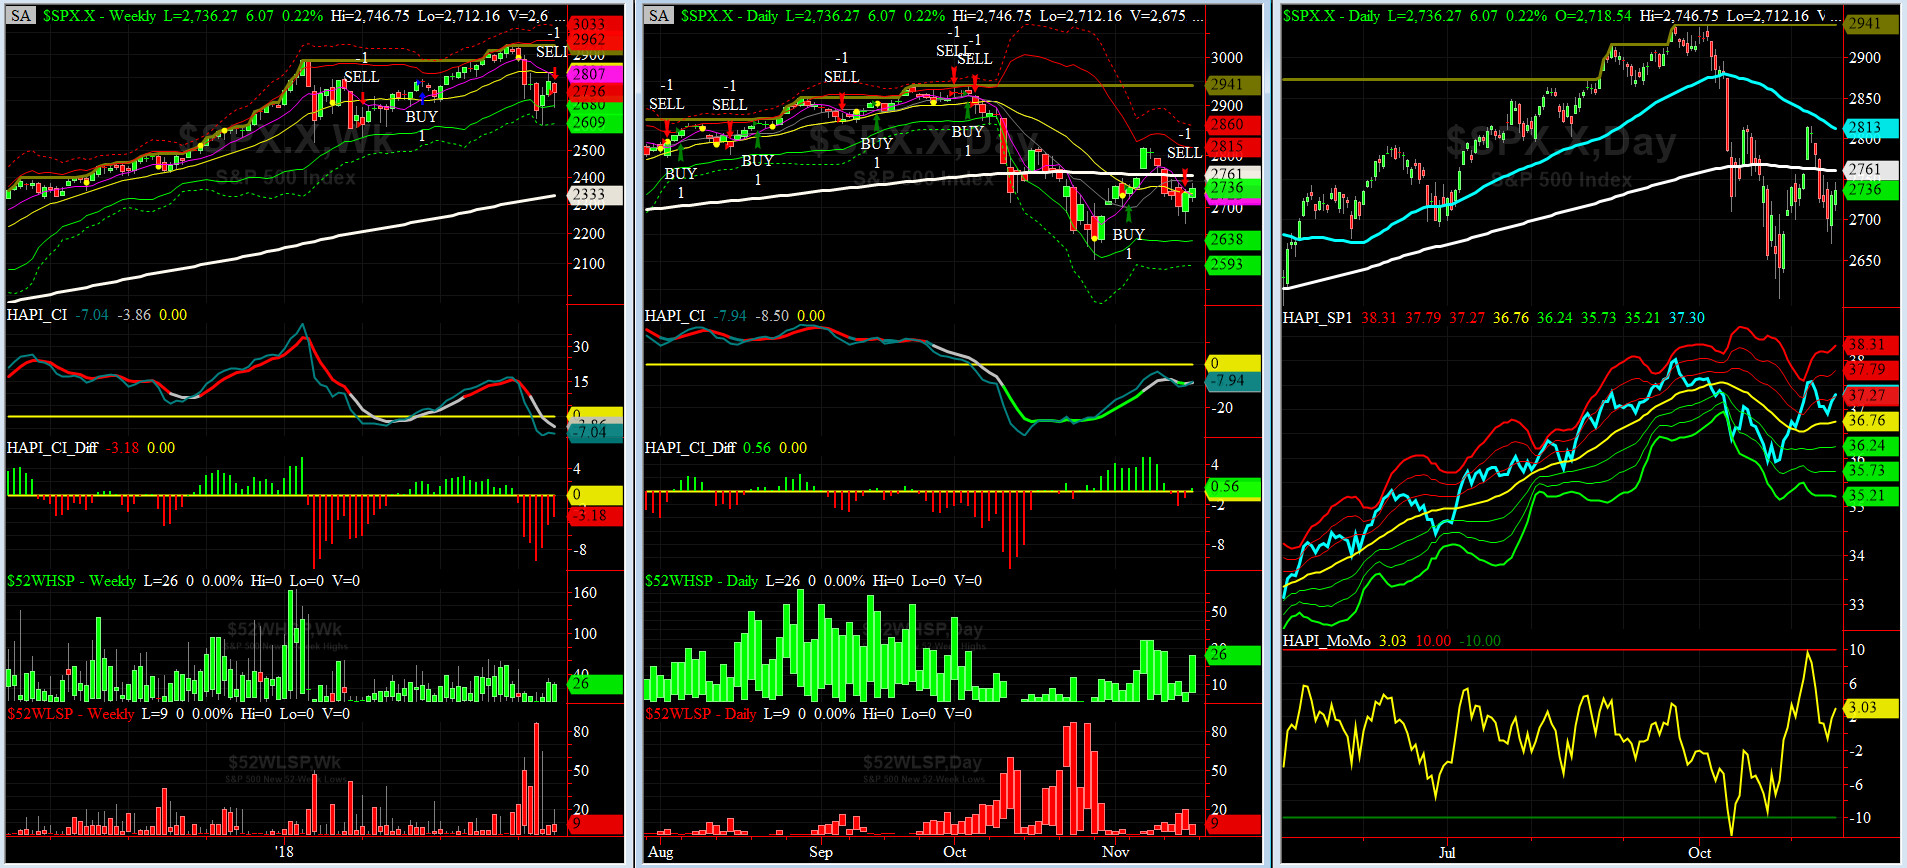
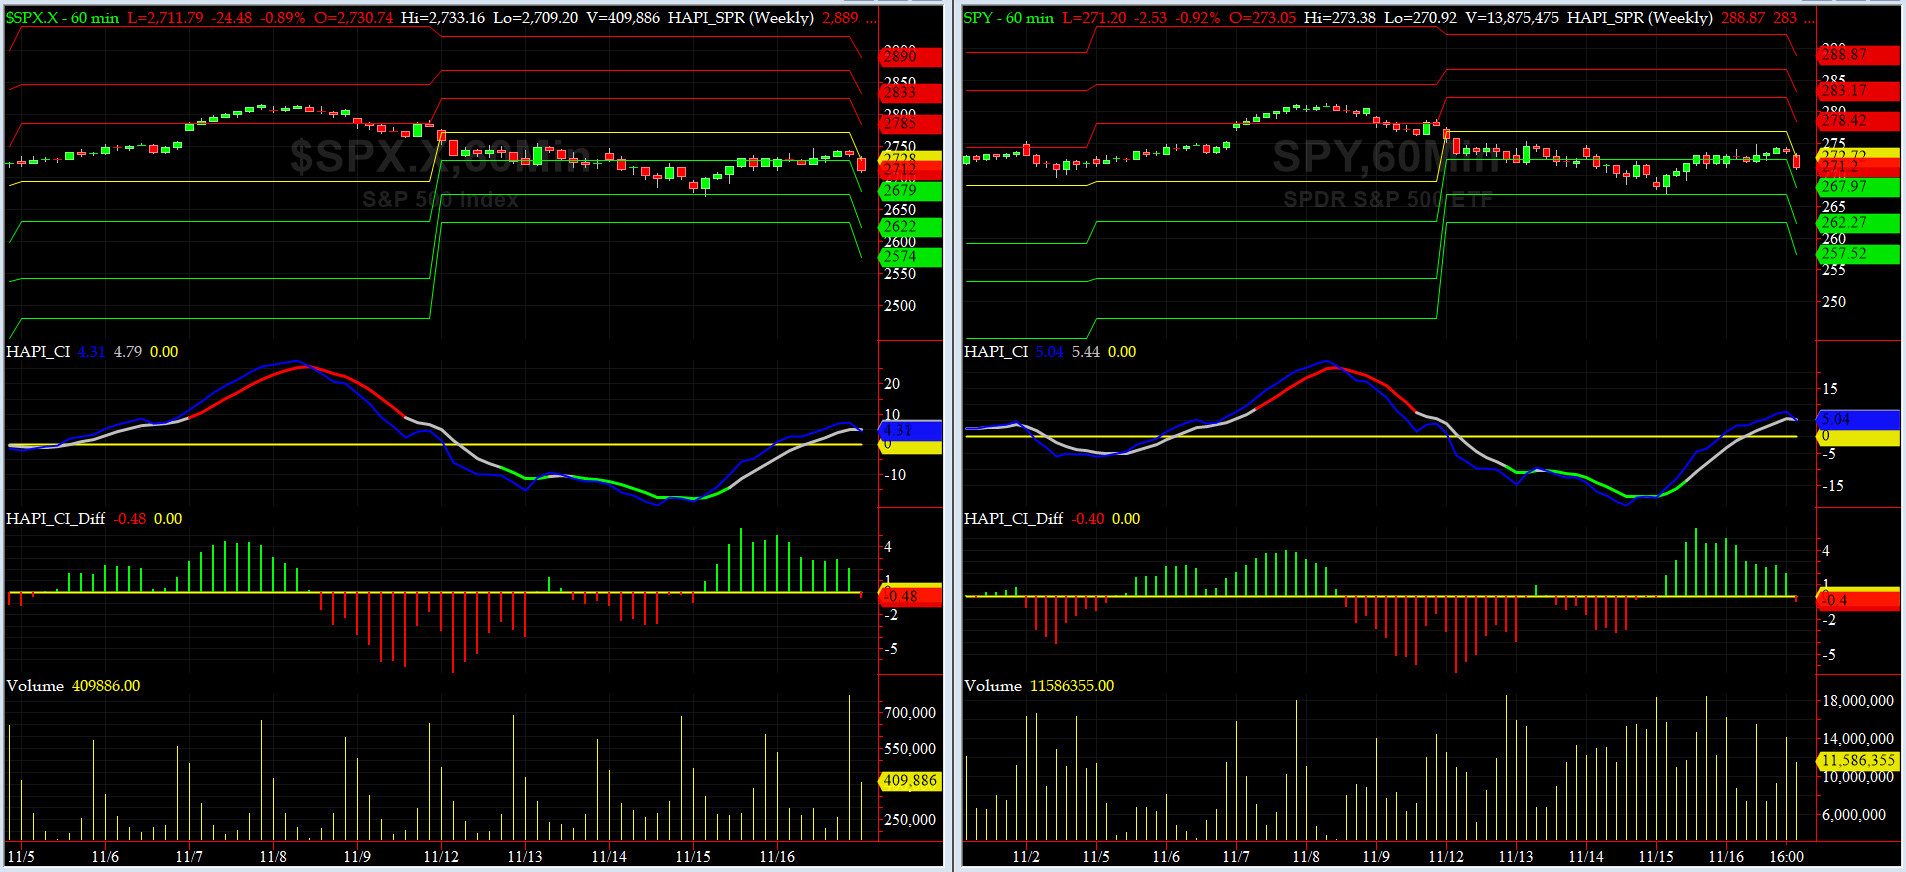
HA_SP1_Momo Chart
WEEKLY Timing Model = on a SELL Signal since Friday, November 16, 2018 CLOSE at 2736
DAILY Timing Model = on a SELL Signal since Thursday, November 15, 2018 CLOSE at 2730
Max SPX 52wk-highs reading last week = 28 (over 120-140, the local maxima is in)
Max SPX 52wk-Lows reading last week = 20 (over 40-60, the local minima is in)
HA_SP1 closed at its +1 sigma channels
HA_Momo = +3.03 (reversals most likely occur above +10 or below -10)
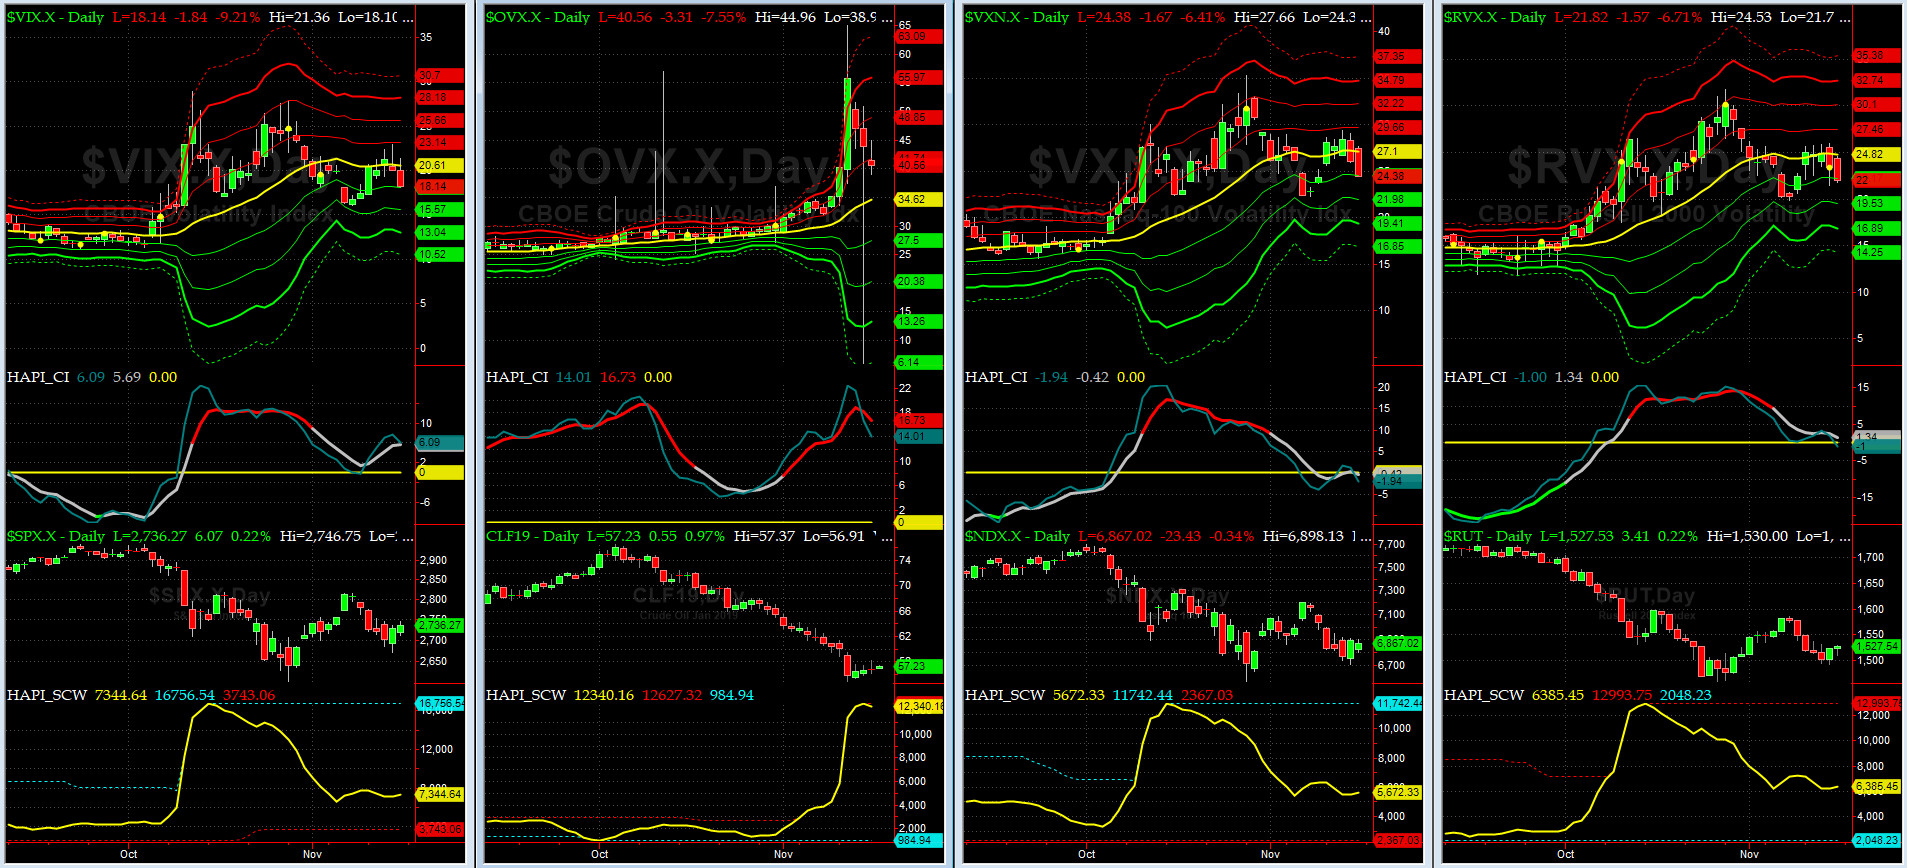
Vol of the Vols Chart
Spot VIX currently stands at 18.1, right about its -1 sigma (remember it's the VIX volatility pattern aka "its sigma channels" that matters, and not the level of VIX itself (this is per Dr. Robert Whaley, a great mentor and inventor of original VIX, now called VXO). VIX usually peaks around a test of its +4 sigma).
VIX & VXN both rallied first and then pulled back this past week.
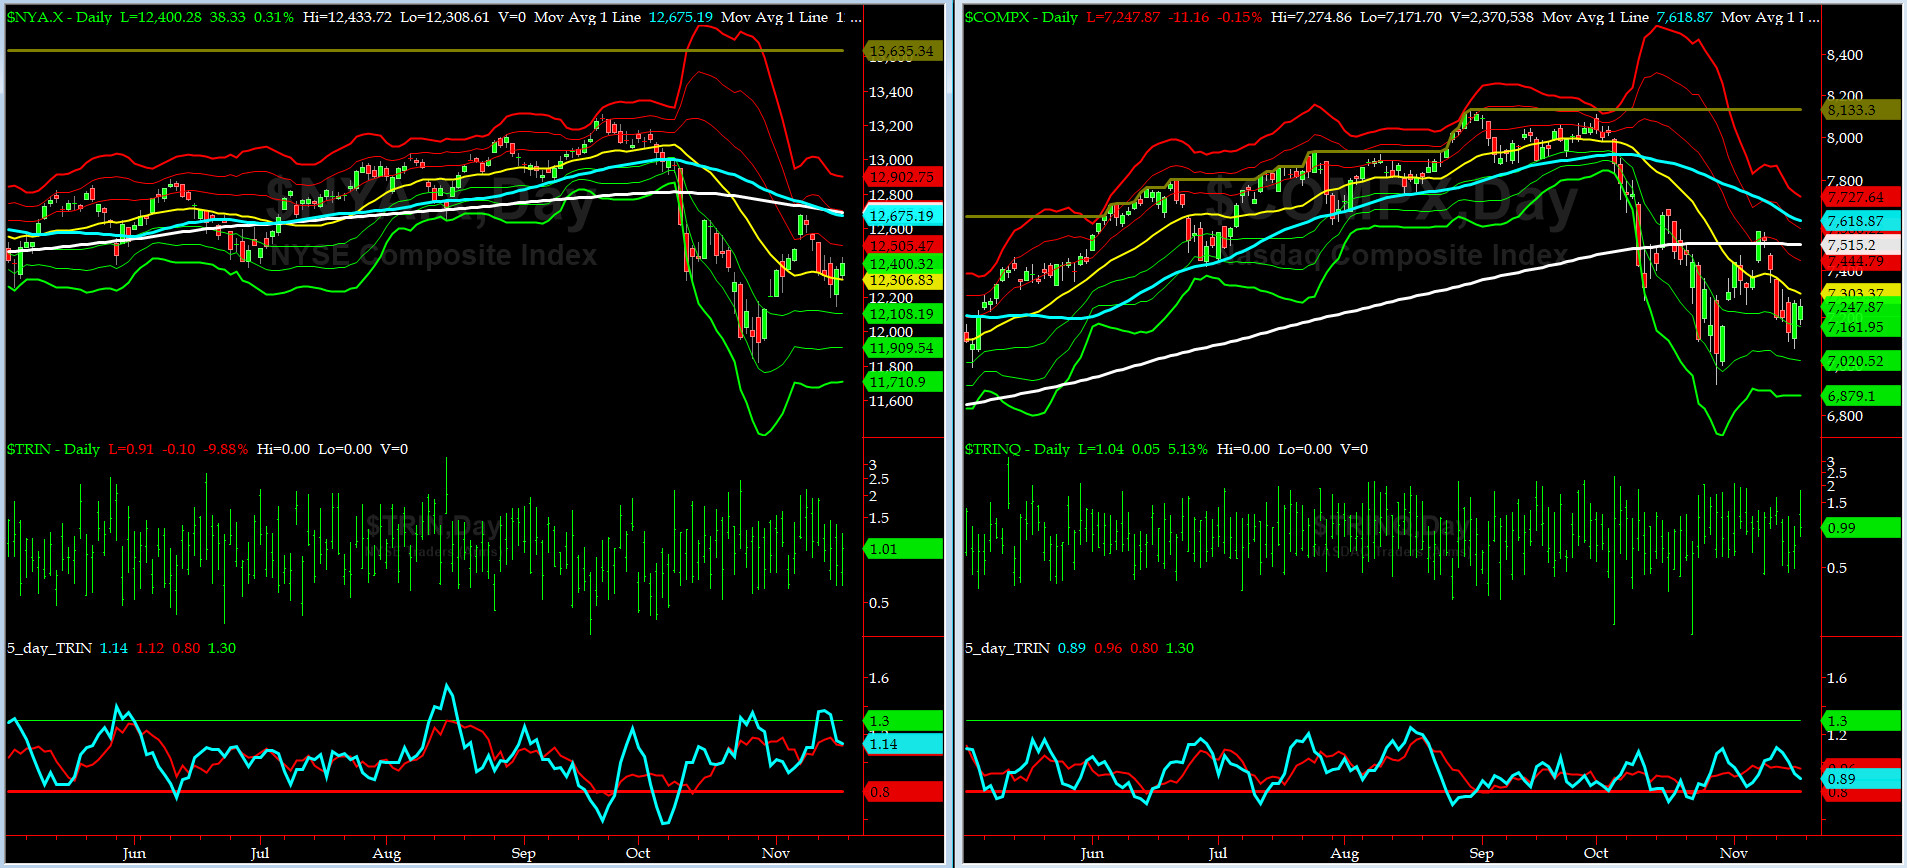
5-day TRIN & TRINQ Charts
Both NYSE 5-day TRIN & NASDAQ 5-day TRINQ are in the NEUTRAL zone again.
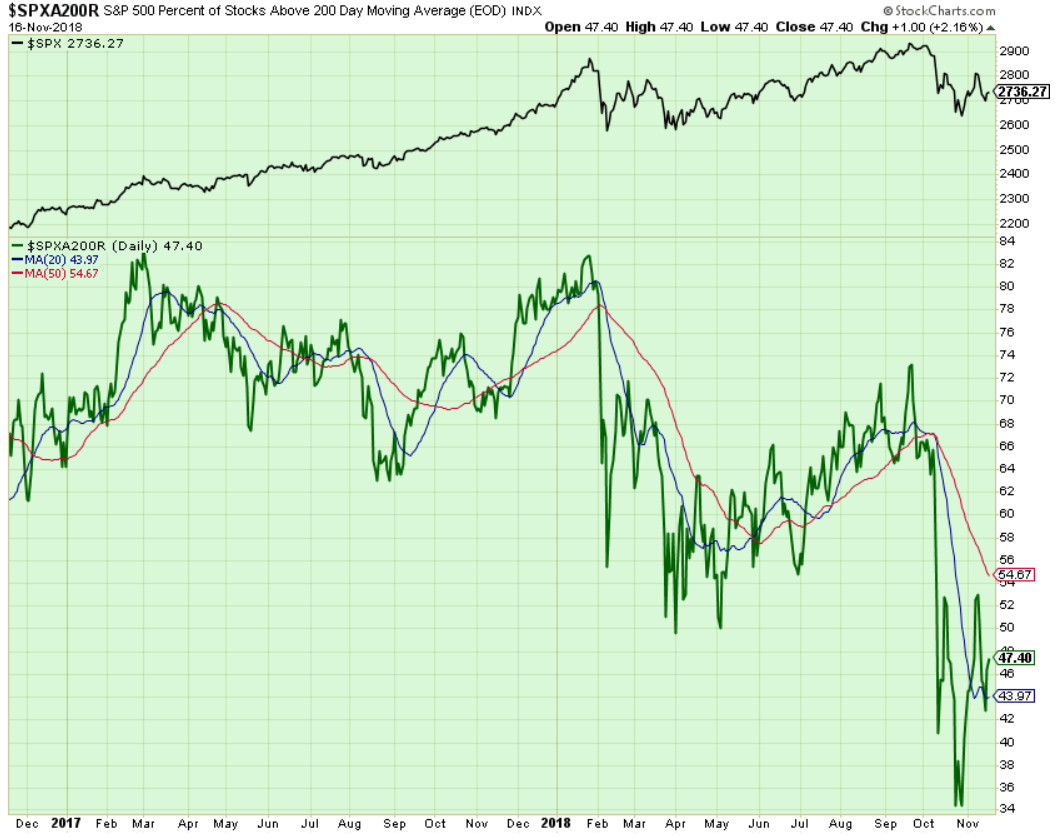
Components of SPX above their respective 200day MA Chart
This scoring indicator rallied to 47% area. This is a very NEUTRAL reading here.
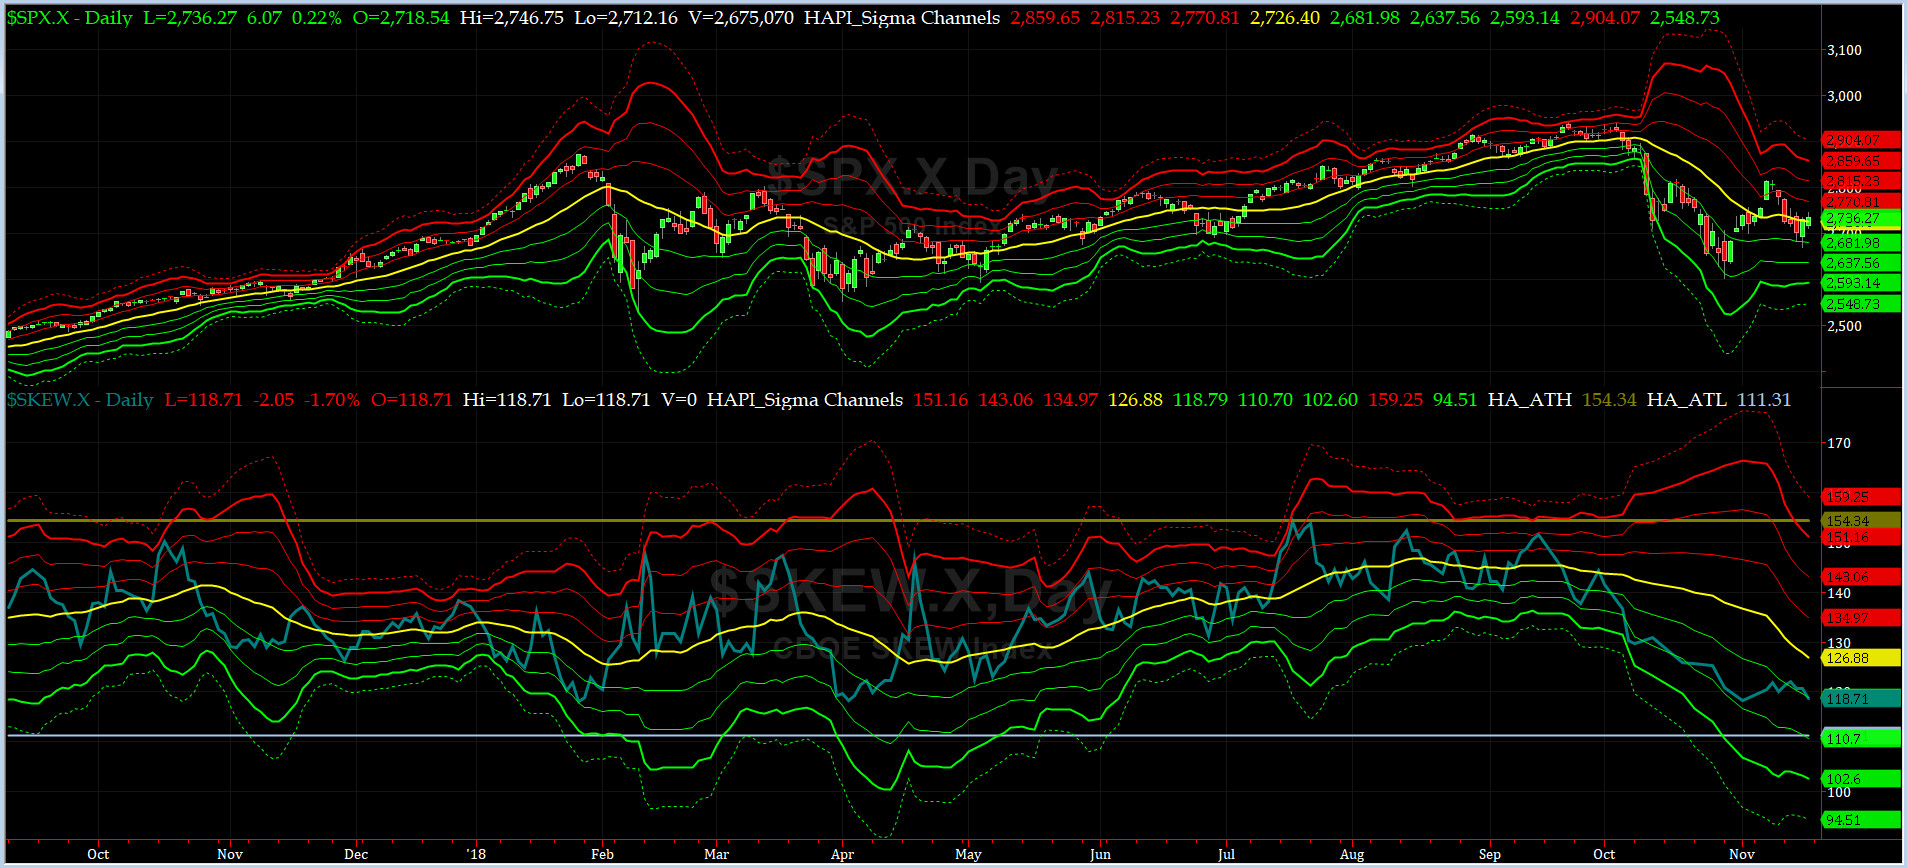
SPX SKEW (Tail Risk) Chart
On Friday, SPX SKEW (Tail Risk) closed near 118.7, still about its -1 sigma (normal = 120-125, range 100-150).
Is all quiet on the Eastern & Mid-Western Fronts? Our beloved @Capt_Tiko still says MAYBE....He is killing us, slowly
How to interpret the value of SPX SKEW? (from CBOE white paper on SKEW)


3-month VIX Futures Spread(VX) Chart
This popular timing indicator, (long DEEZ18, & short MAR19 VIX Futures) closed at -0.45 which is a tad NEUTRAL.
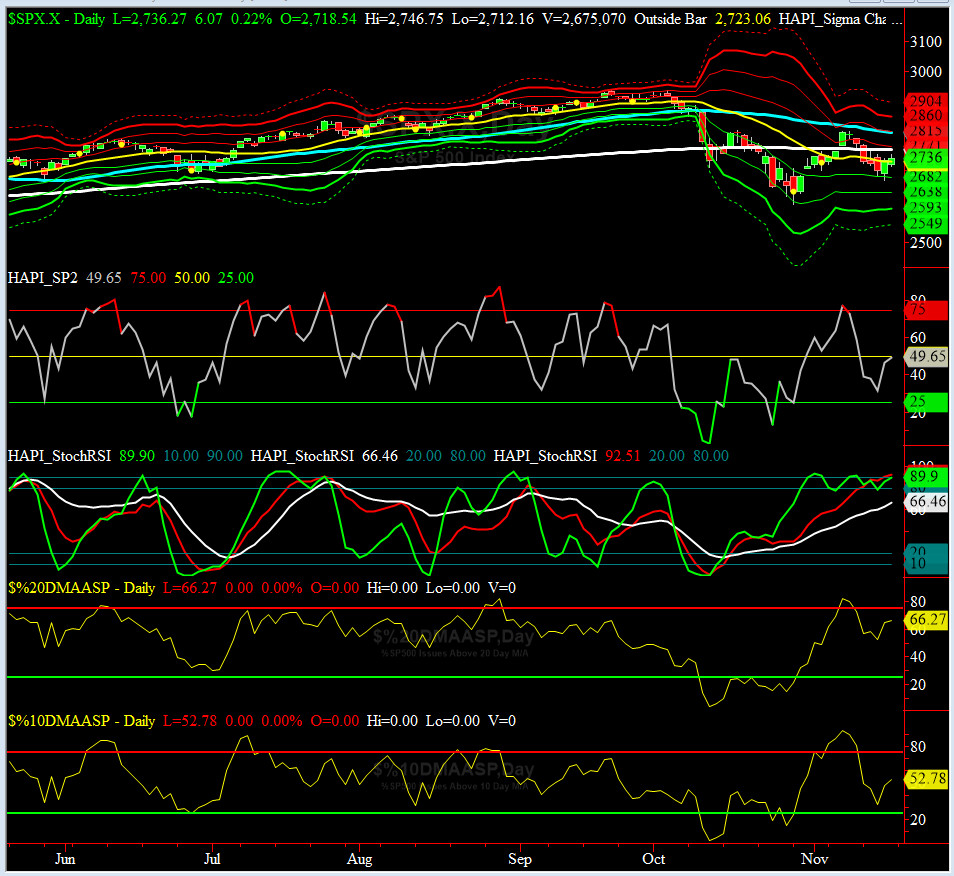
HA_SP2 Chart
HA_SP2 = 49.6 (Buy signal <= 25, Sell Signal >= 75)
Our coveted SP2 prop indicator sank to 31 and then close near 50. This is a NEUTRAL reading.

US Treasury T-Notes & T-Bonds Yields Chart
This past week, we had flight to safety trades across the Yeild Curve and all YTMs sank. Mr & Mrs Maury are very upset.......
Fari Hamzei
|


 Proactive Market Timing