
|
 |
 |
 |
 |
 |
 |
 |
 |
 Proactive Market Timing Proactive Market Timing
|
|
|
Most Recent PMT vs SPX Performance Chart

|
|
|
|
Thursday, December 13, 2018, 2301ET
Notice of Change of Bias with Timer Digest
Dear Jim,
The last three sessions have been very disappointing for the LONGs � we start each day strong and then they sell the heck out of it and we can�t seem to get thru the 20-day MA. That is a lot of weakness with the constant drip drip of negative news.
We are getting SHORT SPX here.
Fari Hamzei
|
|
|
|
|
|
Wednesday, December 12, 2018, 2000ET
Link for Tonight's Market Timing Webinar #62
Click here to Play
Thanks for attending,
Fari Hamzei
|
|
|
|
|
|
Tuesday, December 11, 2018, 1440ET
SECOND UPDATE to Market Bias for Issue #270
Our current Market Bias with Timer Digest is LONG SPX as of DEC 10 at 2637
Our previous Market Bias was SHORT SPX as of DEC 3 at 2790
Here are the trade parameters for this week:
SPX Secondary Profit Target for last 20% of our position = 2700
SPX Primary Profit Target for first 80% of our position = 2675
SPX BreakEven Stop (Current Price) for last 20% of our position = 2642
SPX Money Management Stop for 100% of our position = 2635
|
| Action |
Asset |
Expiration |
Strike |
Option |
| BUY |
SPY |
Friday DEC 21 |
265 |
Calls |
| SELL SHORT |
SPY |
Friday DEC 21 |
270 |
Calls |
| You need to execute both legs and hold it as a Call-Spread.
|
Note A:
Once the Primary Profit Target has been reached, traders are advised to close 80% of their position in order to lock in profits. The remaining balance can be carried over with a BreakEven STOP, based on the SPX level at the time of entry, in order to make the trade a zero-risk trade with the final position running to reach the Secondary Profit Target.
Once either Secondary Profit or Money Management (BreakEven STOP after the 80% peel-off) is hit, our Option/ETF trade for that week is over. Go to Cash and wait for the next PMT Issue.
Note B:
When we change our Market Bias with Timer Digest, You need to go FLAT asap. With PMT Pro, that is before the Close that day and with the basic PMT, at the open of the next day. The following trading day, we will issue new SPX targets and a new SPY options trade, as long our new market bias with Timer Digest is NOT flat.
Fari Hamzei
|
|
|
|
|
|
Tuesday, December 11, 2018, 1005ET
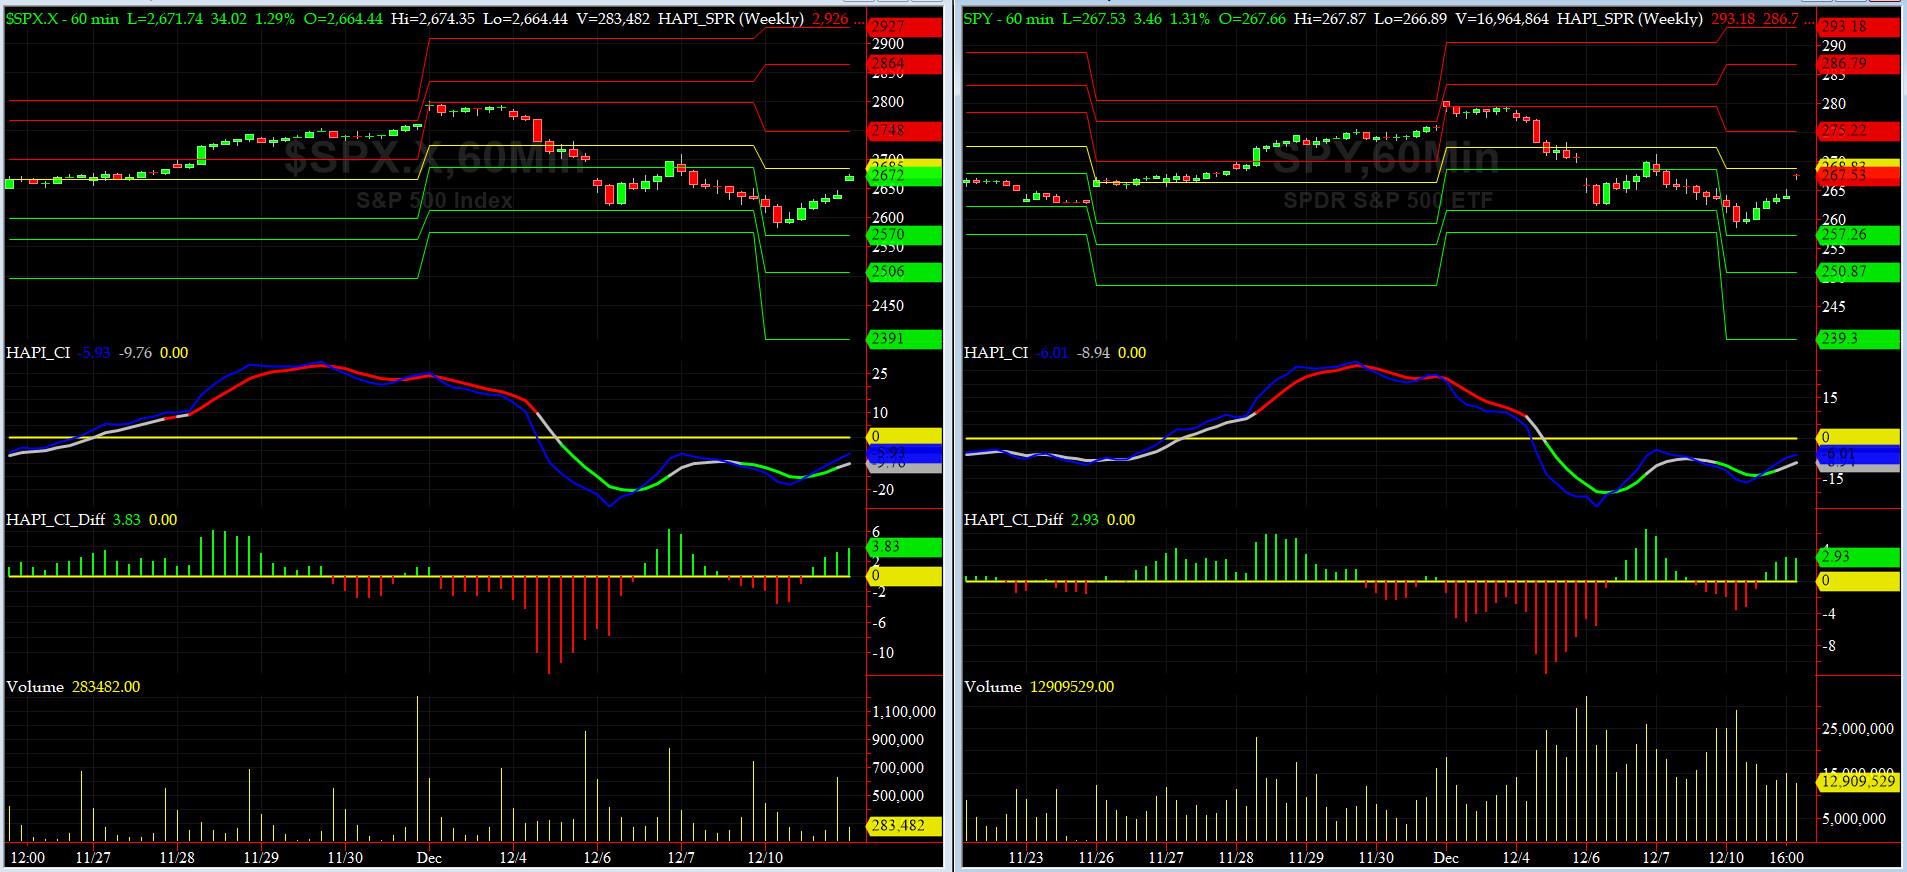
UPDATED Companion Chart for Market Bias Review, Issue #270
|
|
|
|
|
|
Tuesday, December 11, 2018, 1000ET
UPDATED Market Bias for Issue #270
Our current Market Bias with Timer Digest is LONG SPX as of DEC 10 at 2637
Our previous Market Bias was SHORT SPX as of DEC 3 at 2790
Here are the trade parameters for this week:
SPX Secondary Profit Target for last 20% of our position = 2725
SPX Primary Profit Target for first 80% of our position = 2700
SPX BreakEven Stop (Current Price) for last 20% of our position = 2671
SPX Money Management Stop for 100% of our position = 2655
|
| Action |
Asset |
Expiration |
Strike |
Option |
| BUY |
SPY |
Friday DEC 28 |
268 |
Calls |
| SELL SHORT |
SPY |
Friday DEC 28 |
275 |
Calls |
| You need to execute both legs and hold it as a Call-Spread.
|
Note A:
Once the Primary Profit Target has been reached, traders are advised to close 80% of their position in order to lock in profits. The remaining balance can be carried over with a BreakEven STOP, based on the SPX level at the time of entry, in order to make the trade a zero-risk trade with the final position running to reach the Secondary Profit Target.
Once either Secondary Profit or Money Management (BreakEven STOP after the 80% peel-off) is hit, our Option/ETF trade for that week is over. Go to Cash and wait for the next PMT Issue.
Note B:
When we change our Market Bias with Timer Digest, You need to go FLAT asap. With PMT Pro, that is before the Close that day and with the basic PMT, at the open of the next day. The following trading day, we will issue new SPX targets and a new SPY options trade, as long our new market bias with Timer Digest is NOT flat.
Fari Hamzei
|
|
|
|
|
|
Monday, December 10, 2018, 1831ET
Notice of Change of Bias with Timer Digest
Dear Jim,
After a careful review of our short-term indicators using the settlement data, it is our humble opinion that most likely, as European Markets closed (~1130 ET) today, our equity markets went thru a short-term extremely oversold local minima.
Therefore, we are getting LONG SPX here���
Fari Hamzei
|
|
|
|
|
|
Monday, December 10, 2018, 1025ET
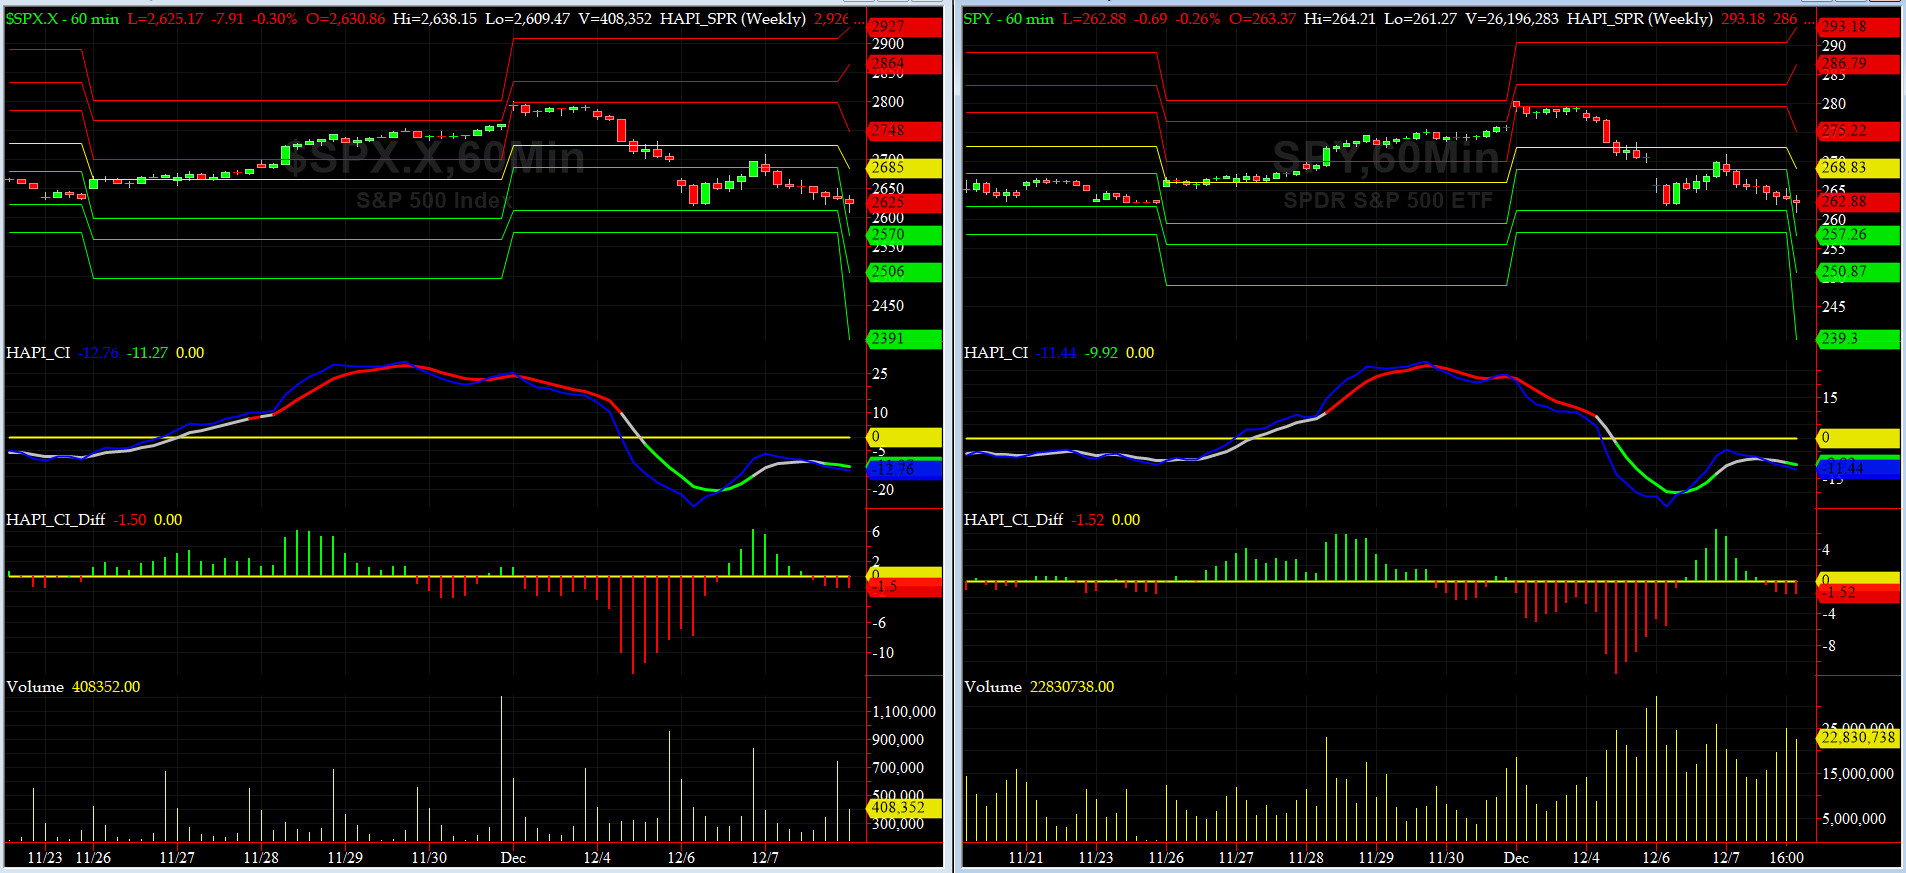
Companion Chart for Market Bias Review, Issue #270
|
|
|
|
|
|
Monday, December 10, 2018, 1020ET
Market Bias for Issue #270
Our current Market Bias with Timer Digest is SHORT SPX as of DEC 3 at 2790
Our previous Market Bias was LONG SPX as of Nov 30 at 2760
Here are the trade parameters for this week:
SPX Money Management Stop for 100% of our position = 2630
SPX BreakEven Stop (Current Price) for last 20% of our position = 2620
SPX Primary Profit Target for first 80% of our position = 2600
SPX Secondary Profit Target for last 20% of our position = 2570
|
| Action |
Asset |
Expiration |
Strike |
Option |
| BUY |
SPY |
Friday DEC 21 |
262 |
Puts |
| SELL SHORT |
SPY |
Friday DEC 21 |
257 |
Puts |
| You need to execute both legs and hold it as a Put-Spread.
|
Note A:
Once the Primary Profit Target has been reached, traders are advised to close 80% of their position in order to lock in profits. The remaining balance can be carried over with a BreakEven STOP, based on the SPX level at the time of entry, in order to make the trade a zero-risk trade with the final position running to reach the Secondary Profit Target.
Once either Secondary Profit or Money Management (BreakEven STOP after the 80% peel-off) is hit, our Option/ETF trade for that week is over. Go to Cash and wait for the next PMT Issue.
Note B:
When we change our Market Bias with Timer Digest, You need to go FLAT asap. With PMT Pro, that is before the Close that day and with the basic PMT, at the open of the next day. The following trading day, we will issue new SPX targets and a new SPY options trade, as long our new market bias with Timer Digest is NOT flat.
Fari Hamzei
|
|
|
|
|
|
Sunday, December 9, 2018, 1745ET
Market Timing Charts, Analysis & Commentary for Issue #270

Timer Charts of S&P-500 Cash Index (SPX) + NASDAQ-100 Cash Index (NDX)
Most recent S&P-500 Cash Index (SPX): 2633 down -127 (down -4.6%) for the week ending on Friday, December 7, 2018, which closed just a tad above its -2 sigma.
DJIA ALL TIME INTRADAY HIGH = 26951 (reached on Wednesday, October 3, 2018)
DJ TRAN ALL TIME INTRADAY HIGH = 11623 (reached on Friday, September 14, 2018)
SPX ALL TIME INTRADAY HIGH = 2941 (reached on Friday, September 21, 2018)
NDX ALL TIME INTRADAY HIGH = 7700 (reached on Thursday, October 1, 2018)
RUT ALL TIME INTRADAY HIGH = 1742 (reached on Friday, August 31, 2018)
Current DAILY +2 Sigma SPX = 2812 with WEEKLY +2 Sigma = 2986
Current DAILY 0 Sigma SPX = 2712 with WEEKLY 0 Sigma = 2804
Current DAILY -2 Sigma SPX = 2612 with WEEKLY -2 Sigma = 2623
NYSE McClellan Oscillator = -54 (-150 is start of the O/S area; around -275 to -300 area or lower, we go into the �launch-pad� mode; over +150, we are in O/B area)
NYSE Breadth Thrust = 48.1 (40 is considered as oversold and 65 as overbought)
Truth will always catch up with the man (or woman, just to be PC). As we say in the Navy, get your harness on.... @Capt_Tiko sees rough seas ahead.
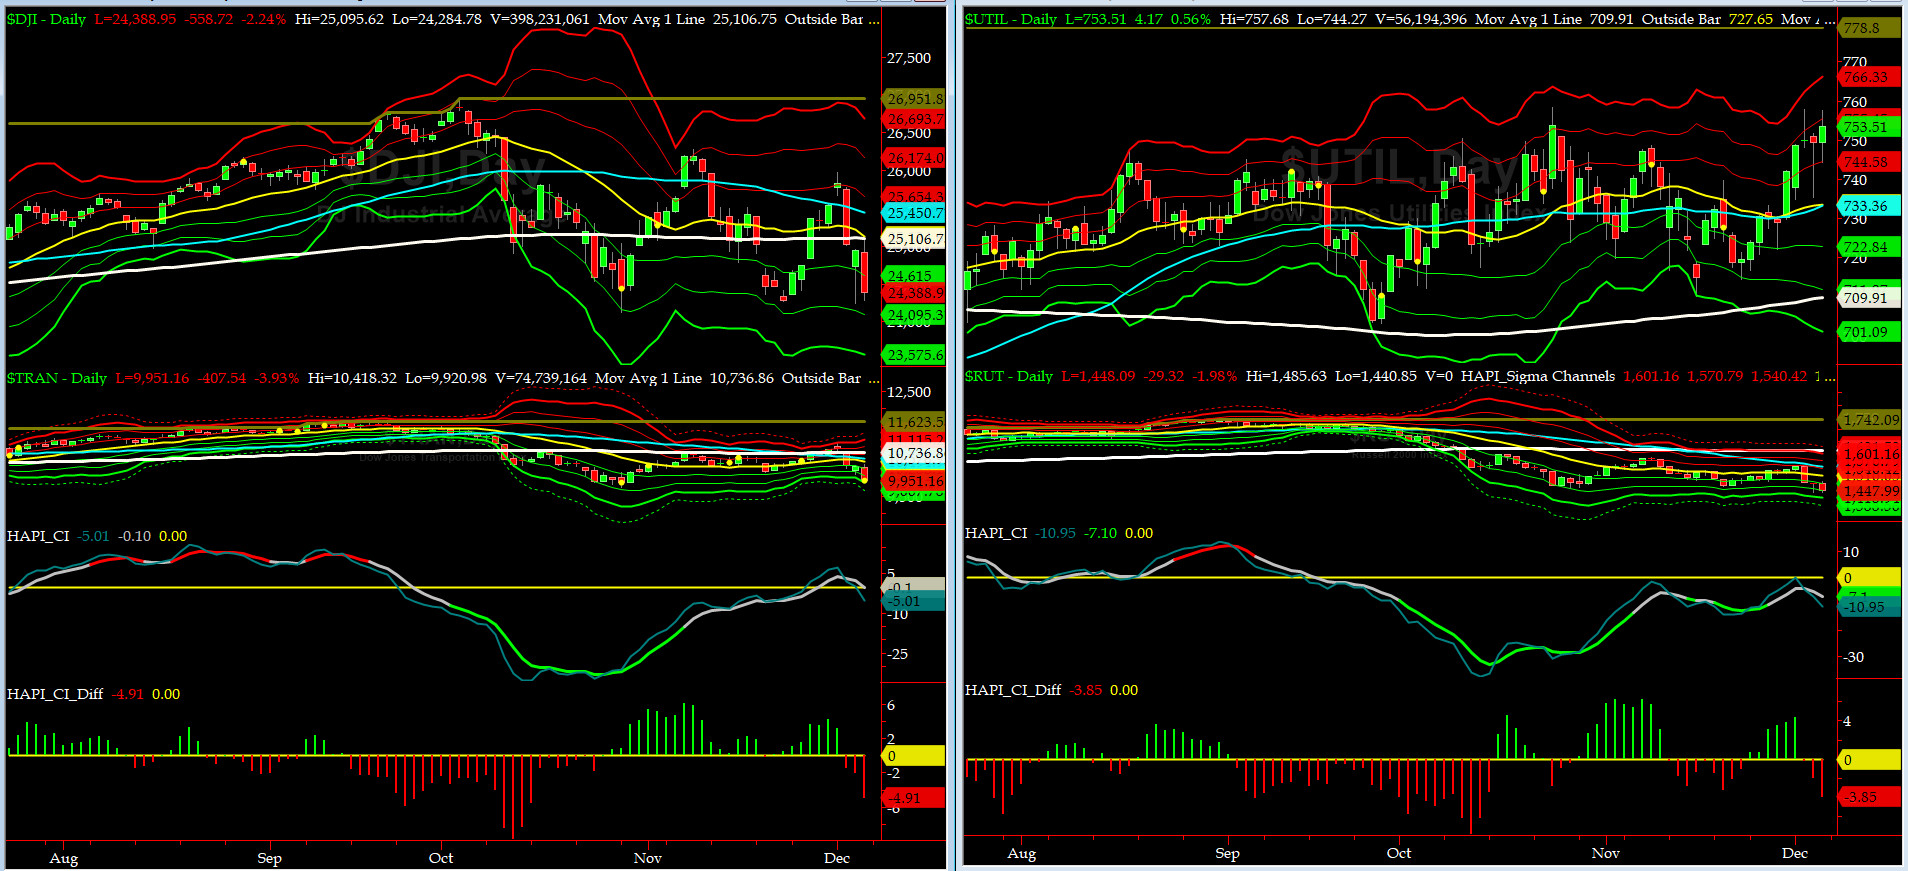
Canaries [in the Coal Mine] Chart for DJ TRAN & RUT Indices
200-Day MA DJ TRAN = 10,736 or 7.3% ABOVE DJ TRAN (max observed in last 7 yrs = 20.2%, min = -20.3%)
200-Day MA RUT = 1614 or 10.3% ABOVE RUT (max observed in last 7 yrs = 21.3%, min = -22.6%)
DJ Transportation Index (proxy for economic conditions 6 to 9 months hence) had its WORST week in many moons... this happens when we get a death cross, as our Capt_Tiko warned us ad nauseam.
Russell 2000 Small Caps Index (proxy for Risk ON/OFF) also got sick and puked. RISK is OFF.
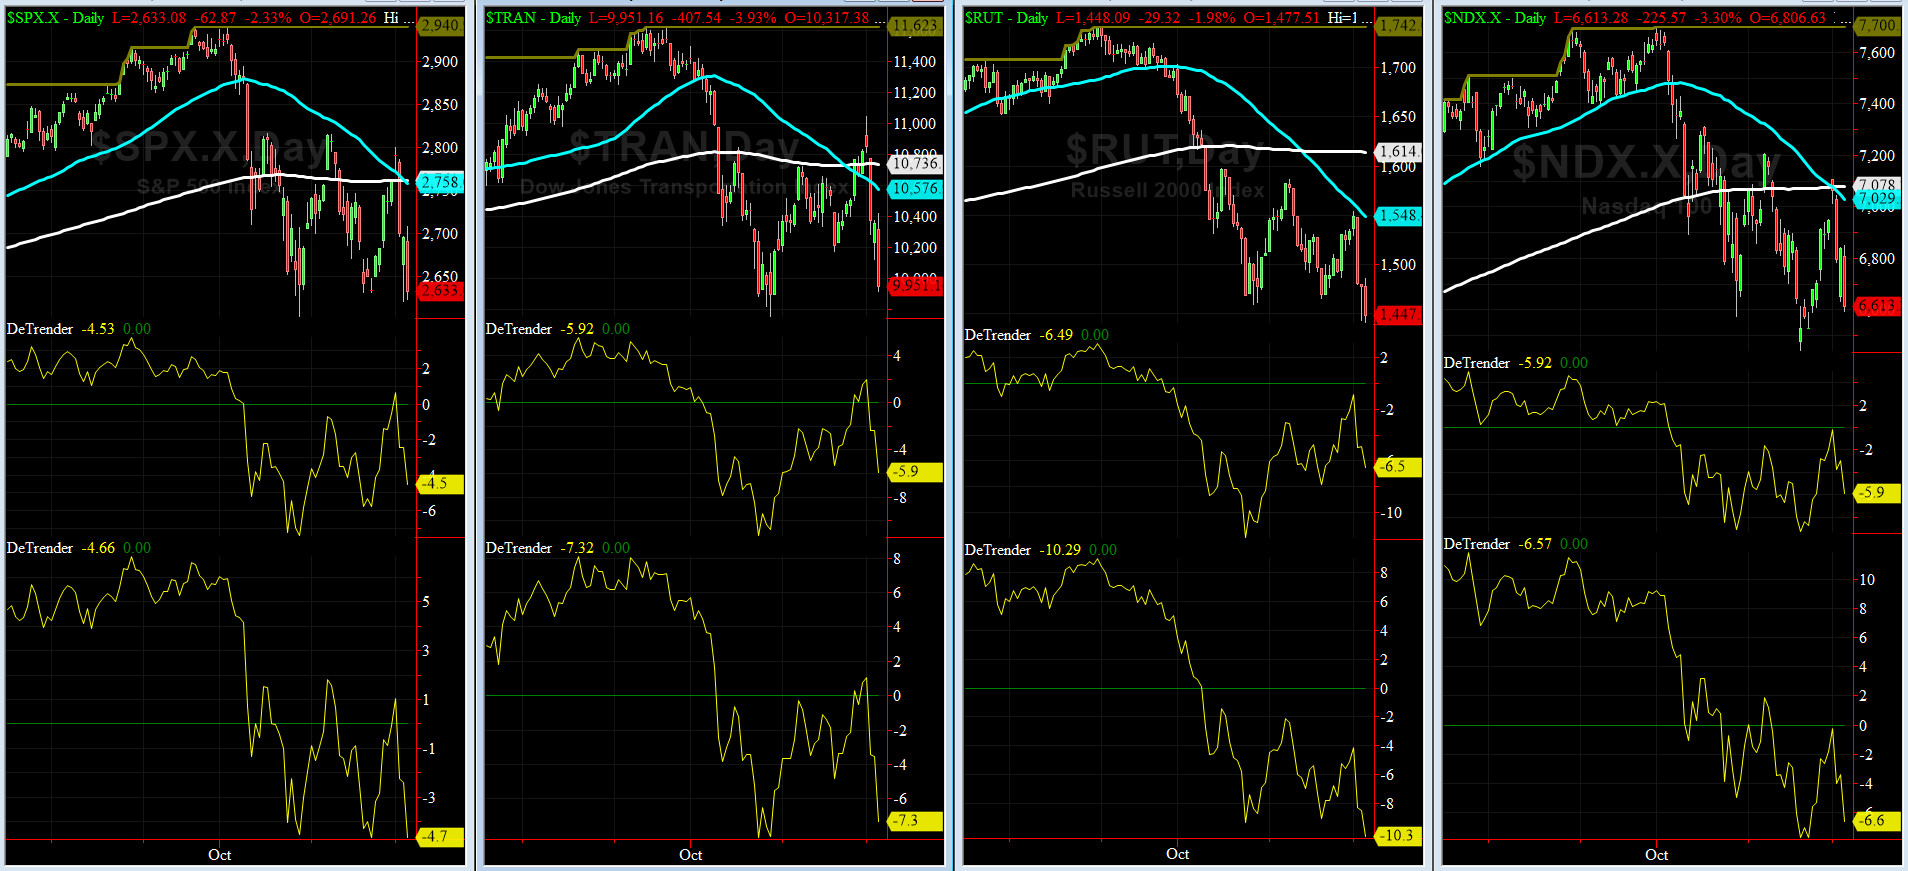
DeTrenders Charts for SPX, NDX, TRAN & RUT Indices
50-Day MA SPX = 2758 or 4.5% BELOW SPX (max observed in last 7 yrs = +8.6%, min = -9.3%)
200-Day MA SPX = 2761 or 4.7% BELOW SPX (max observed in last 7 yrs = 15.2%, min = -14%)
We are back to EIGHT out of EIGHT DeTrenders in the NEGATIVE territory. The DeTrenders for DJ Tran & RUT will continue to be harbingers of future price behavior in broad indices.
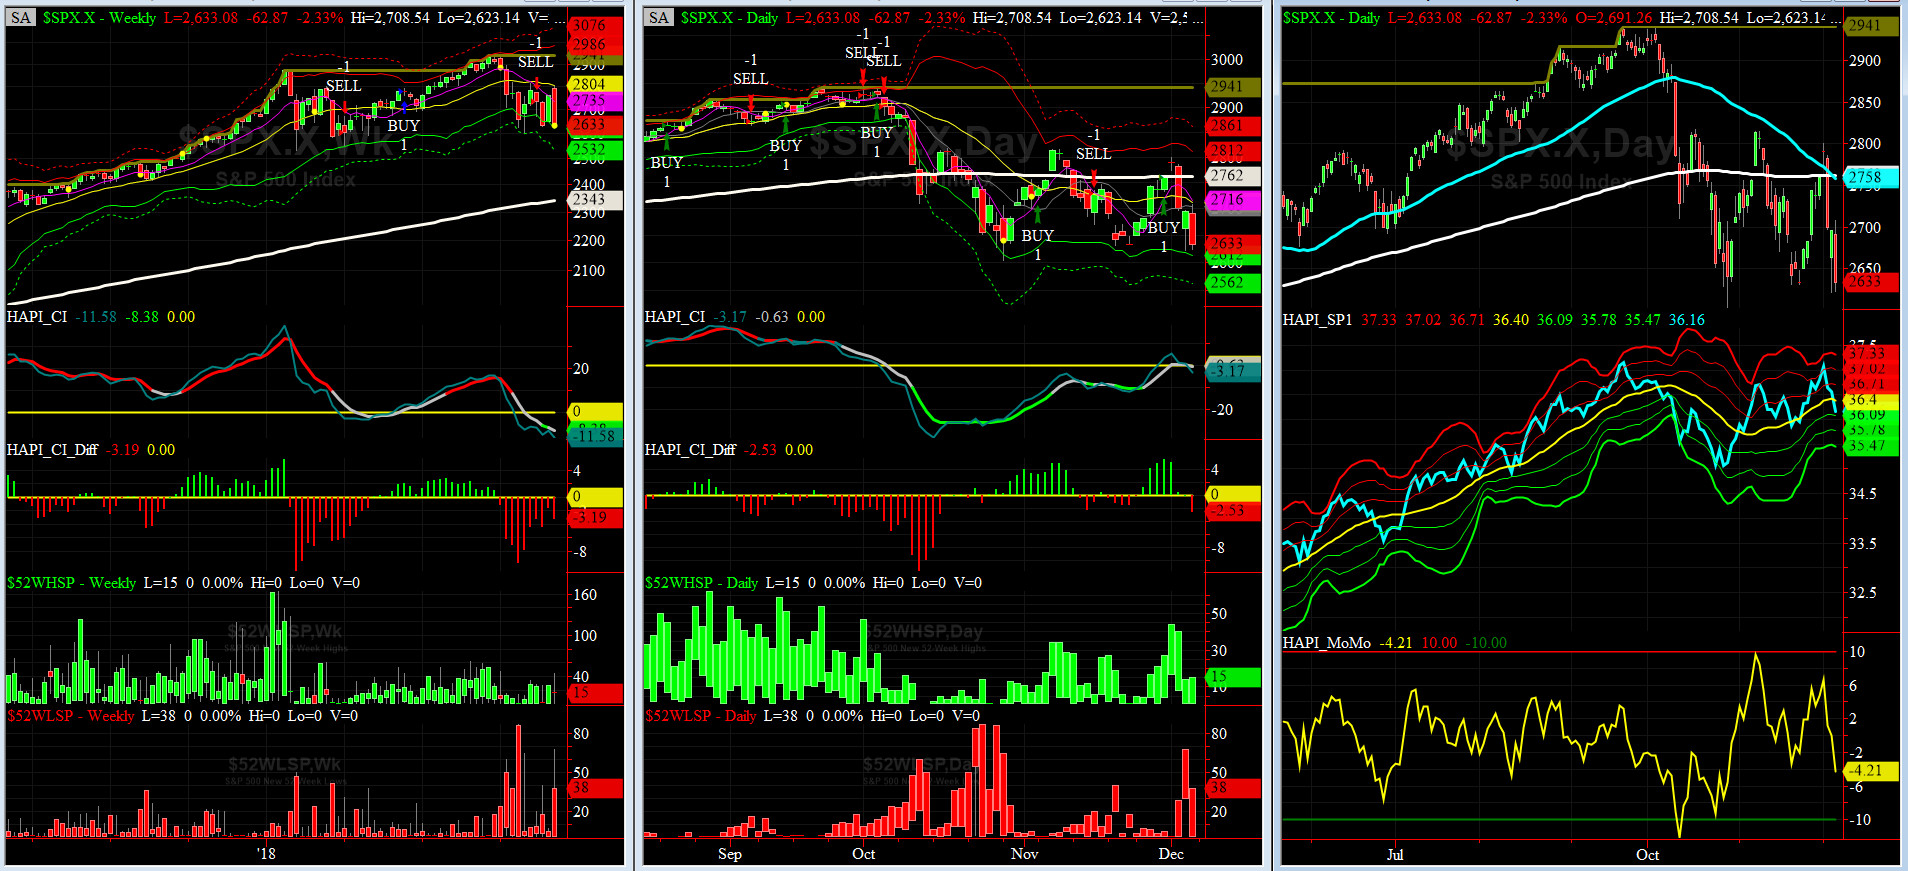
HA_SP1_Momo Chart
WEEKLY Timing Model = on a SELL Signal since Friday, November 16, 2018 CLOSE at 2736
DAILY Timing Model = on a BUY Signal since Friday, November 30, 2018 CLOSE at 2760
Max SPX 52wk-highs reading last week = 44 (over 120-140, the local maxima is in)
Max SPX 52wk-Lows reading last week = 68 (over 40-60, the local minima is in)
HA_SP1 closed near its -1 sigma channels
HA_Momo = -4.2 (reversals most likely occur above +10 or below -10)
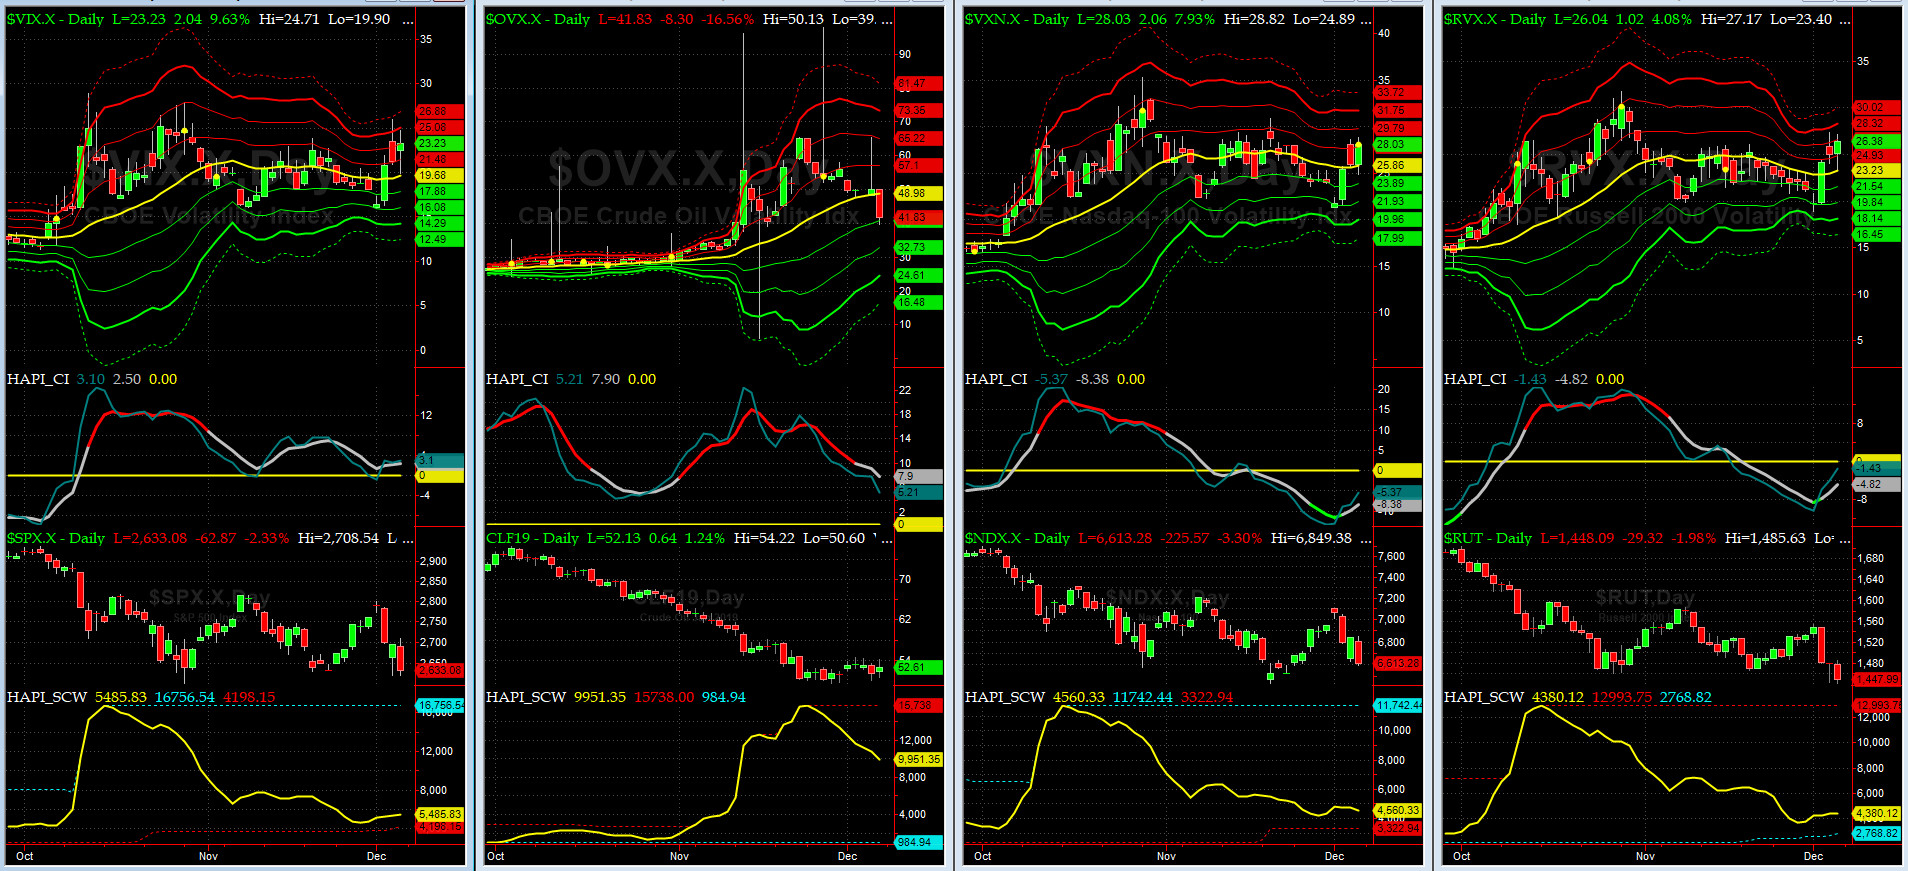
Vol of the Vols Chart
Spot VIX currently stands at 23.2, at about its +2 sigma (remember it's the VIX volatility pattern aka "its sigma channels" that matters, and not the level of VIX itself (this is per Dr. Robert Whaley, a great mentor and inventor of original VIX, now called VXO). VIX usually peaks around a test of its +4 sigma).
VIX & VXN both upticked last week but did not put spikes like one would expect given our hard sell-offs.
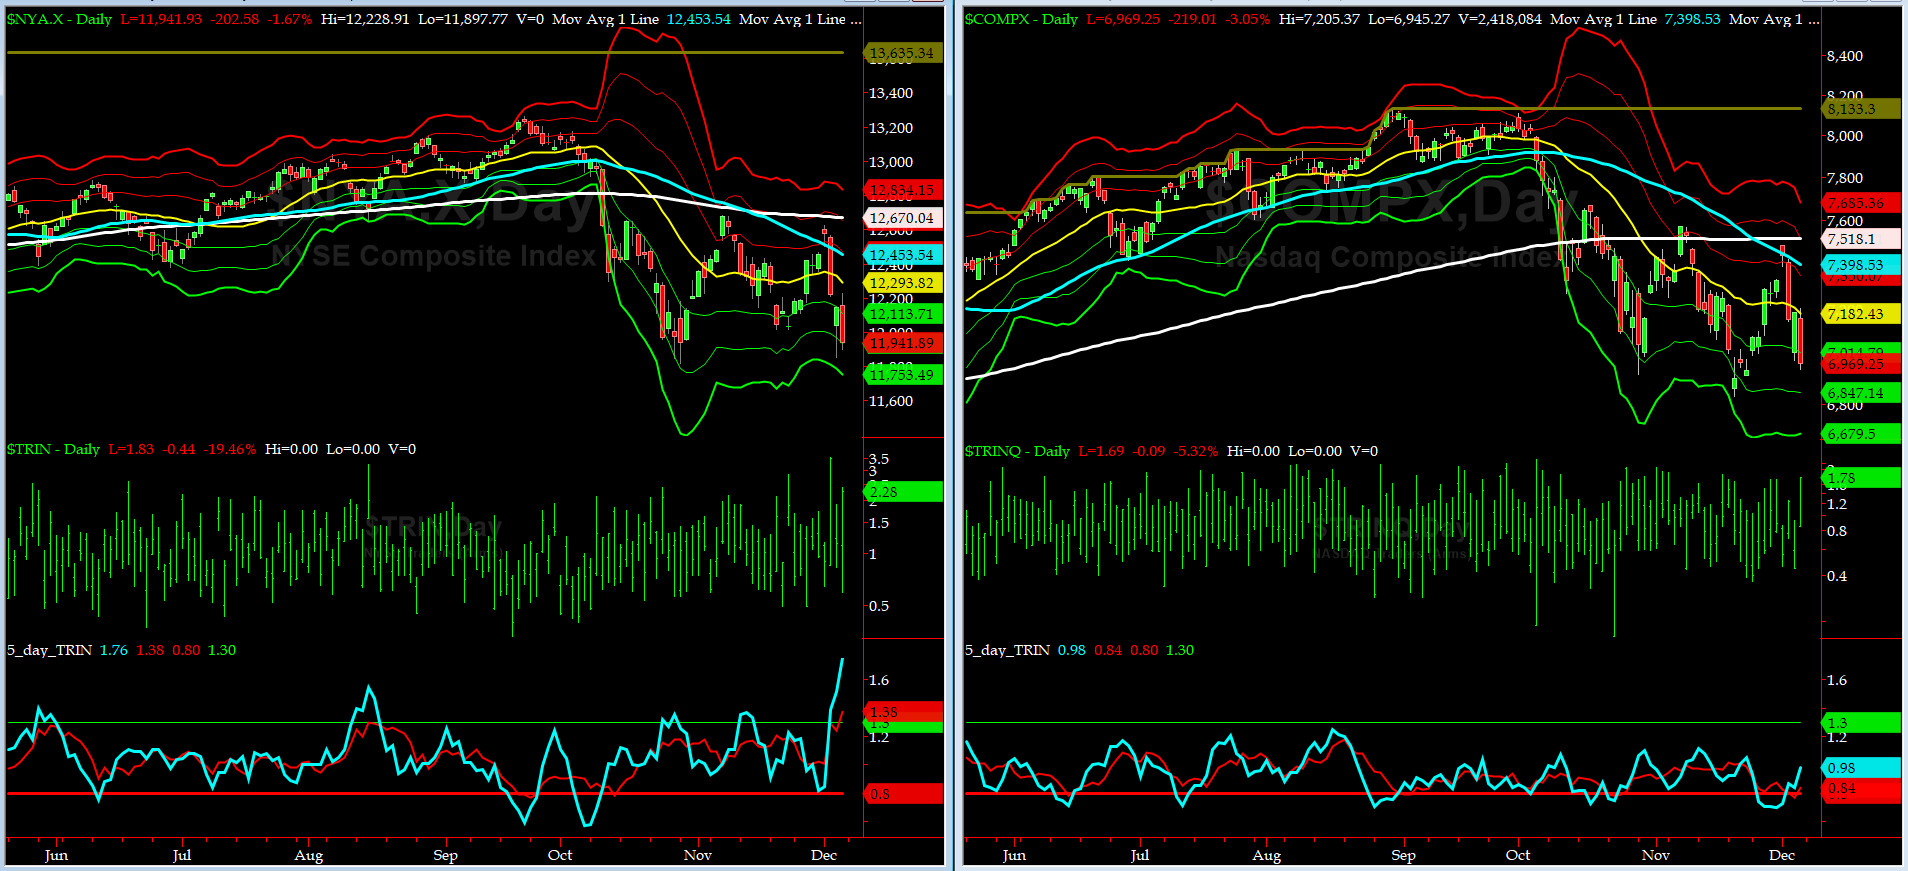
5-day TRIN & TRINQ Charts
NYSE 5-day TRIN is in a BUY zone but NASDAQ 5-day TRINQ is in NEUTRAL zone.
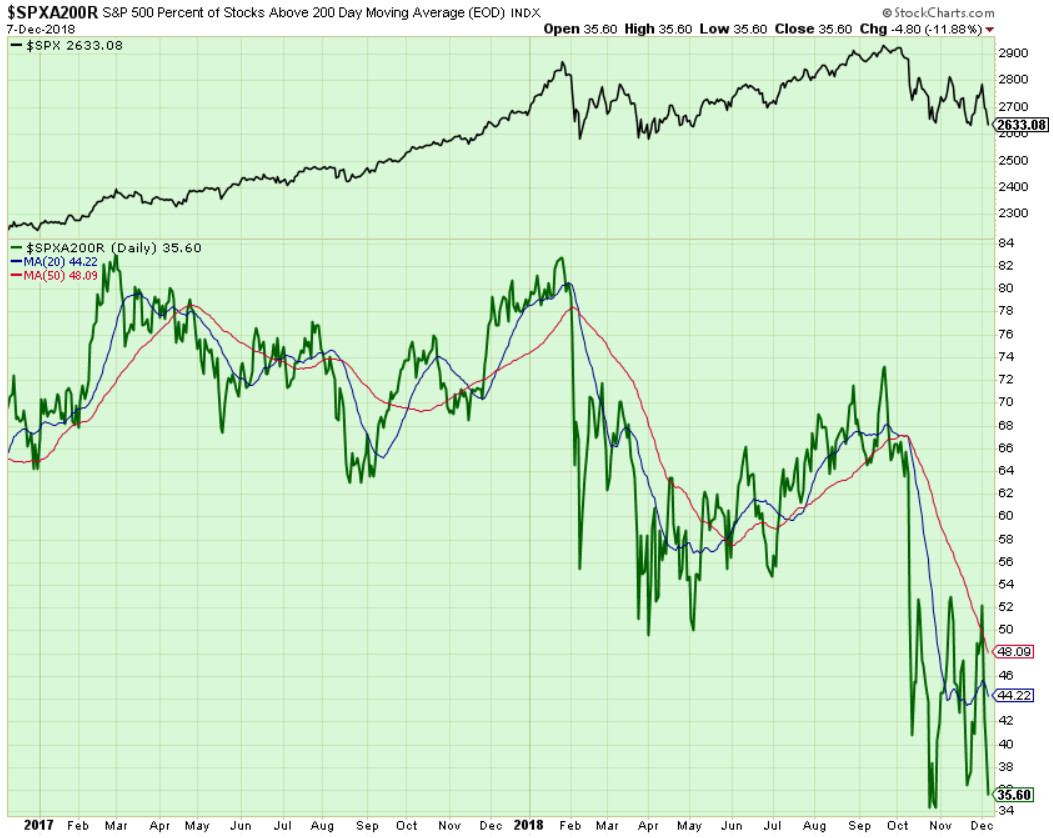
Components of SPX above their respective 200day MA Chart
This scoring indicator rallied to 35.6% area. This is no longer in the NEUTRAL zone and has moved into negative reading here.
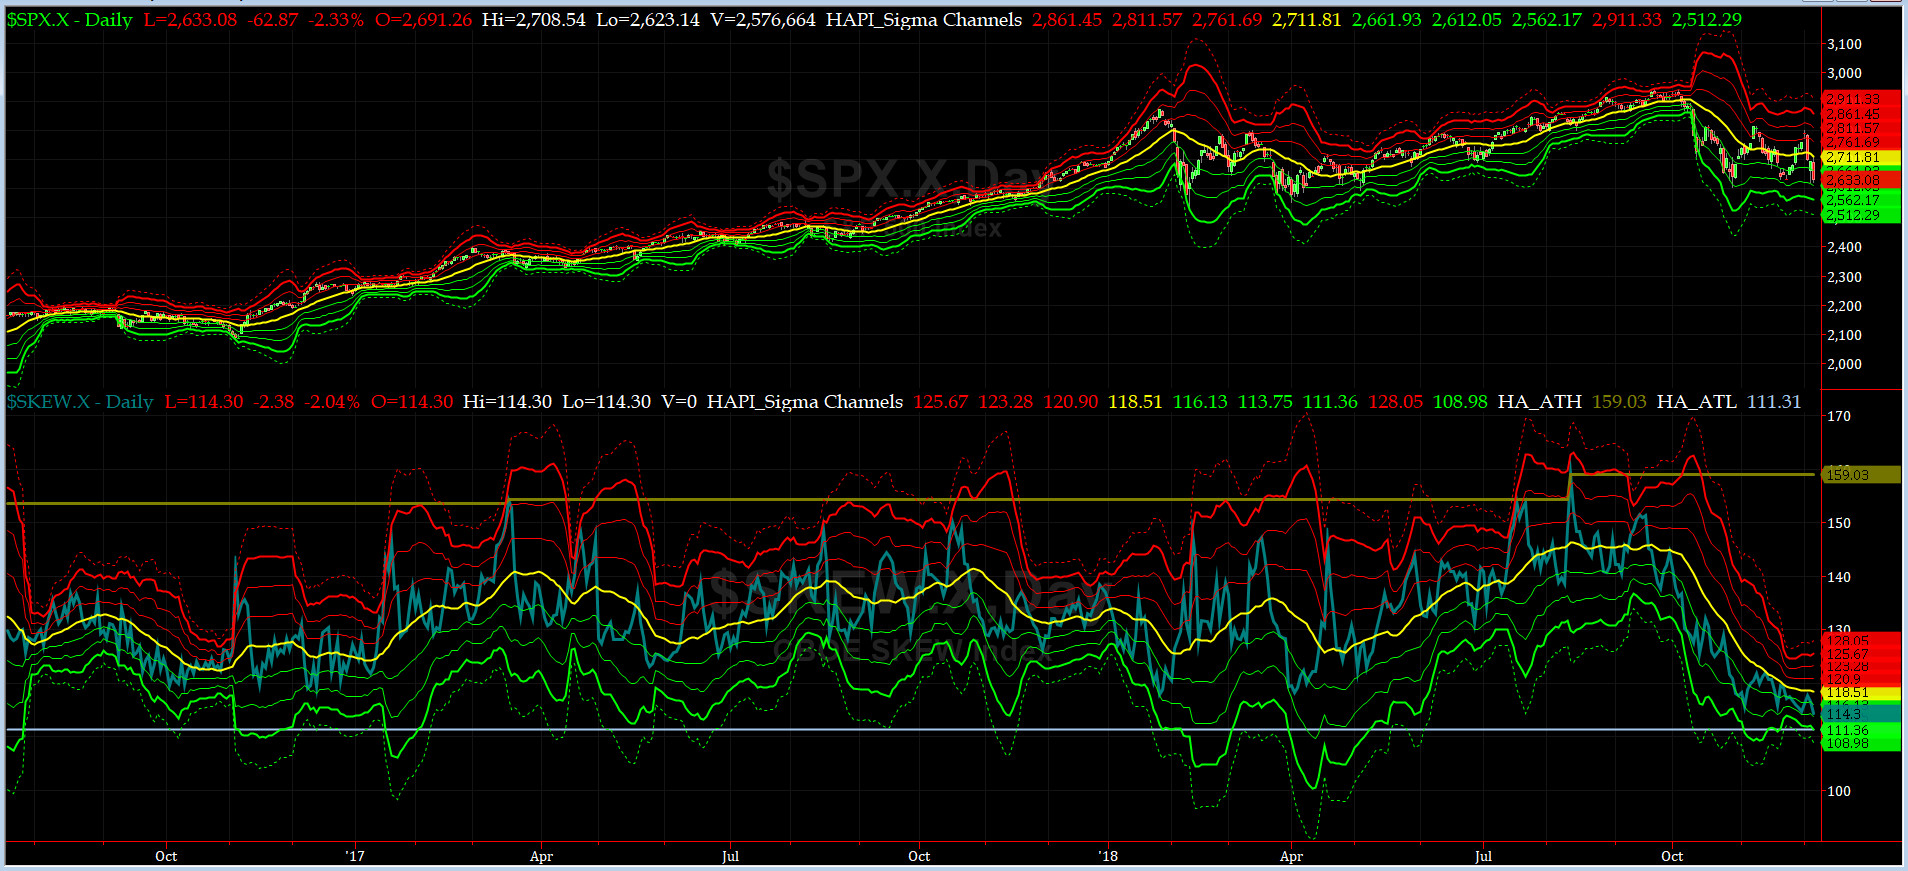
SPX SKEW (Tail Risk) Chart
On Friday, SPX SKEW (Tail Risk) closed near 114.3, still about its -2 sigma (normal = 120-125, range 100-150).
Is all quiet on the Eastern & Mid-Western Fronts? Our beloved @Capt_Tiko is a tad puzzled here by this reading here....stay tuned.
How to interpret the value of SPX SKEW? (from CBOE white paper on SKEW)

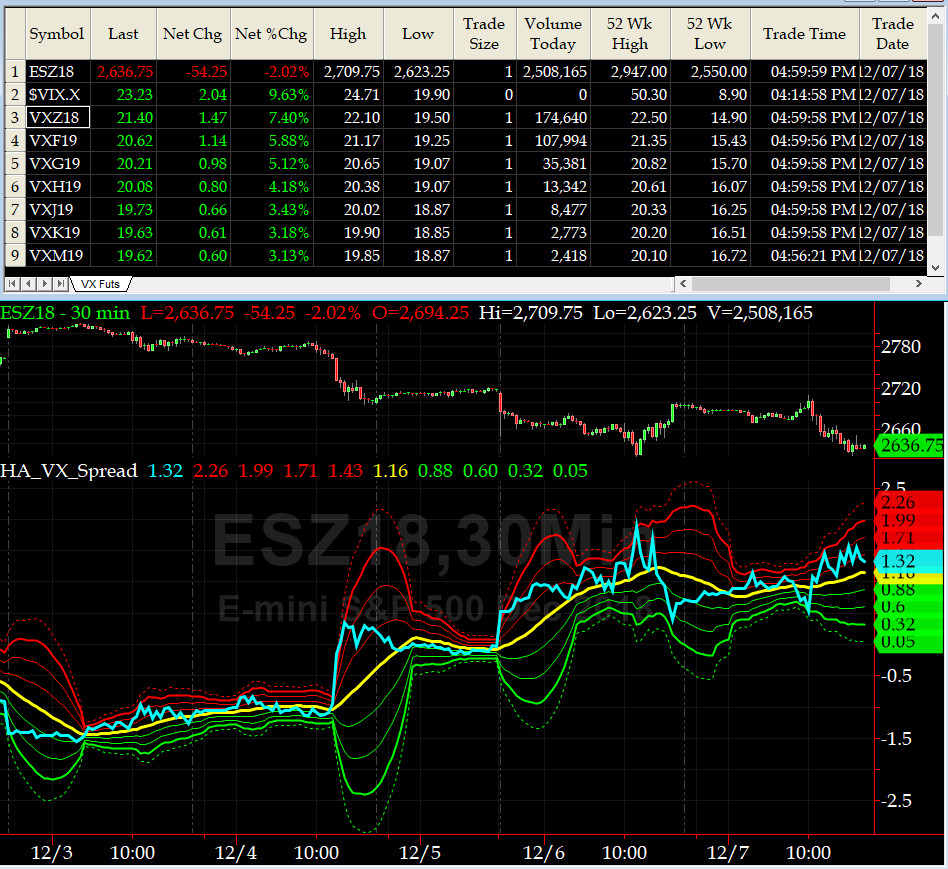
3-month VIX Futures Spread(VX) Chart
This popular timing indicator, (long DEEZ18, & short MAR19 VIX Futures) closed at +1.32 which says SPX is OVERSOLD.

HA_SP2 Chart
HA_SP2 = 27.7 (Buy signal <= 25, Sell Signal >= 75)
Our coveted SP2 prop indicator sank from 75+ to 27 in 3 trading days. Way to go Robert Swan Mueller,III. Like other Cottage Men we know, he is very decisive and takes no prisoners.
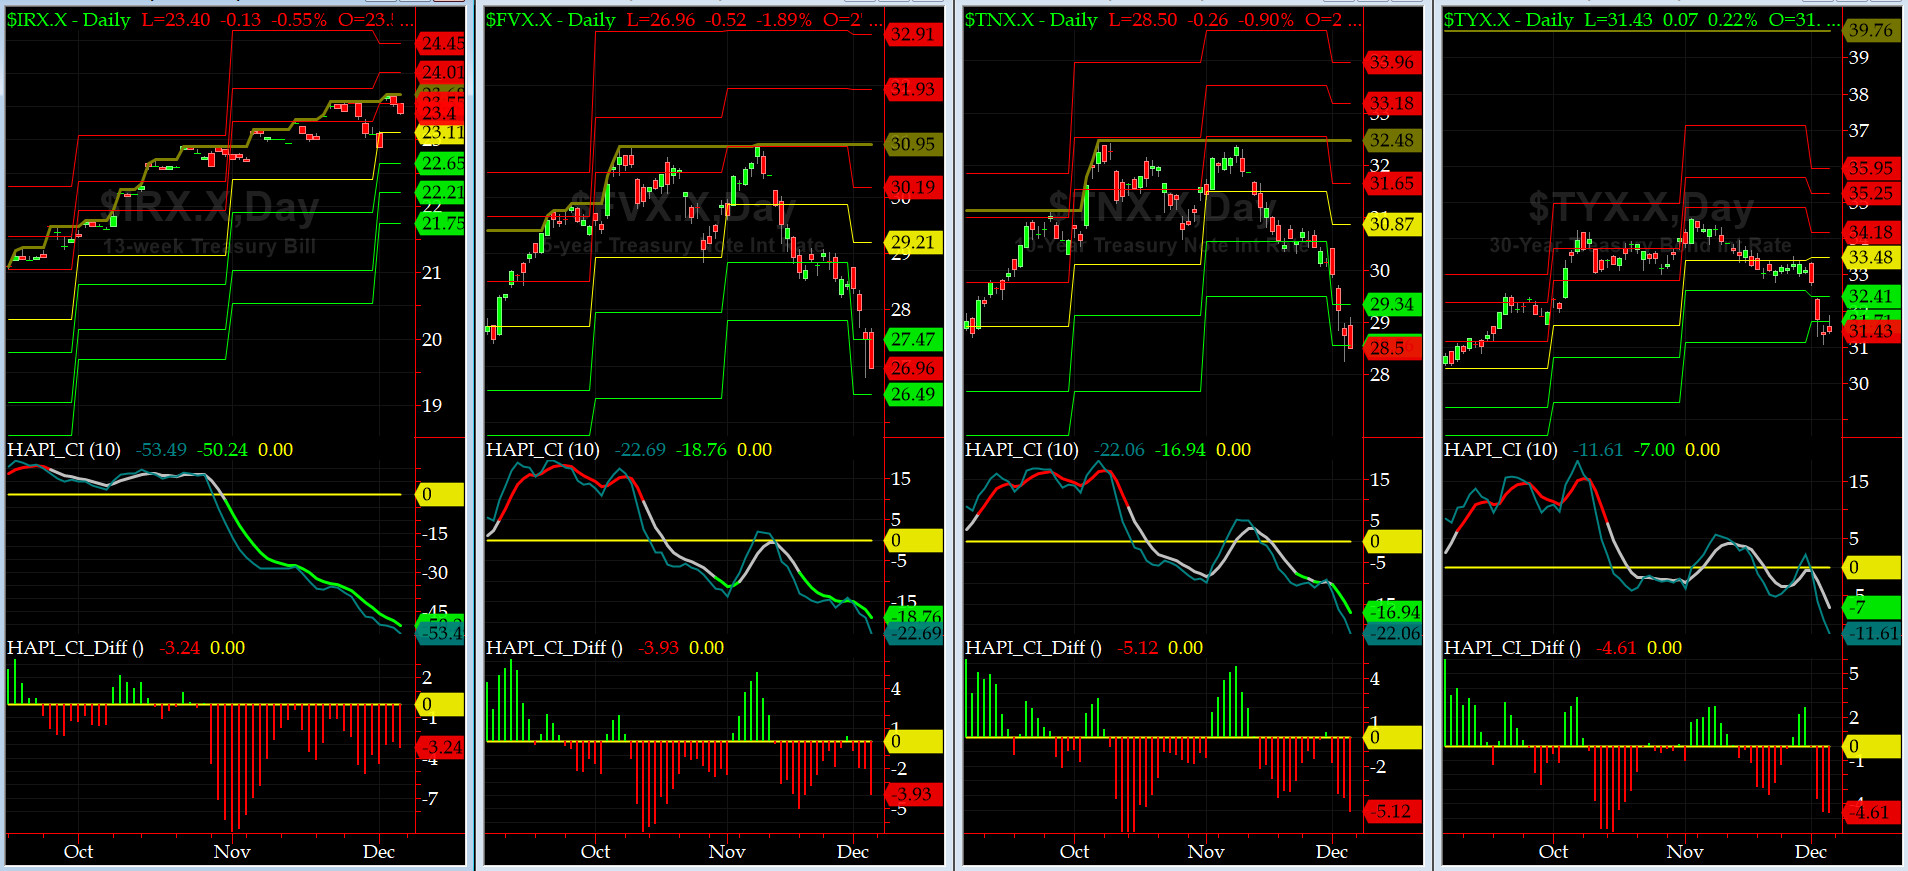
US Treasury T-Notes & T-Bonds Yields Chart
Flight-to-safety trades this past week crushed the YTMs & we doubt Fed is ready to push up FF here. Mr & Mrs Maury are entering another marriage counseling soon, this time in a group session as Vigs are crushed too.
Fari Hamzei
|
|
|
|
|
|
Customer Care:
|
|
|
|
|
|
|
 |
 |
|
 |
|
 |
 |
 |
HA YouTube Channel ::: HA Blog ::: Testimonials ::: Tutorials & FAQs ::: Privacy Policy
|
Trading Derivatives (Options & Futures) contains substantial risk and is not for every investor. An investor could potentially lose all or more than his/her initial investment.
Only risk capital should be used for trading and only those with sufficient risk capital should consider trading derivatives. Past performance is not
necessarily indicative of future results. Testimonials appearing on this website may not be representative of other clients or customers
and are not a guarantee of future performance or success.
|
| (c) 1998-2025, Hamzei Analytics, LLC.® All Rights Reserved. |
|
|