|
Sunday, January 27, 2019, 1530ET
Market Timing Charts, Analysis & Commentary for Issue #277
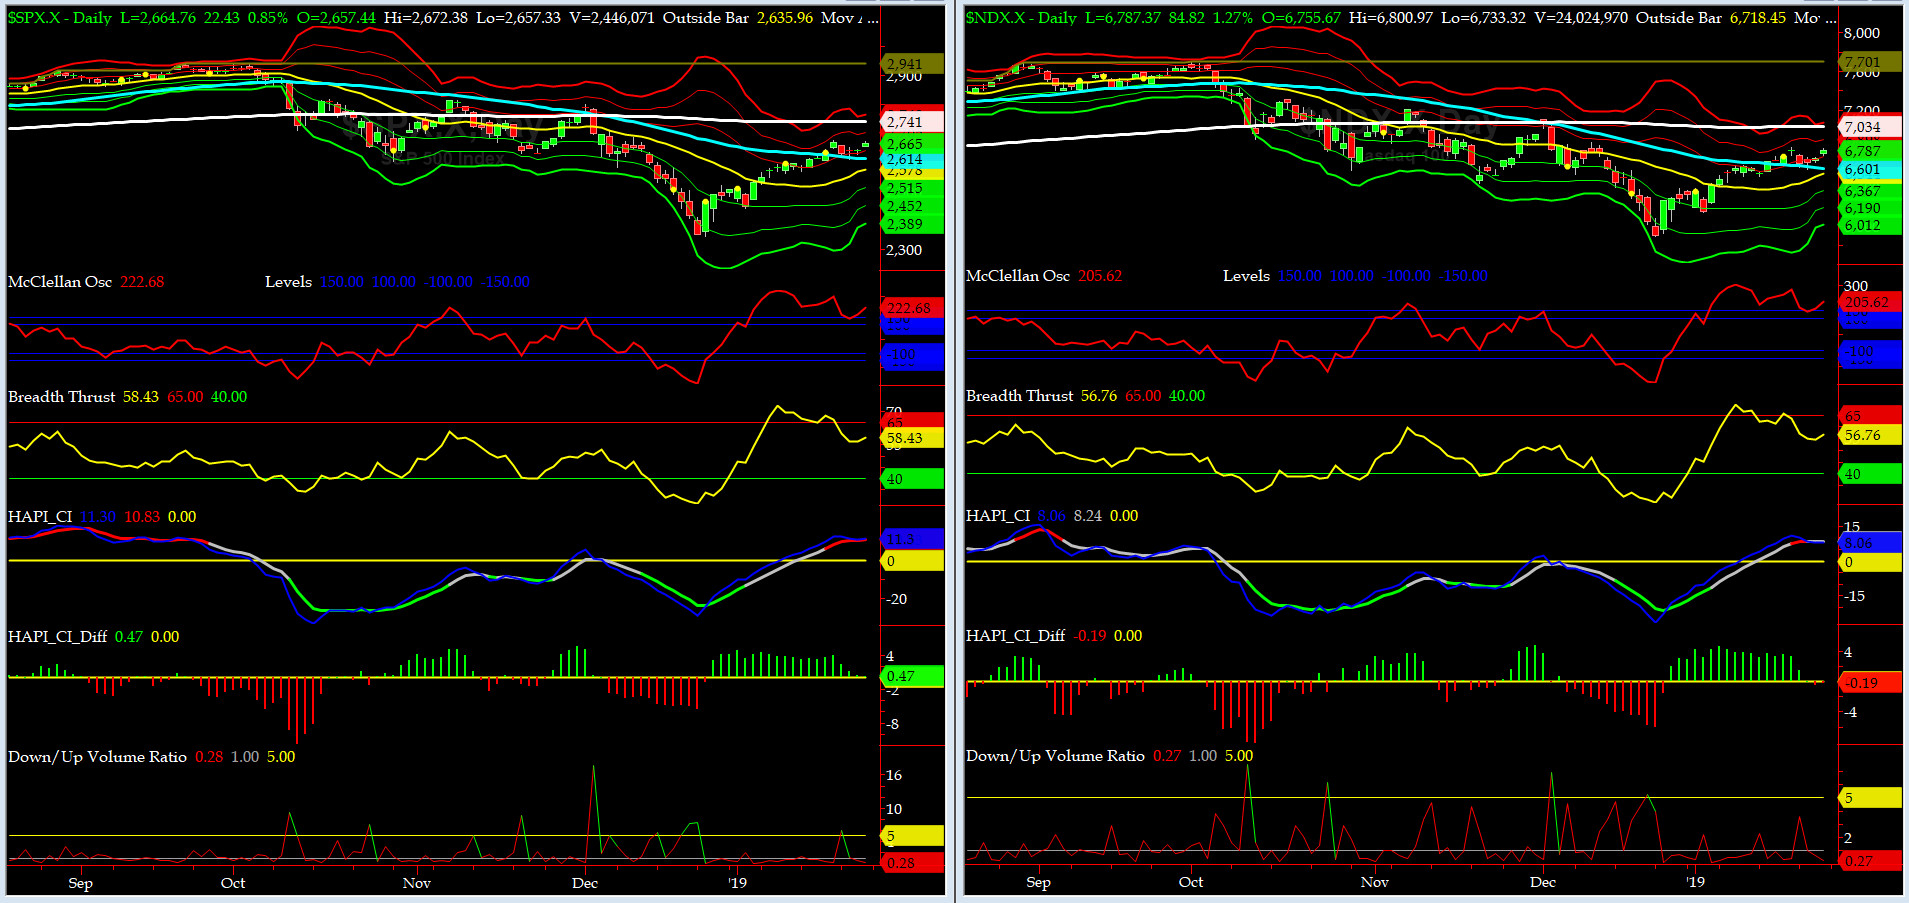
Timer Charts of S&P-500 Cash Index (SPX) + NASDAQ-100 Cash Index (NDX)
Most recent S&P-500 Cash Index (SPX): 2665 down -5 (down zero%) for the week ending on Friday, January 25, 2019, which closed about its +1.5 sigma.
DJIA ALL TIME INTRADAY HIGH = 26951 (reached on Wednesday, October 3, 2018)
DJ TRAN ALL TIME INTRADAY HIGH = 11623 (reached on Friday, September 14, 2018)
SPX ALL TIME INTRADAY HIGH = 2941 (reached on Friday, September 21, 2018)
NDX ALL TIME INTRADAY HIGH = 7700 (reached on Thursday, October 1, 2018)
RUT ALL TIME INTRADAY HIGH = 1742 (reached on Friday, August 31, 2018)
Current DAILY +2 Sigma SPX = 2705 with WEEKLY +2 Sigma = 2980
Current DAILY 0 Sigma SPX = 2578 with WEEKLY 0 Sigma = 2703
Current DAILY -2 Sigma SPX = 2452 with WEEKLY -2 Sigma = 2426
NYSE McClellan Oscillator = +221 (-150 is start of the O/S area; around -275 to -300 area or lower, we go into the �launch-pad� mode; over +150, we are in O/B area)
NYSE Breadth Thrust = 58.4 (40 is considered as oversold and 65 as overbought)
With USGov self-inflicted shutdown over (albeit for next 3 weeks), and upcoming FOMC Meeting this week, the question now becomes how does a flexible, data-dependent FED, makes a call re any potential interest rate change while flying blind (most econ data has been delayed for 5 weeks now)? a key number on our radar will be JAN NFP, due this Friday (CE is +158K).
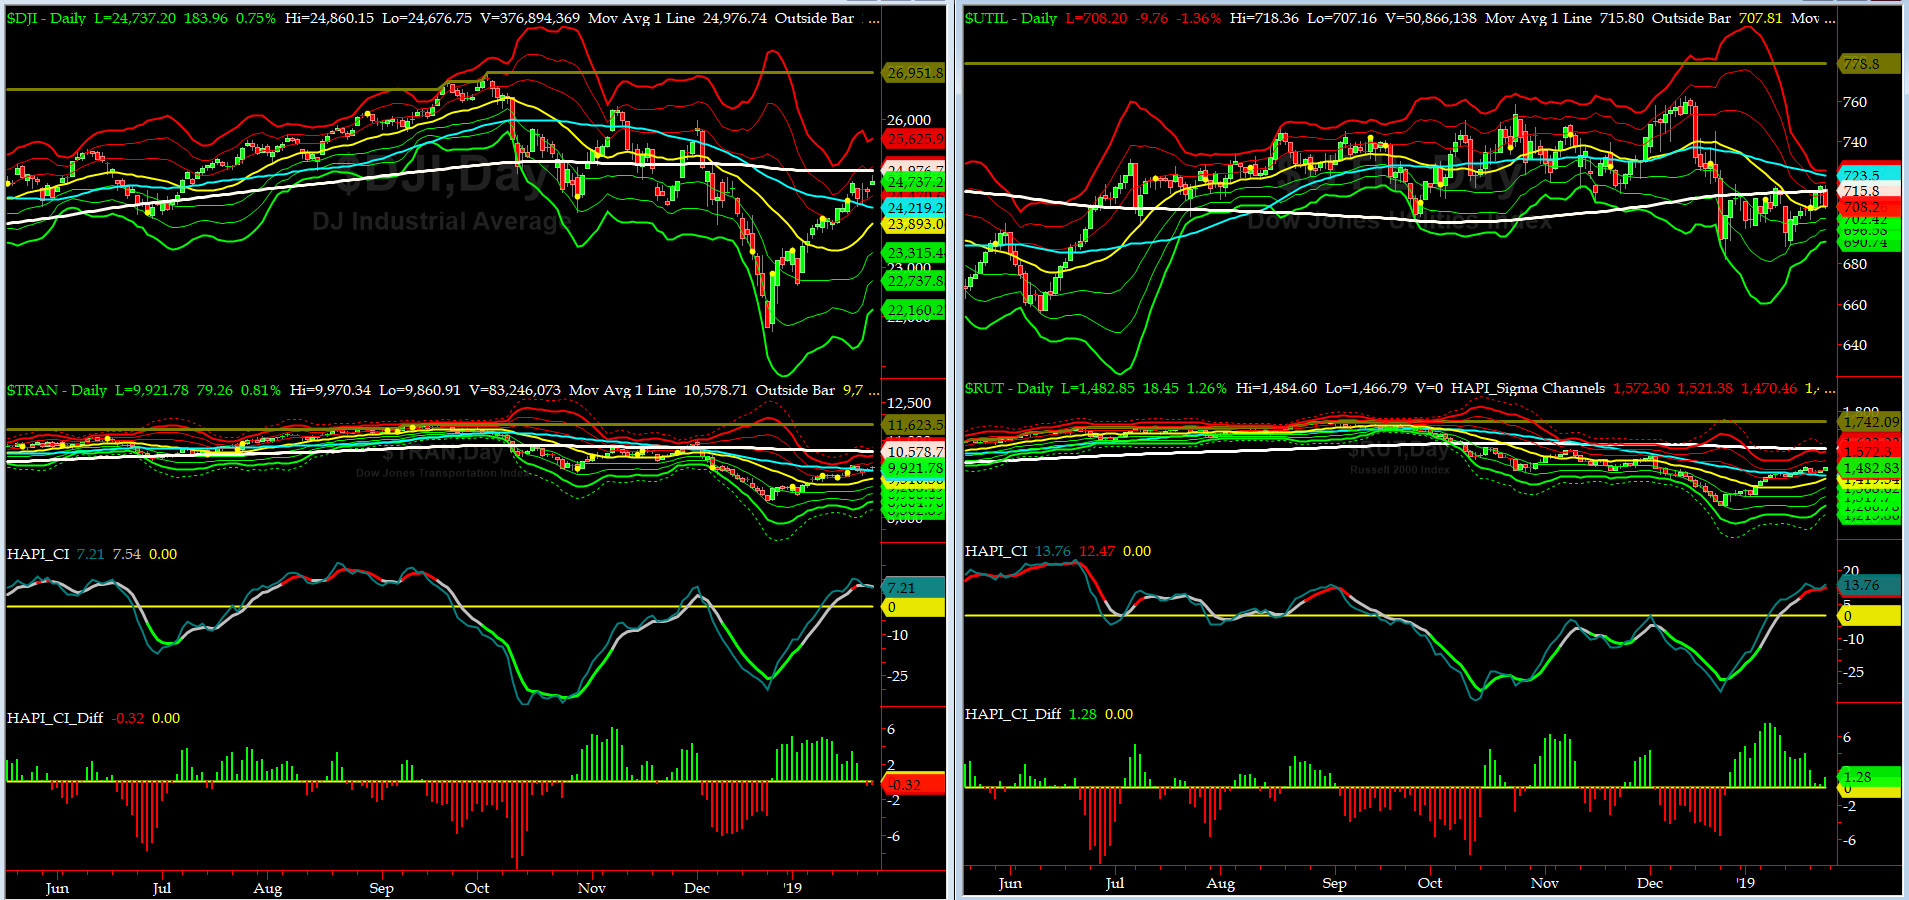
Canaries [in the Coal Mine] Chart for DJ TRAN & RUT Indices
200-Day MA DJ TRAN = 10,578 or 6.2 ABOVE DJ TRAN (max observed in last 7 yrs = 20.2%, min = -20.3%)
200-Day MA RUT = 1590 or 6.8% ABOVE RUT (max observed in last 7 yrs = 21.3%, min = -22.6%)
DJ Transportation Index (proxy for economic conditions 6 to 9 months hence) went nowhere fast and just vacillated around its 50Day MA.
Russell 2000 Small Caps Index (proxy for Risk ON/OFF) exhibited same behavior as DJ TRAN. RISK is creeping back in.

DeTrenders Charts for SPX, NDX, TRAN & RUT Indices
50-Day MA SPX = 2613 or 1.9% BELOW SPX (max observed in last 7 yrs = +8.6%, min = -9.3%)
200-Day MA SPX = 2741 or 2.8% ABOVE SPX (max observed in last 7 yrs = 15.2%, min = -14%)
Four out of EIGHT of our DeTrenders (all 50DTs) are now in the NEGATIVE territory. The DeTrenders for DJ Tran & RUT will continue to be harbingers of future price behavior in broad indices.
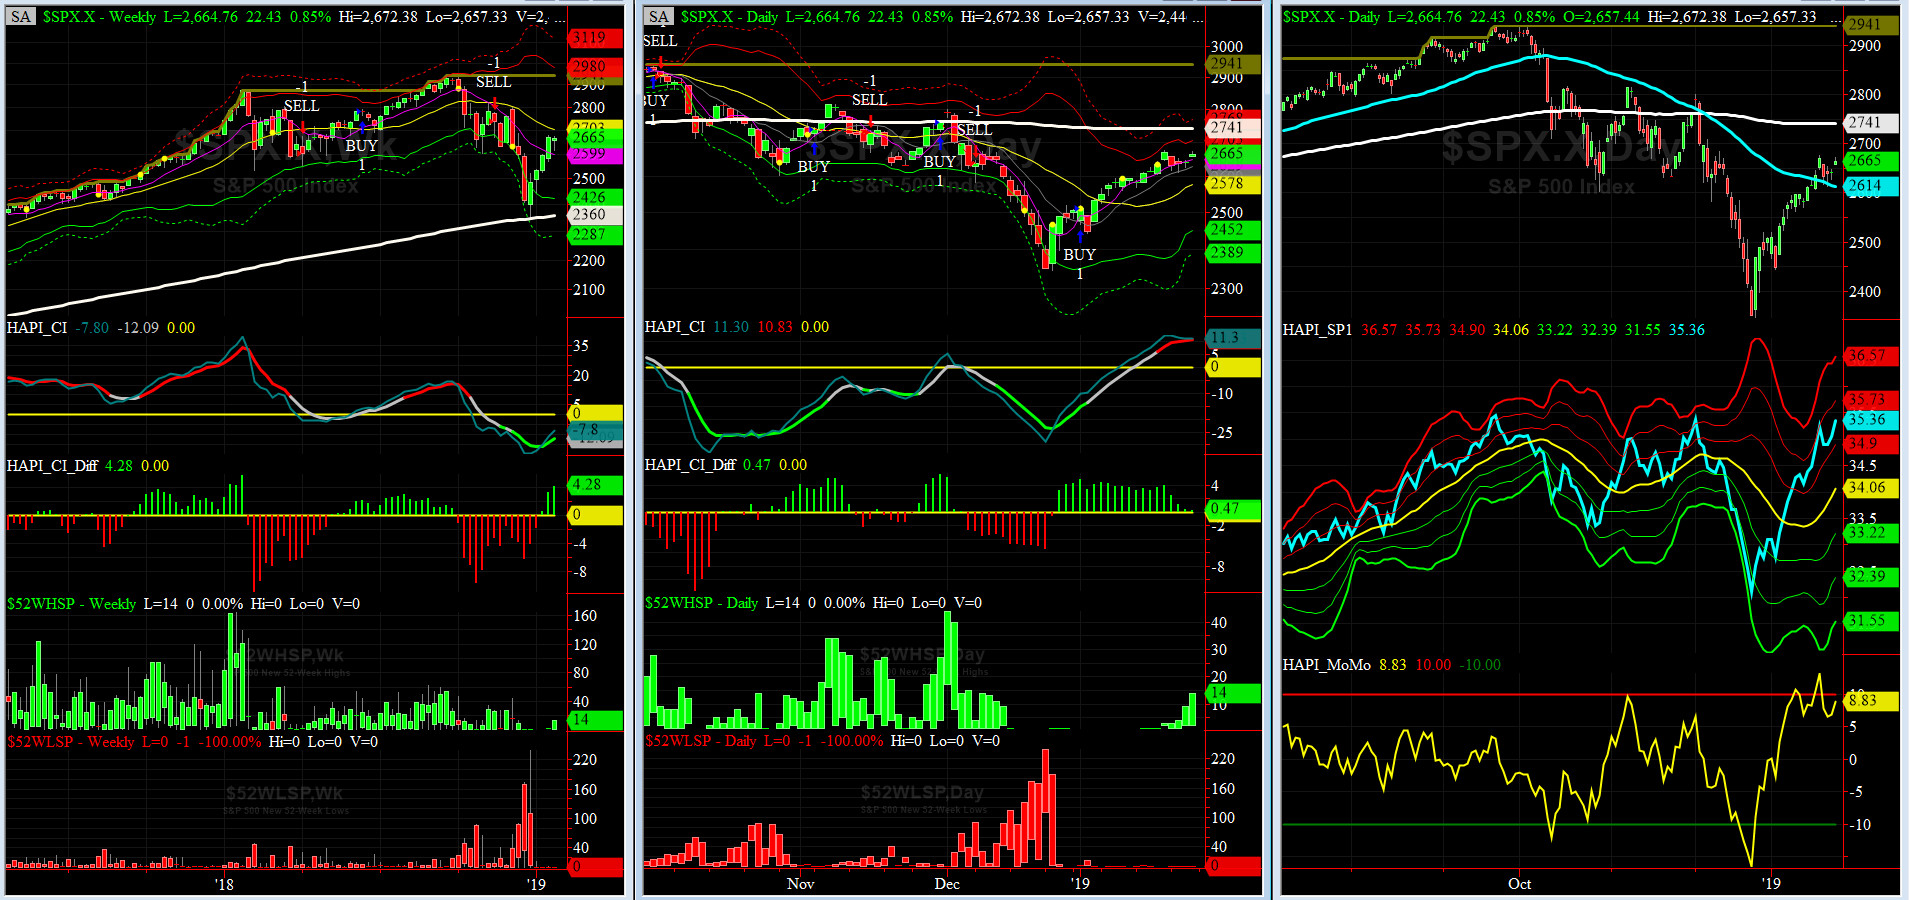
HA_SP1_Momo Chart
WEEKLY Timing Model = on a SELL Signal since Friday, November 16, 2018 CLOSE at 2736
DAILY Timing Model = on a BUY Signal since Wednesday, January 2, 2019 CLOSE at 2510
Max SPX 52wk-highs reading last week = 14 (over 120-140, the local maxima is in)
Max SPX 52wk-Lows reading last week = 0(over 40-60, the local minima is in)
HA_SP1 closed near its +1.5 sigma channels
HA_Momo = +8.83 (reversals most likely occur above +10 or below -10)
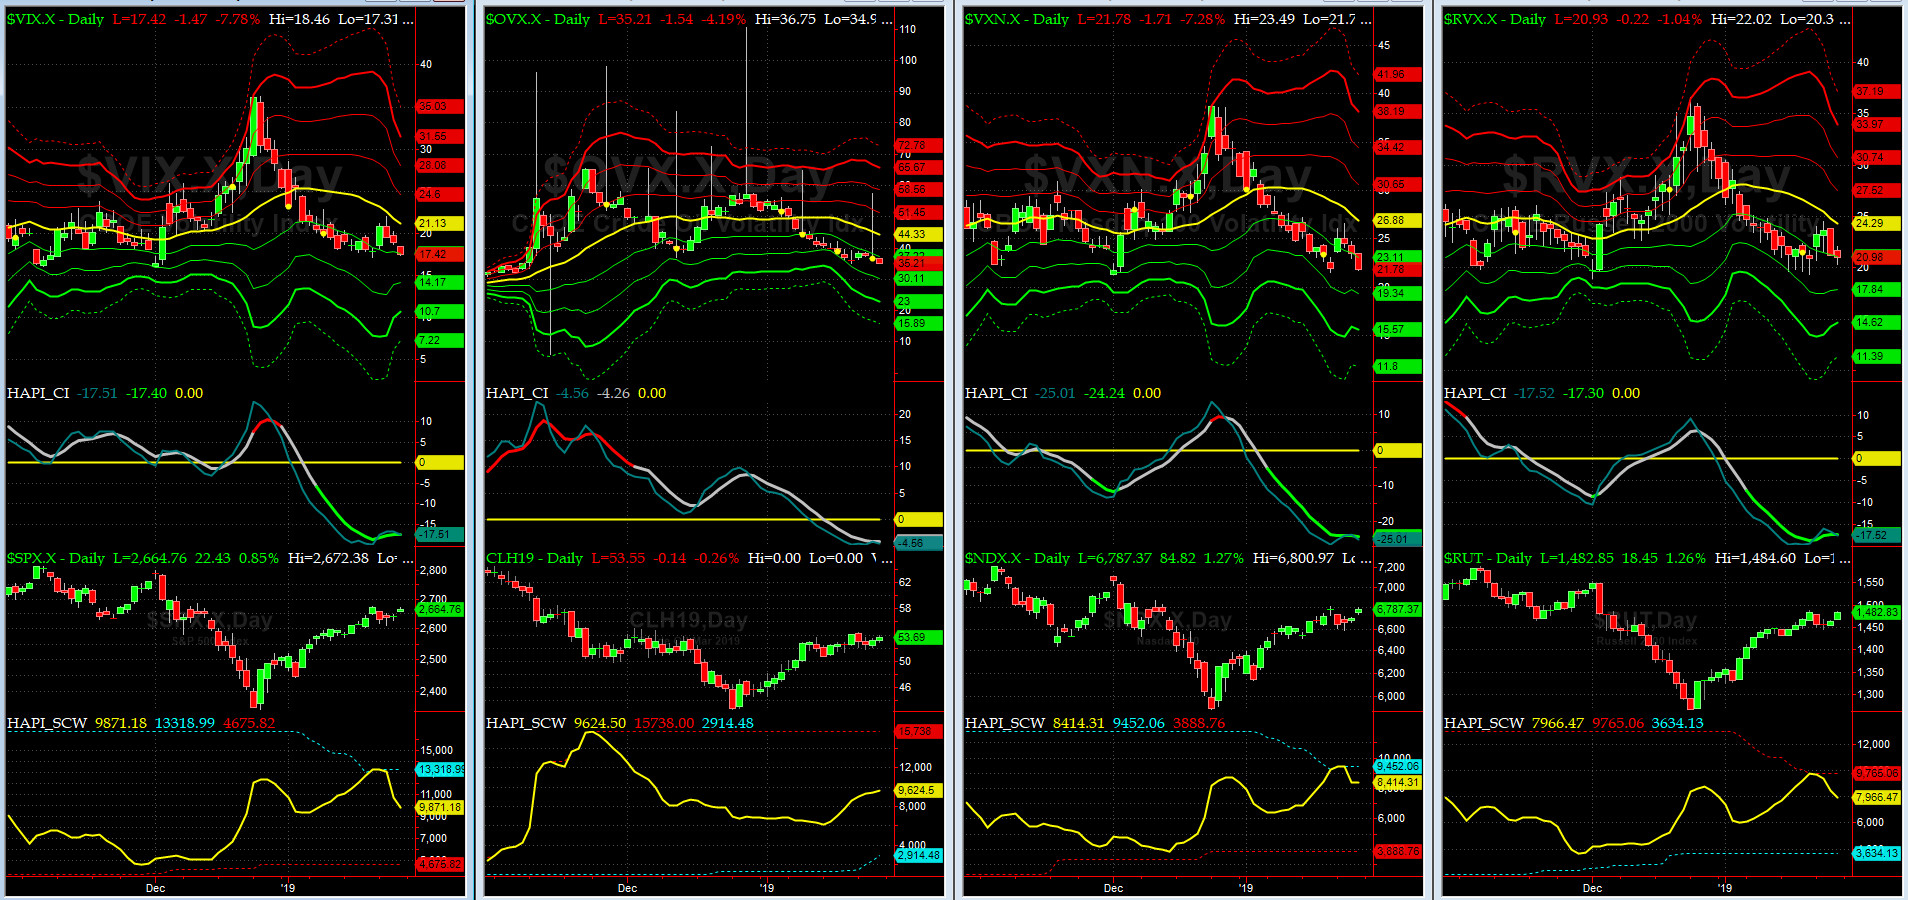
Vol of the Vols Chart
Spot VIX currently stands at 17.4, at about its -1 sigma (remember it's the VIX volatility pattern aka "its sigma channels" that matters, and not the level of VIX itself (this is per Dr. Robert Whaley, a great mentor and inventor of original VIX, now called VXO). VIX usually peaks around a test of its +4 sigma).
VIX saw a sudden ramp up but then died fast at its -1 sigma. VXN (VIX for NASDAQ) has a sharper move.
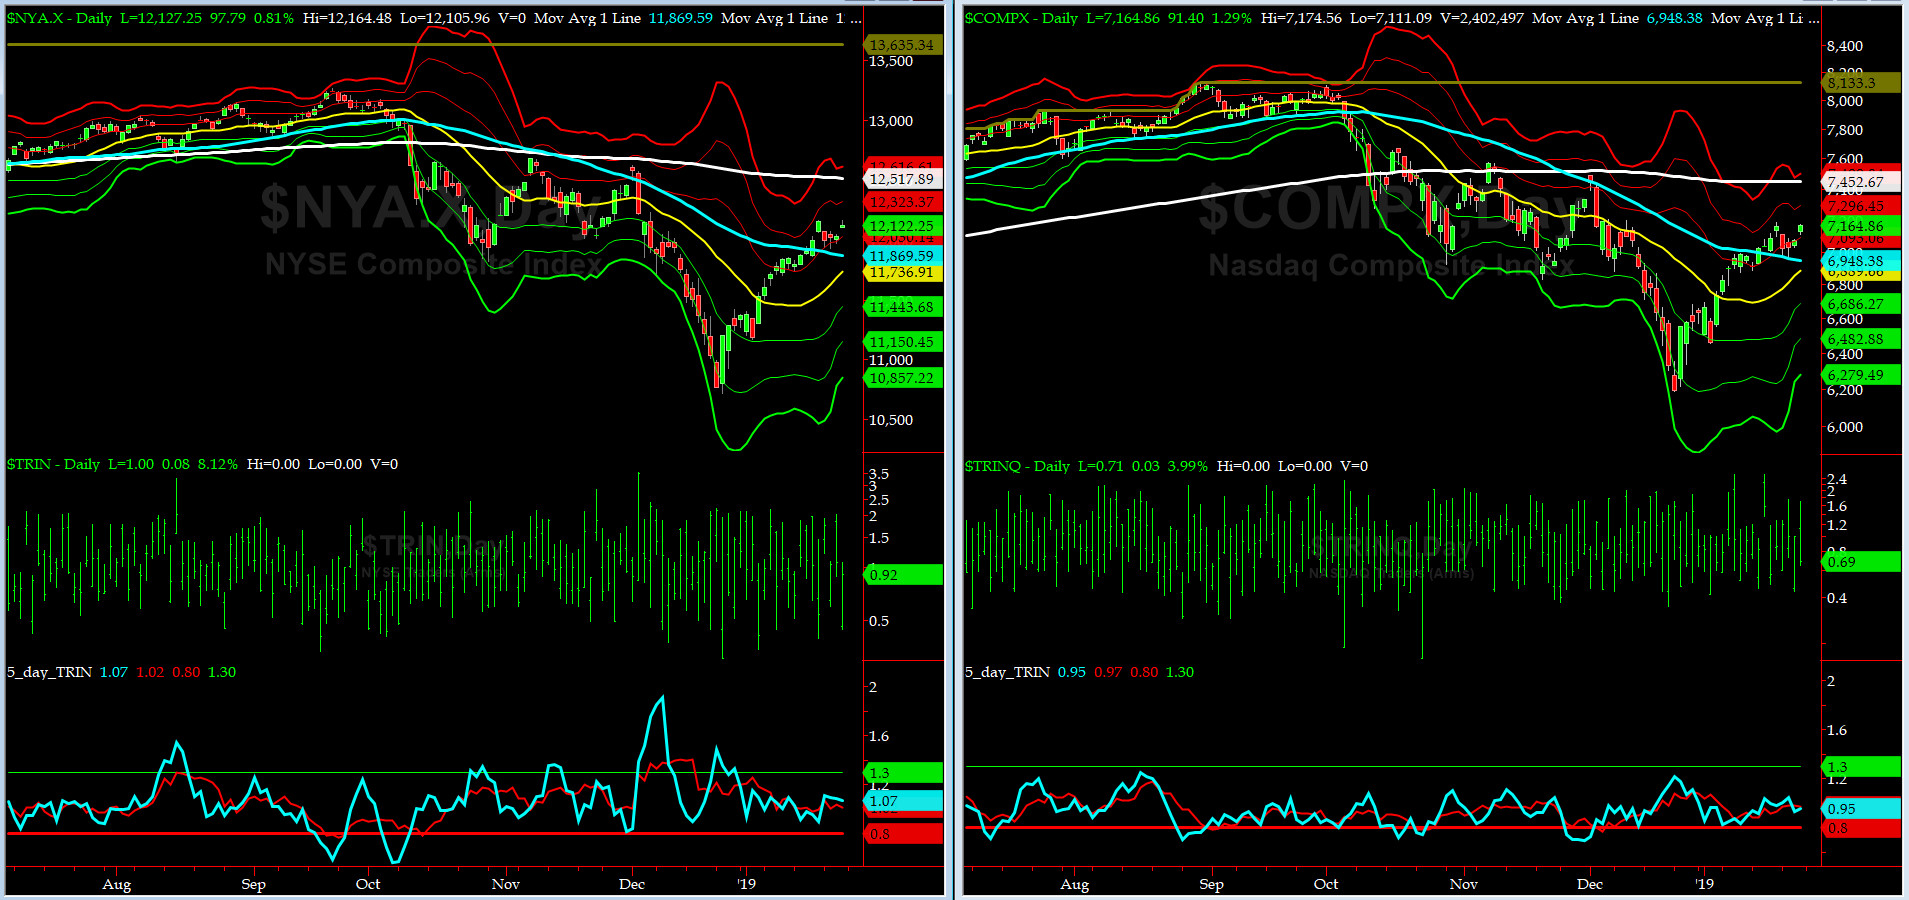
5-day TRIN & TRINQ Charts
Both NYSE & NASDAQ 5-day TRINs continue to be in NEUTRAL zones. No signal here.

Components of SPX above their respective 200day MA Chart
This scoring indicator rallied to 41.4% area. Next target is 45% to 50% area.
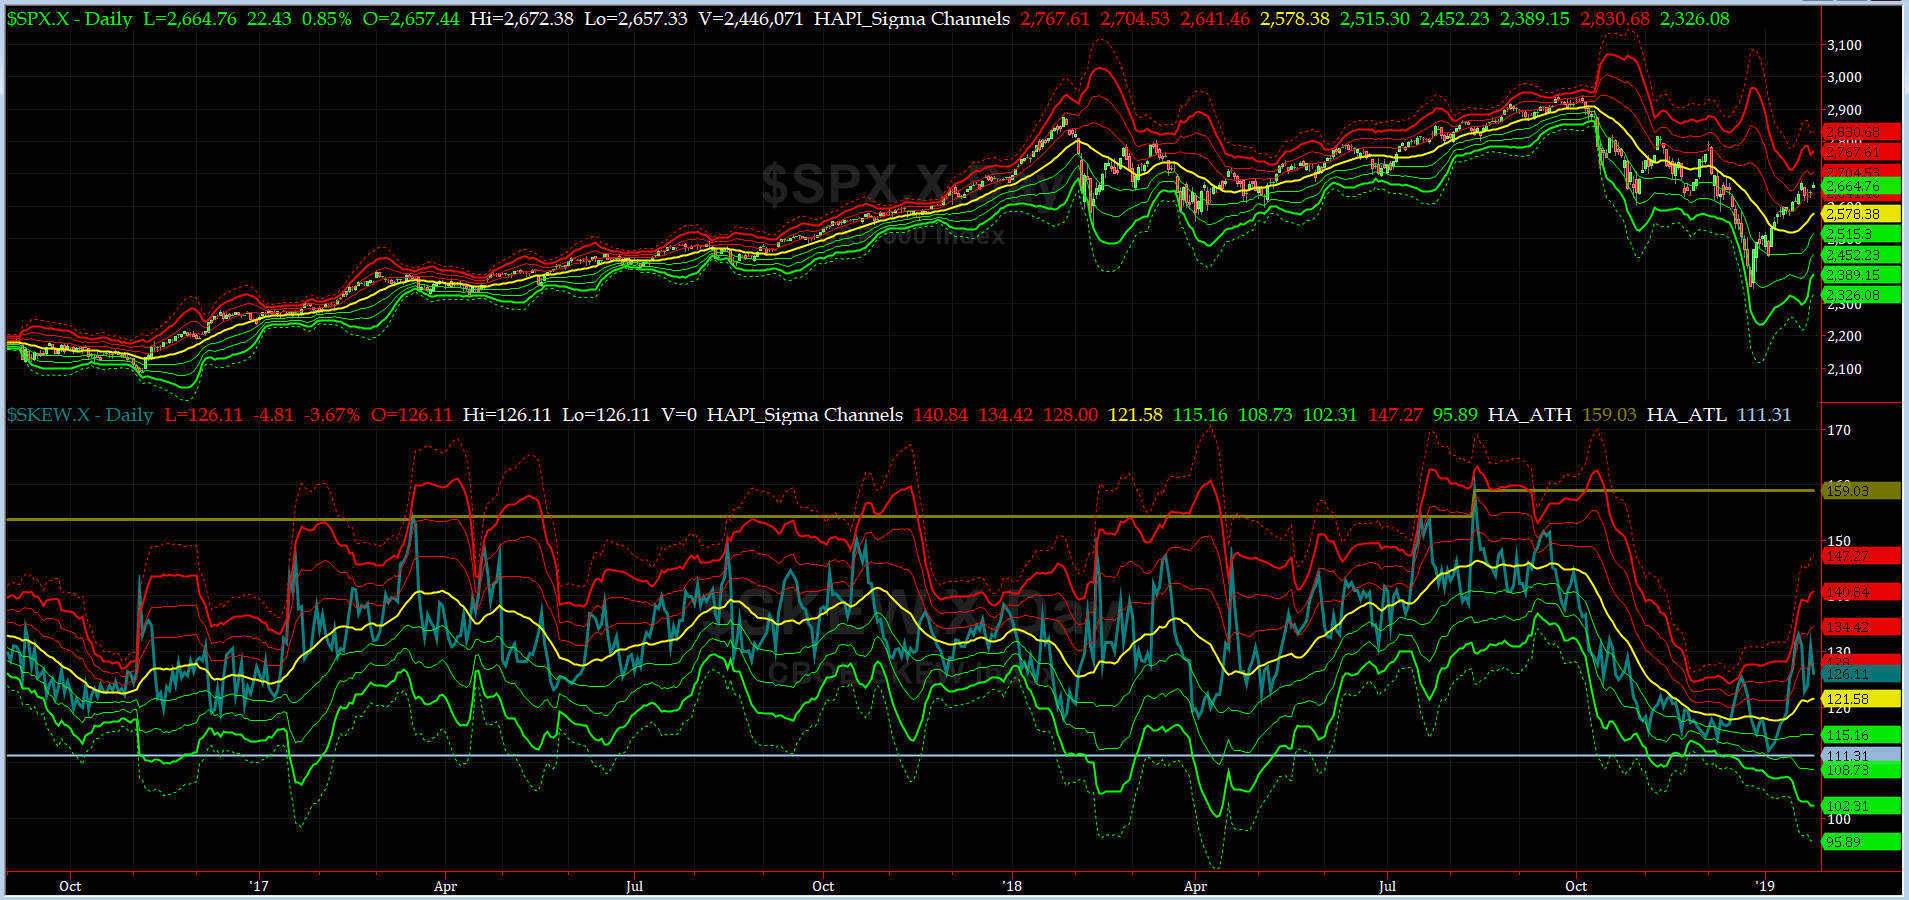
SPX SKEW (Tail Risk) Chart
On Friday, SPX SKEW (Tail Risk) closed near 126.1, now about its +0.5 sigma (normal = 120-125, range 100-150).
All quiet on the Eastern & Mid-Western Fronts, again? YES (Capt Tiko says, for now)....
How to interpret the value of SPX SKEW? (from CBOE white paper on SKEW)

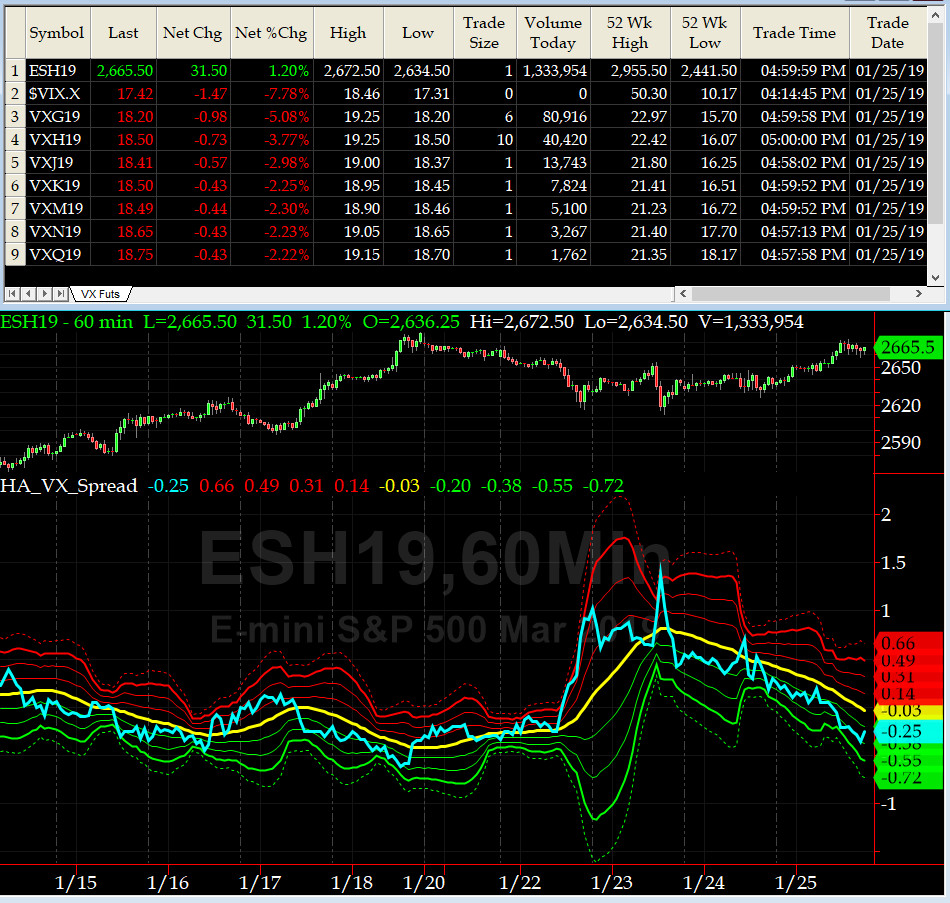
3-month VIX Futures Spread(VX) Chart
This popular timing indicator, (now long FEB19, & short MAY19 VIX Futures) again closed at -0.3 which says SPX is in NEUTRAL.

HA_SP2 Chart
HA_SP2 = 72.5 (Buy signal <= 25, Sell Signal >= 75)
Our coveted SP2 prop indicator is now back in the uber OVERBOUGHT zone and possibly setting up a bearish divergence here as recent local maxima in SPX is retested.

US Treasury T-Notes & T-Bonds Yields Chart
This week the YTMs went nowhere fast. On the QT, we have heard rumors that Maury is setting up office in Europe. Given current expectation for EuroBund rates, for the life of us, we can't figure out why is he doing that. Go Figure !!!
Fari Hamzei
|


 Proactive Market Timing


