
|
 |
 |
 |
 |
 |
 |
 |
 |
 Proactive Market Timing Proactive Market Timing
|
|
|
Most Recent PMT vs SPX Performance Chart

|
|
|
|
Friday, February 15, 2019, 0039ET
Notice of Change of Bias with Timer Digest
Dear Jim,
We keep on seeing false starts�.. SPX, NDX & DJ TRAN all have stalled at their respective 200-day MAs, Retail Sales reporting today its worst monthly decline since Sep2009 while confidence & consumer spending have moved to 2-year lows�.it seems that the near-term path of least resistance is back to the downside !!
By powers vested in me by our beloved Capt Tiko, we are hereby SHORTING SPX now now now��.
Fari Hamzei
|
|
|
|
|
|
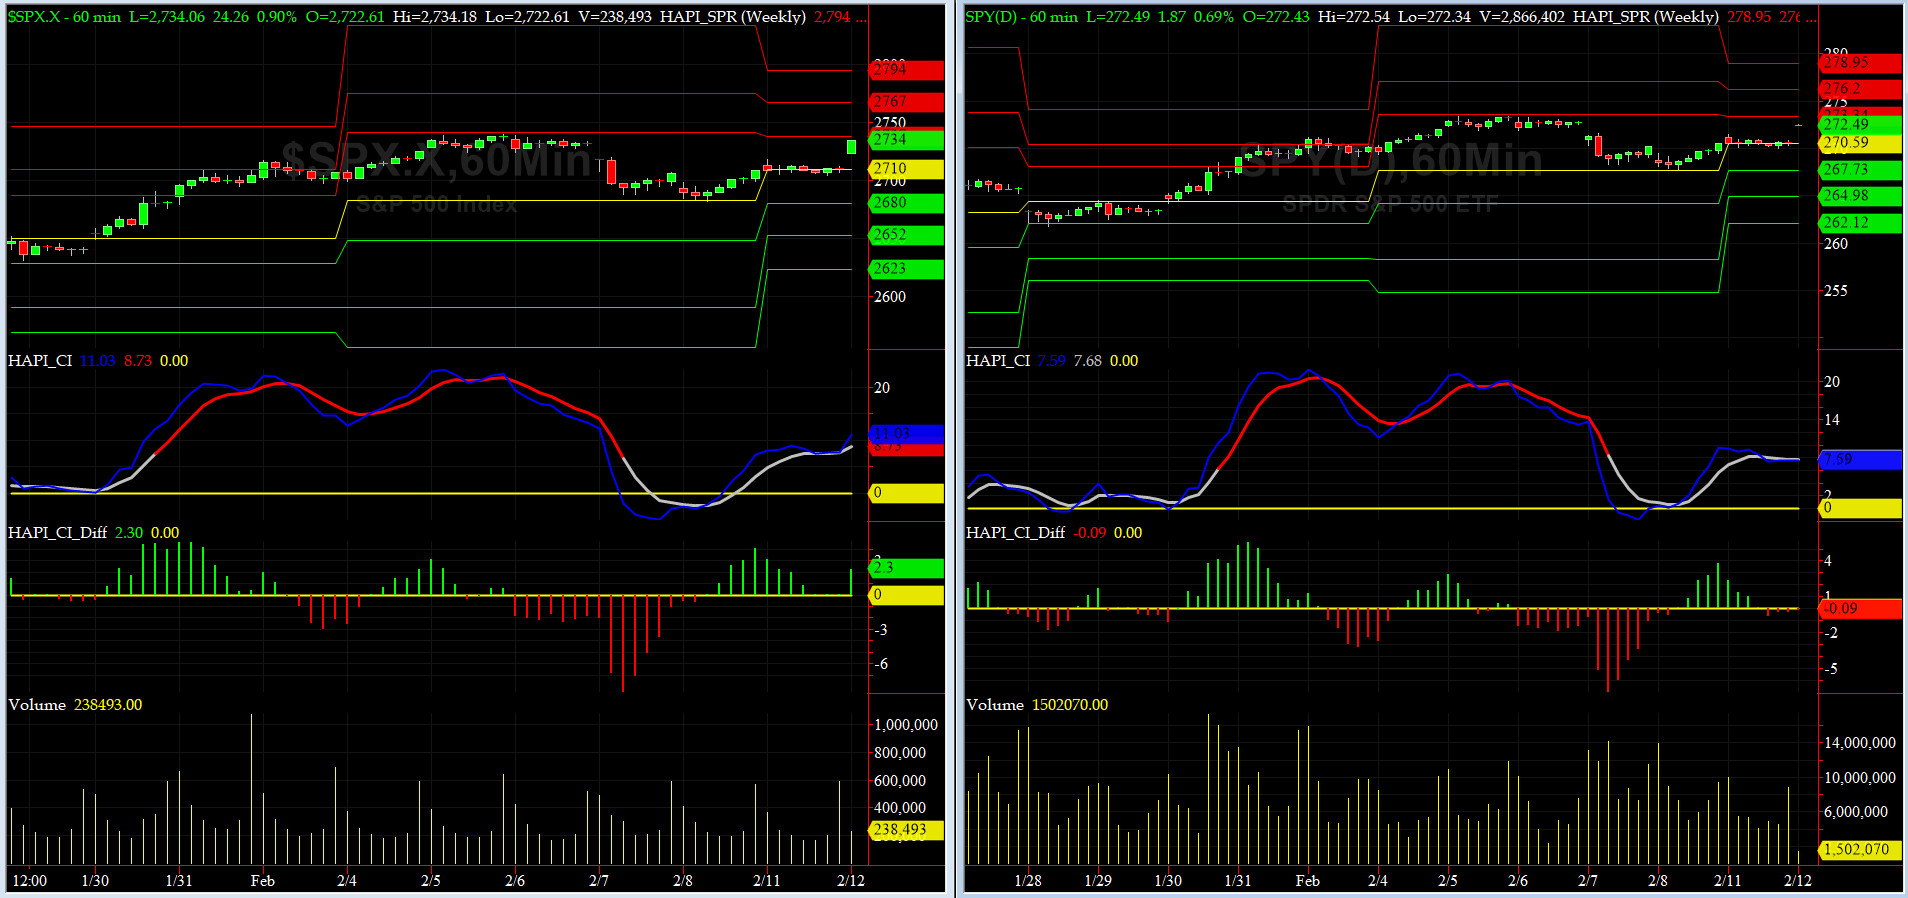
Tuesday, February 12, 2019, 1000ET
UPDATED Companion Chart for Market Bias Review, Issue #279
|
|
|
|
|
|
Tuesday, February 12, 2018, 0955ET
UPDATED Market Bias for Issue #279
Our current Market Bias with Timer Digest is LONG SPX as of FEB 11 at 2710
Our previous Market Bias was SHORT SPX as of FEB 7 at 2706
Here are the trade parameters for this week:
SPX Secondary Profit Target for last 20% of our position = 2800
SPX Primary Profit Target for first 80% of our position = 2770
SPX BreakEven Stop (Current Price) for last 20% of our position = 2730
SPX Money Management Stop for 100% of our position = 2710
|
| Action |
Asset |
Expiration |
Strike |
Option |
| BUY |
SPY |
Friday MAR 1 |
273 |
Calls |
| SELL SHORT |
SPY |
Friday MAR 1 |
279 |
Calls |
| You need to execute both legs and hold it as a Call-Spread.
|
Note A:
Once the Primary Profit Target has been reached, traders are advised to close 80% of their position in order to lock in profits. The remaining balance can be carried over with a BreakEven STOP, based on the SPX level at the time of entry, in order to make the trade a zero-risk trade with the final position running to reach the Secondary Profit Target.
Once either Secondary Profit or Money Management (BreakEven STOP after the 80% peel-off) is hit, our Option/ETF trade for that week is over. Go to Cash and wait for the next PMT Issue.
Note B:
When we change our Market Bias with Timer Digest, You need to go FLAT asap. With PMT Pro, that is before the Close that day and with the basic PMT, at the open of the next day. The following trading day, we will issue new SPX targets and a new SPY options trade, as long our new market bias with Timer Digest is NOT flat.
Fari Hamzei
|
|
|
|
|
|
Tuesday, February 12, 2019, 0015ET
Notice of Change of Bias with Timer Digest
Dear Jim,
Overnight good news about averting another potential USGov Shutdown this Friday, and US Index Futures� reaction to it, suggests that we could be heading back up again.
We are cautiously optimistic and reverting back to LONG SPX now��
Fari Hamzei
|
|
|
|
|
|
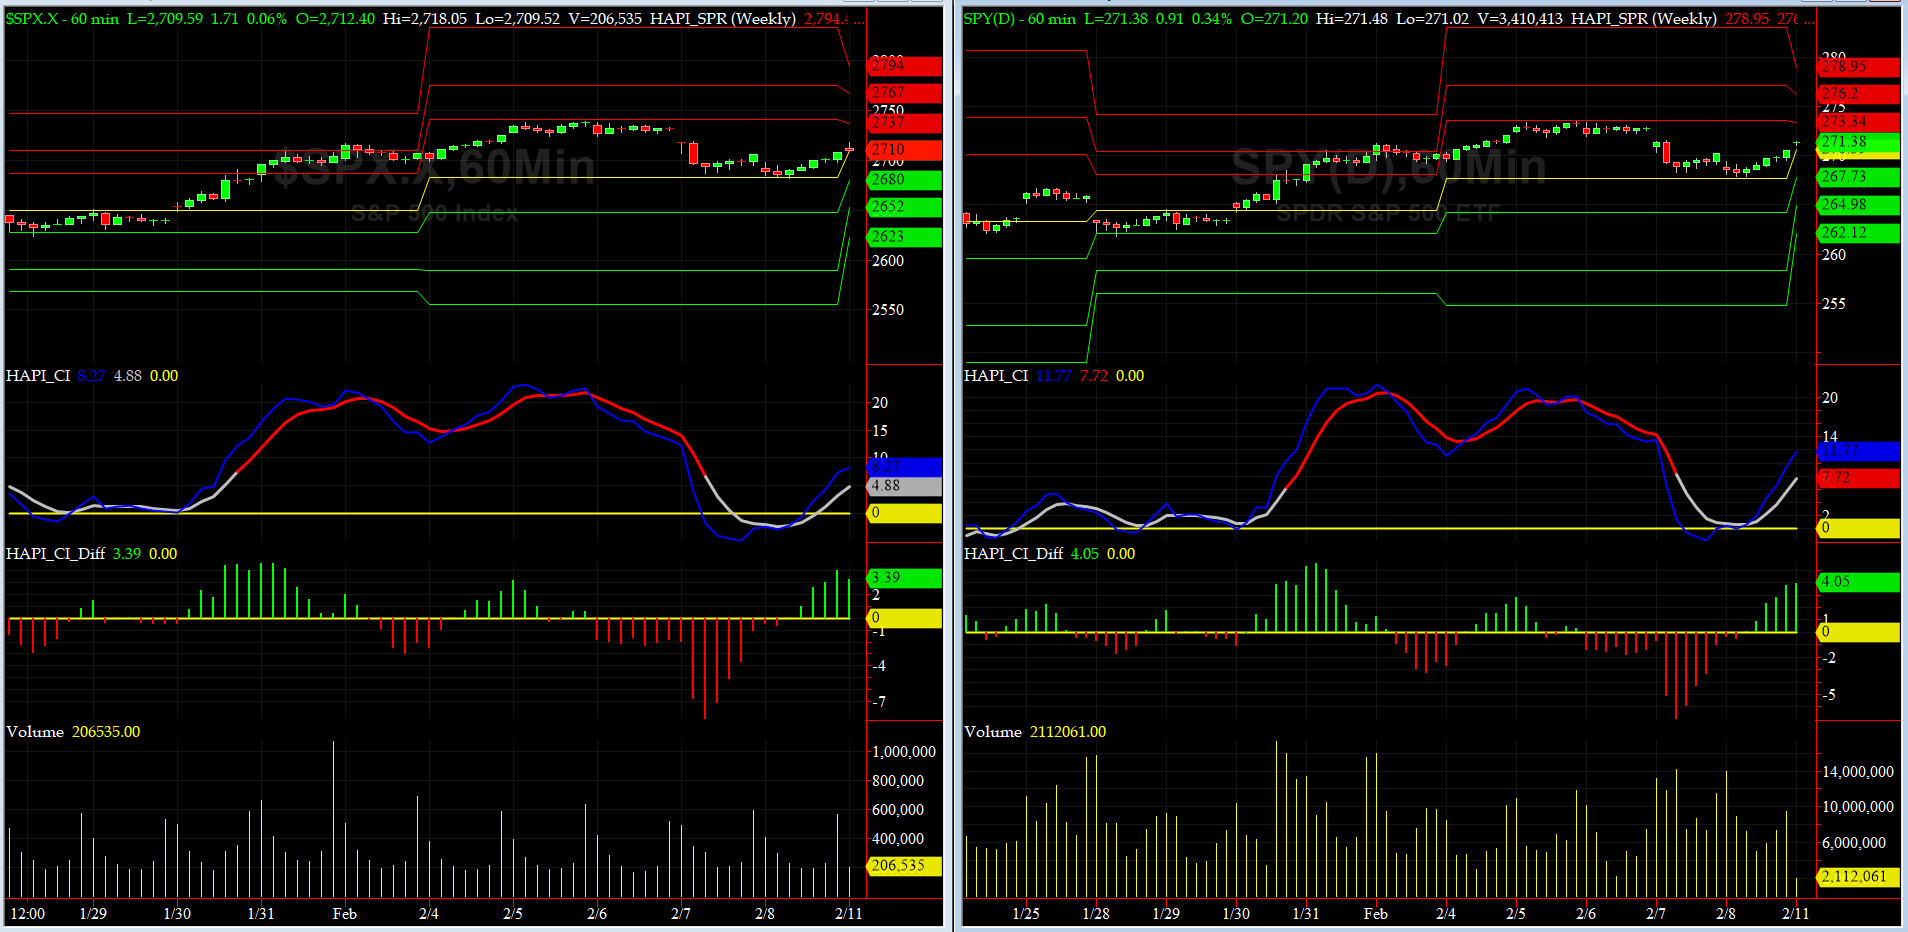
Monday, February 11, 2019, 1005ET
Companion Chart for Market Bias Review, Issue #279
|
|
|
|
|
|
Monday, February 11, 2019, 1000ET
Market Bias for Issue #279
Our current Market Bias with Timer Digest is SHORT SPX as of FEB 7 at 2706
Our previous Market Bias was FLAT SPX as of FEB 5 at 2738
Here are the trade parameters for this week:
SPX Money Management Stop for 100% of our position = 2735
SPX BreakEven Stop (Current Price) for last 20% of our position = 2712
SPX Primary Profit Target for first 80% of our position = 2665
SPX Secondary Profit Target for last 20% of our position = 2645
|
| Action |
Asset |
Expiration |
Strike |
Option |
| BUY |
SPY |
Friday MAR 1 |
271 |
Puts |
| SELL SHORT |
SPY |
Friday MAR 1 |
267 |
Puts |
| You need to execute both legs and hold it as a Put-Spread.
|
Note A:
Once the Primary Profit Target has been reached, traders are advised to close 80% of their position in order to lock in profits. The remaining balance can be carried over with a BreakEven STOP, based on the SPX level at the time of entry, in order to make the trade a zero-risk trade with the final position running to reach the Secondary Profit Target.
Once either Secondary Profit or Money Management (BreakEven STOP after the 80% peel-off) is hit, our Option/ETF trade for that week is over. Go to Cash and wait for the next PMT Issue.
Note B:
When we change our Market Bias with Timer Digest, You need to go FLAT asap. With PMT Pro, that is before the Close that day and with the basic PMT, at the open of the next day. The following trading day, we will issue new SPX targets and a new SPY options trade, as long our new market bias with Timer Digest is NOT flat.
Fari Hamzei
|
|
|
|
|
|
Monday, February 11, 2019, 0845ET
Market Timing Charts, Analysis & Commentary for Issue #279
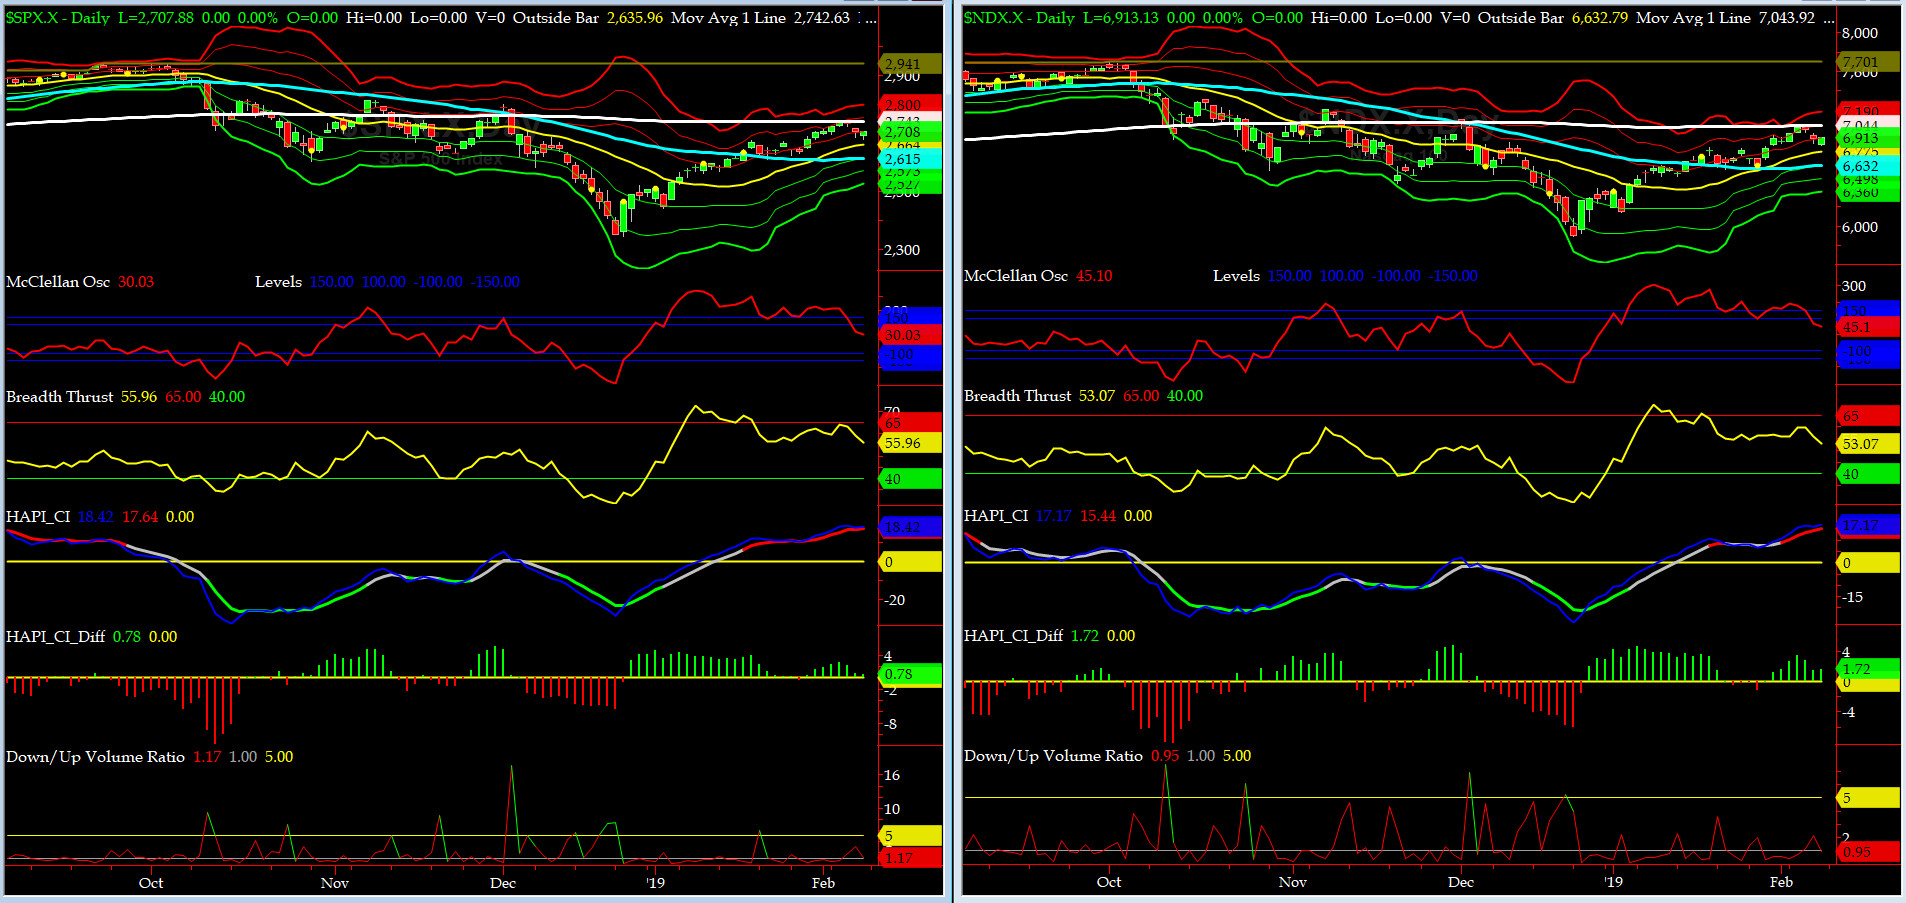
Timer Charts of S&P-500 Cash Index (SPX) + NASDAQ-100 Cash Index (NDX)
Most recent S&P-500 Cash Index (SPX): 2708 up +2 (up zero %) for the week ending on Friday, February 8, 2019, which closed above its +1 sigma.
DJIA ALL TIME INTRADAY HIGH = 26951 (reached on Wednesday, October 3, 2018)
DJ TRAN ALL TIME INTRADAY HIGH = 11623 (reached on Friday, September 14, 2018)
SPX ALL TIME INTRADAY HIGH = 2941 (reached on Friday, September 21, 2018)
NDX ALL TIME INTRADAY HIGH = 7700 (reached on Thursday, October 1, 2018)
RUT ALL TIME INTRADAY HIGH = 1742 (reached on Friday, August 31, 2018)
Current DAILY +2 Sigma SPX = 2755 with WEEKLY +2 Sigma = 2954
Current DAILY 0 Sigma SPX = 2664 with WEEKLY 0 Sigma = 2693
Current DAILY -2 Sigma SPX = 2573 with WEEKLY -2 Sigma = 2432
NYSE McClellan Oscillator = +30 (-150 is start of the O/S area; around -275 to -300 area or lower, we go into the �launch-pad� mode; over +150, we are in O/B area)
NYSE Breadth Thrust = 56 (40 is considered as oversold and 65 as overbought)
This past week, we saw two sell-offs, and yet, they bought them both intraday. We must appreciate the defense of key levels the Bulls put out. Our Short Market Bias may be short-lived. In the vernacular of our Supreme Leader (aka Grumpino): "we shall see....." LOL.

Canaries [in the Coal Mine] Chart for DJ TRAN & RUT Indices
200-Day MA DJ TRAN = 10,558 or 3.6 ABOVE DJ TRAN (max observed in last 7 yrs = 20.2%, min = -20.3%)
200-Day MA RUT = 1587 or 5.1% ABOVE RUT (max observed in last 7 yrs = 21.3%, min = -22.6%)
DJ Transportation Index (proxy for economic conditions 6 to 9 months hence) just like SPX had two big drops on Thursday & Friday -- and they were bought intraday.
Russell 2000 Small Caps Index (proxy for Risk ON/OFF) had a lesser of a drop but also witnessed a good rally intraday . RISK is creeping back in.

DeTrenders Charts for SPX, NDX, TRAN & RUT Indices
50-Day MA SPX = 2615 or 3.5% BELOW SPX (max observed in last 7 yrs = +8.6%, min = -9.3%)
200-Day MA SPX = 2742 or 1.3% ABOVE SPX (max observed in last 7 yrs = 15.2%, min = -14%)
Again, four out of EIGHT of our DeTrenders (all 50DTs) are now in the NEGATIVE territory. The DeTrenders for DJ Tran & RUT will continue to be harbingers of future price behavior in broad indices.
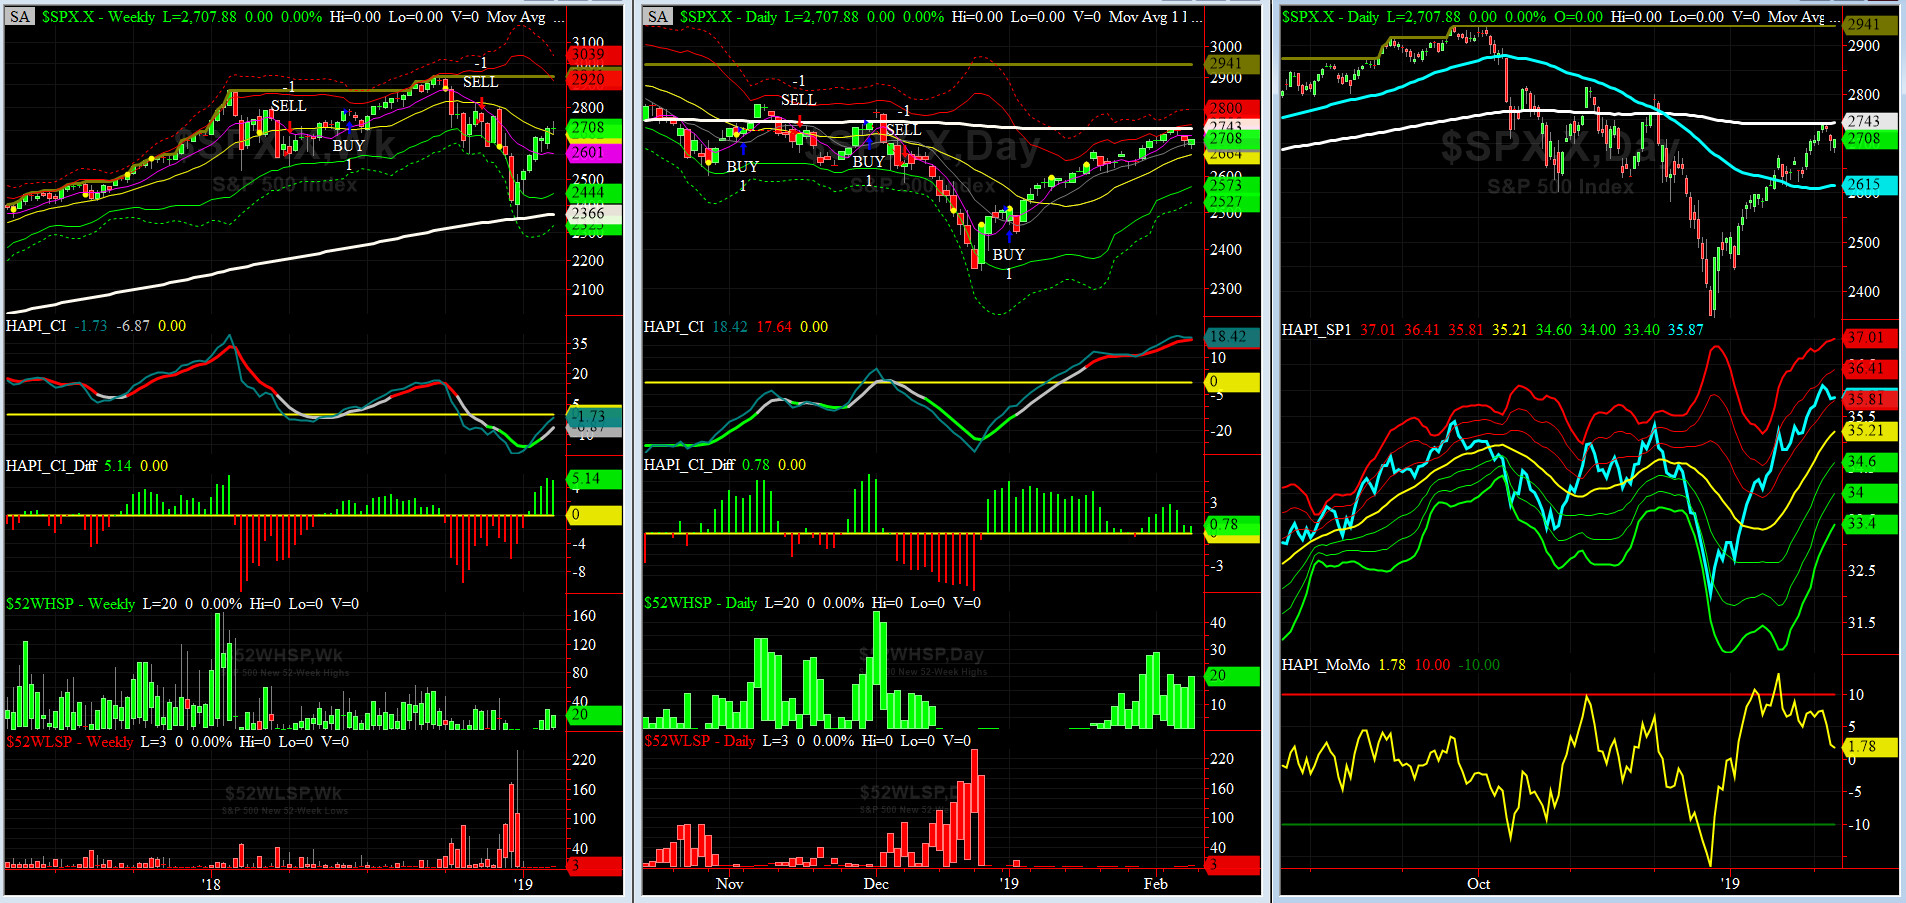
HA_SP1_Momo Chart
WEEKLY Timing Model = on a SELL Signal since Friday, November 16, 2018 CLOSE at 2736
DAILY Timing Model = on a BUY Signal since Wednesday, January 2, 2019 CLOSE at 2510
Max SPX 52wk-highs reading last week = 21 (over 120-140, the local maxima is in)
Max SPX 52wk-Lows reading last week = 3(over 40-60, the local minima is in)
HA_SP1 closed near its +1 sigma channels
HA_Momo = +1.8 (reversals most likely occur above +10 or below -10)

Vol of the Vols Chart
Spot VIX currently stands at 15.7, at about its -2 sigma (remember it's the VIX volatility pattern aka "its sigma channels" that matters, and not the level of VIX itself (this is per Dr. Robert Whaley, a great mentor and inventor of original VIX, now called VXO). VIX usually peaks around a test of its +4 sigma).
VIX sold off last week. Again, VXN (VIX for NASDAQ) was more mixed.
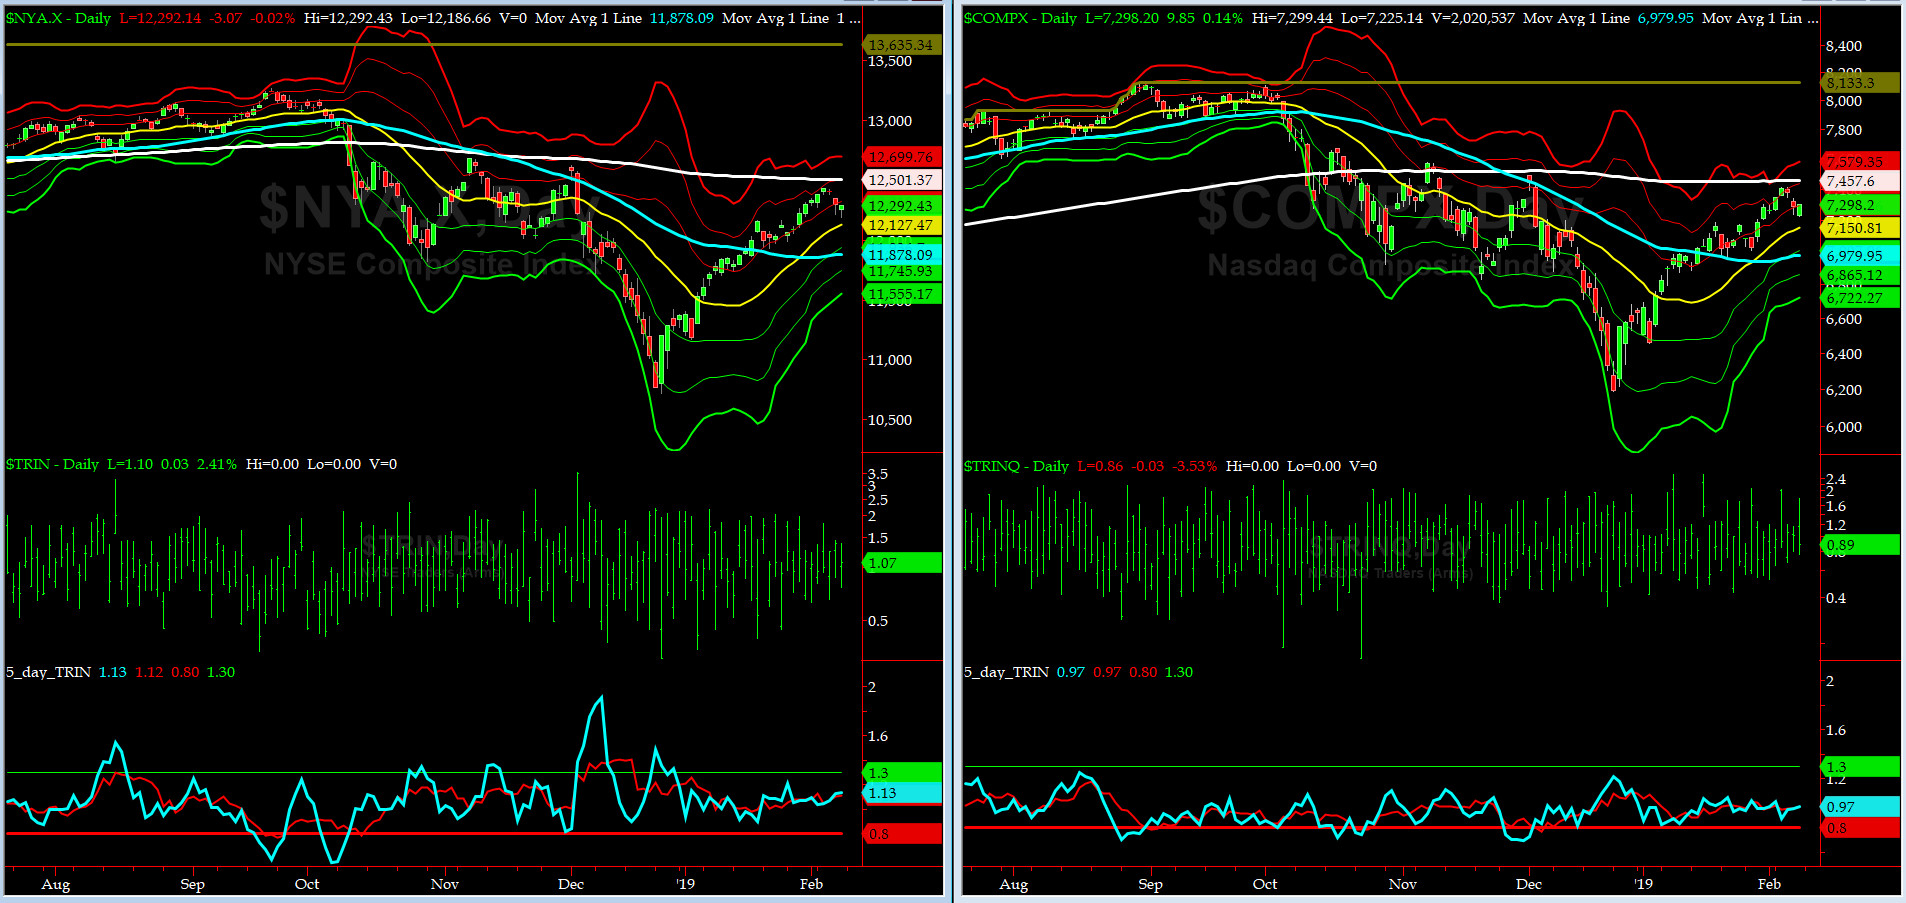
5-day TRIN & TRINQ Charts
Again, both NYSE & NASDAQ 5-day TRINs continue to be in NEUTRAL zones. No signal here.

Components of SPX above their respective 200day MA Chart
This scoring indicator rallied to almost 54% before settling down to the 50% LIS we talked about last week.

SPX SKEW (Tail Risk) Chart
On Friday, SPX SKEW (Tail Risk) closed near 128, now about its +0.5 sigma (normal = 120-125, range 100-150).
All quiet on the Eastern & Mid-Western Fronts, again? YES according to HRH Capt Tiko....
How to interpret the value of SPX SKEW? (from CBOE white paper on SKEW)

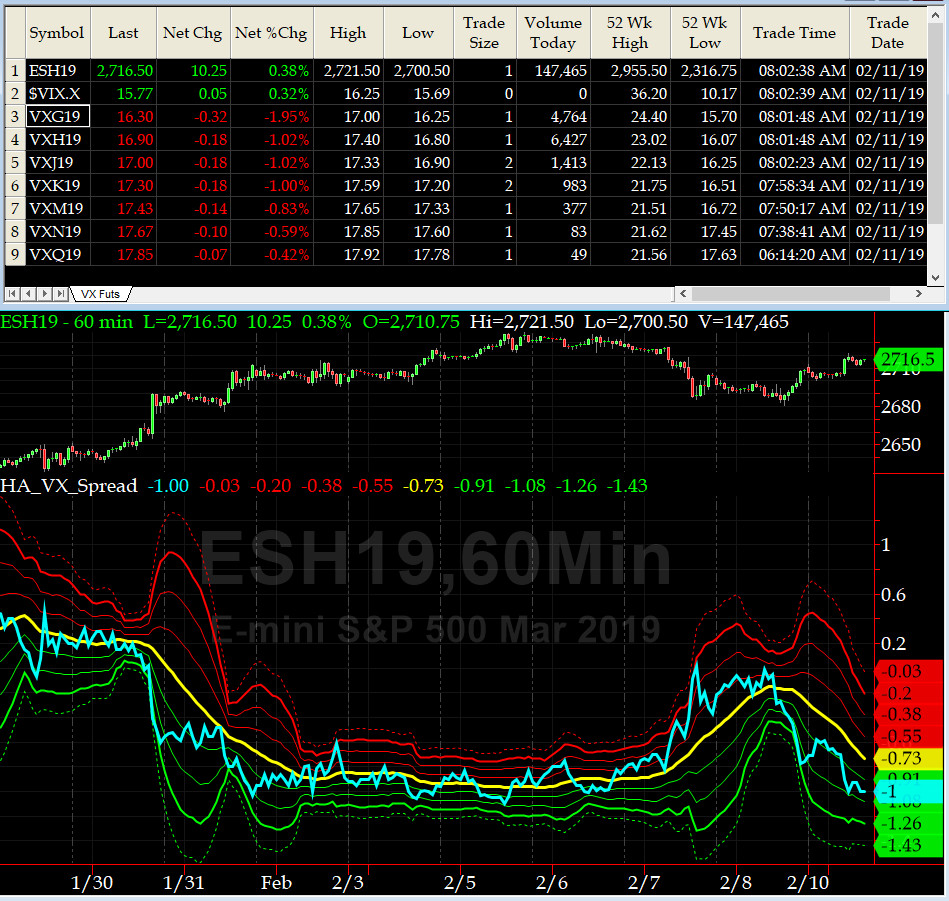
3-month VIX Futures Spread(VX) Chart
This popular timing indicator, (now long FEB19, & short MAY19 VIX Futures) again closed at -1.1 which says SPX is in NEUTRAL.
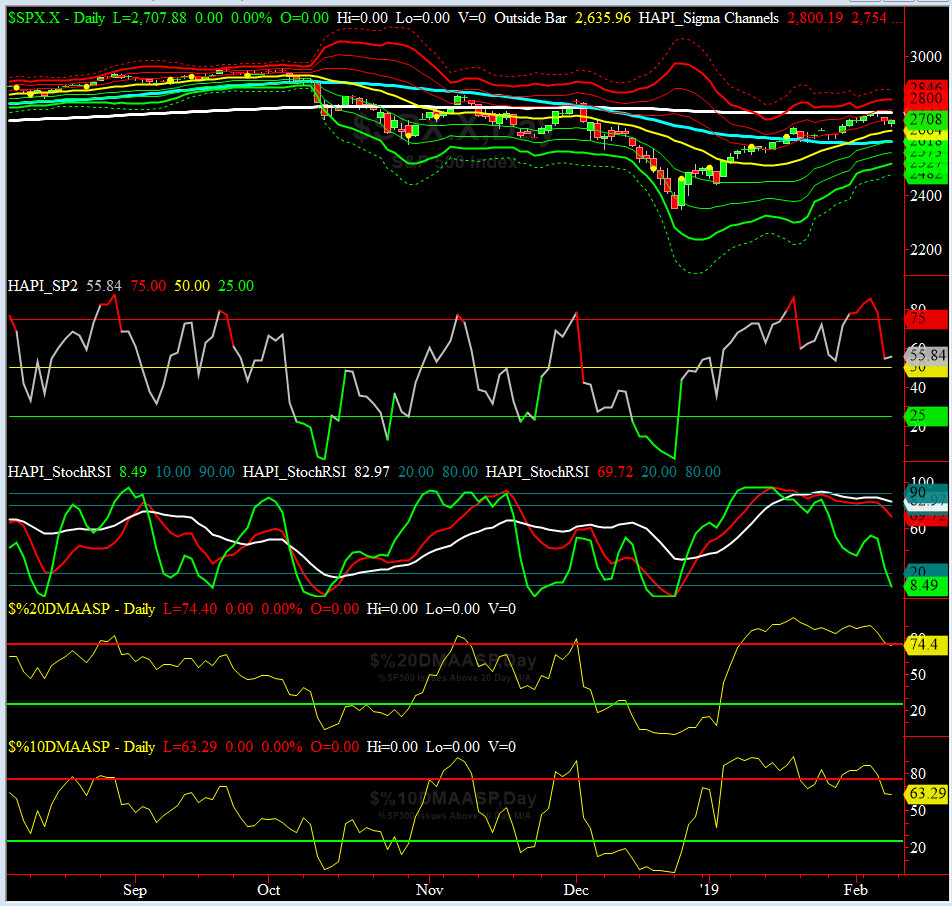
HA_SP2 Chart
HA_SP2 = 55.8 (Buy signal <= 25, Sell Signal >= 75)
Our coveted SP2 prop indicator dropped from its uber OVERBOUGHT zone for the second time since mid-January following a bearish divergence setup (as warned here before).
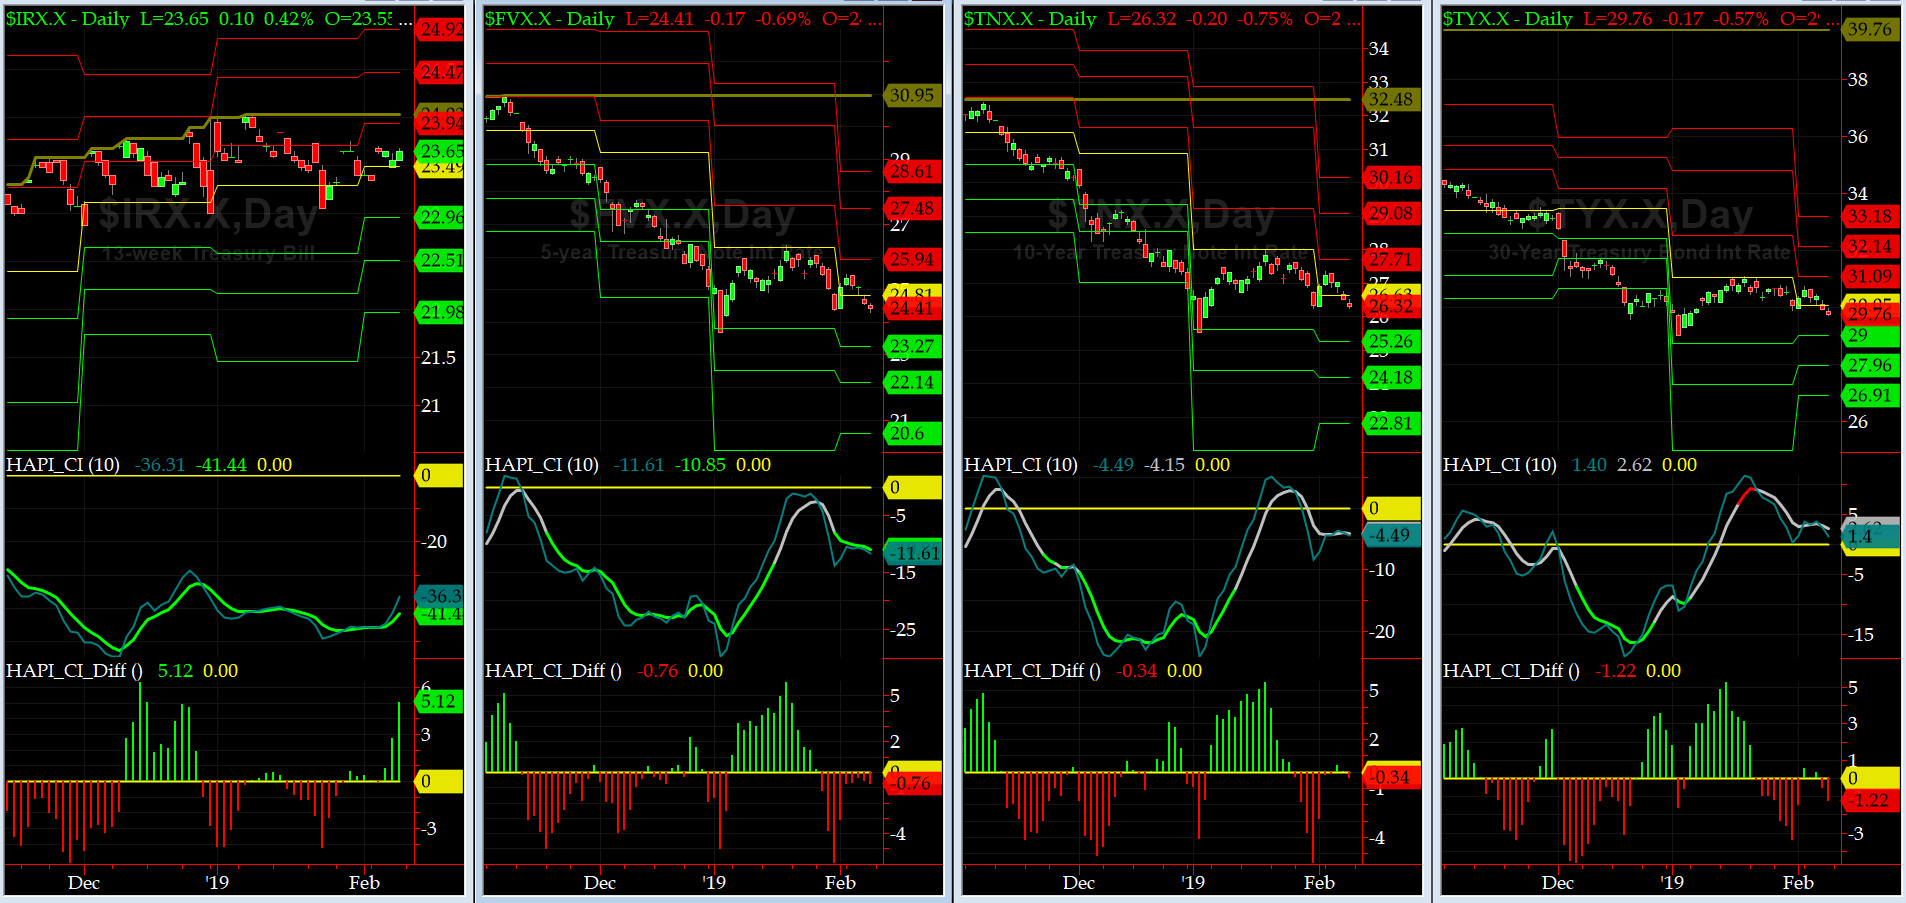
US Treasury T-Notes & T-Bonds Yields Chart
The YTMs went sideways last week.
Fari Hamzei
|
|
|
|
|
|
Customer Care:
|
|
|
|
|
|
|
 |
 |
|
 |
|
 |
 |
 |
HA YouTube Channel ::: HA Blog ::: Testimonials ::: Tutorials & FAQs ::: Privacy Policy
|
Trading Derivatives (Options & Futures) contains substantial risk and is not for every investor. An investor could potentially lose all or more than his/her initial investment.
Only risk capital should be used for trading and only those with sufficient risk capital should consider trading derivatives. Past performance is not
necessarily indicative of future results. Testimonials appearing on this website may not be representative of other clients or customers
and are not a guarantee of future performance or success.
|
| (c) 1998-2025, Hamzei Analytics, LLC.® All Rights Reserved. |
|
|