|
Monday, March 25, 2019, 0700ET
Market Timing Charts, Analysis & Commentary for Issue #285
Timer Charts of S&P-500 Cash Index (SPX) + NASDAQ-100 Cash Index (NDX)
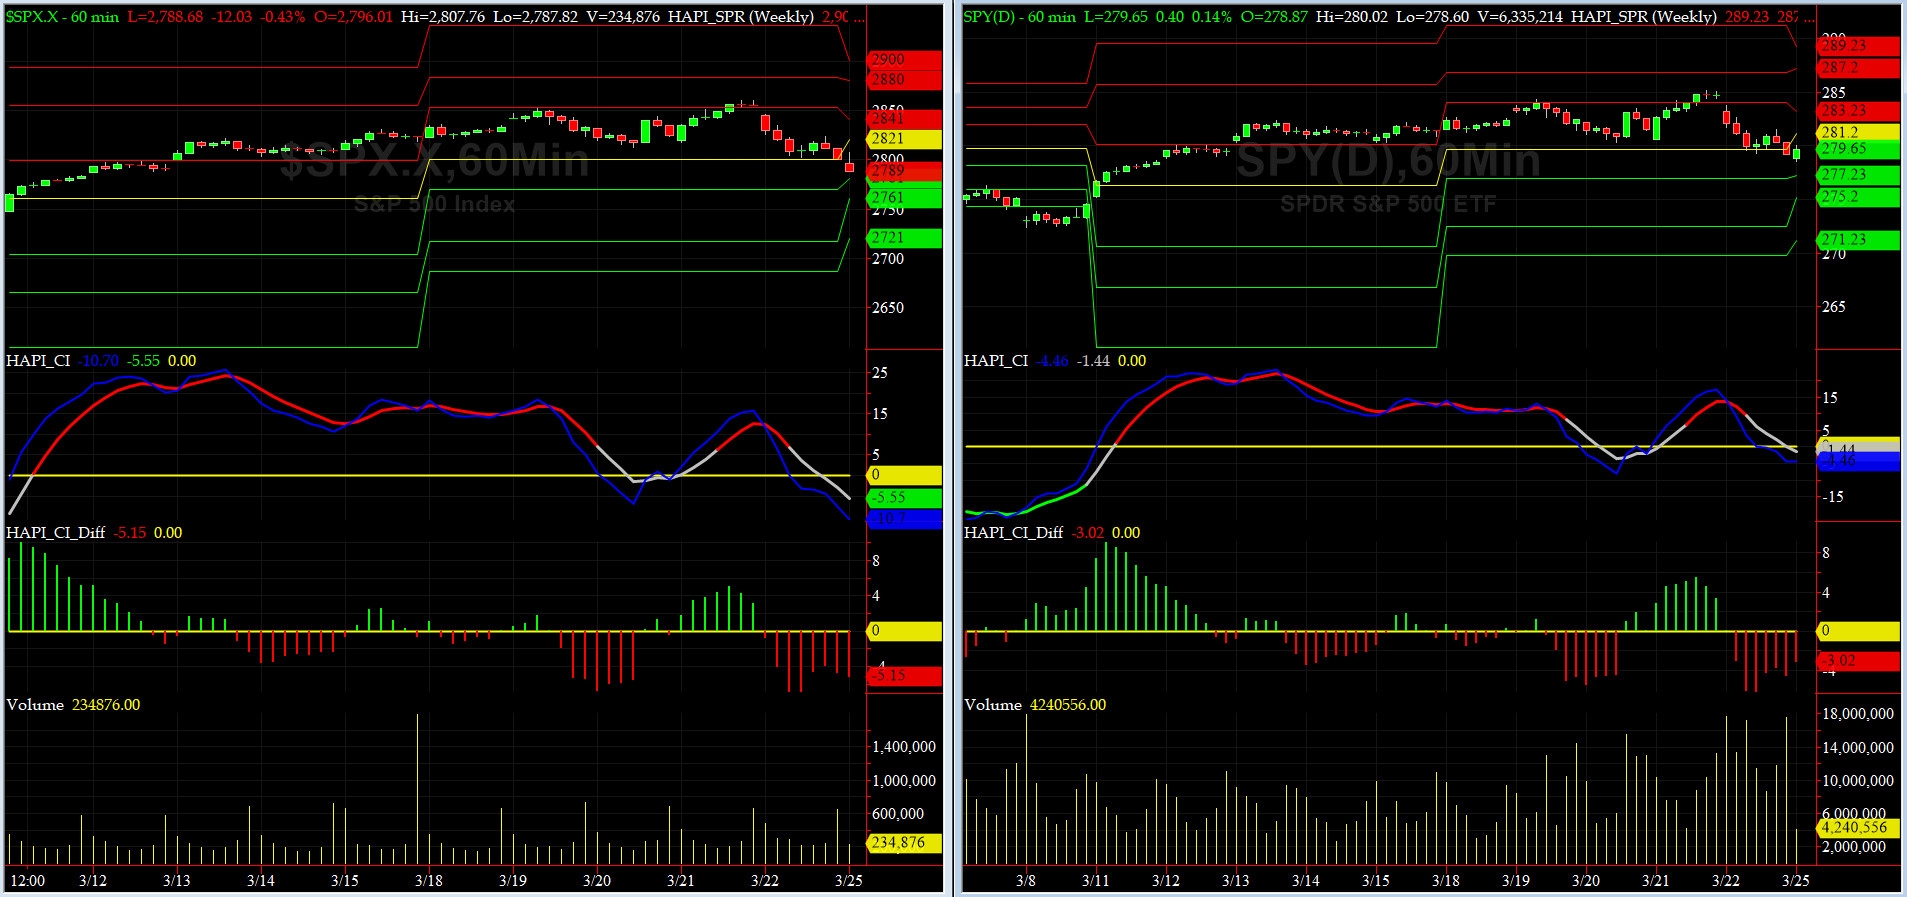
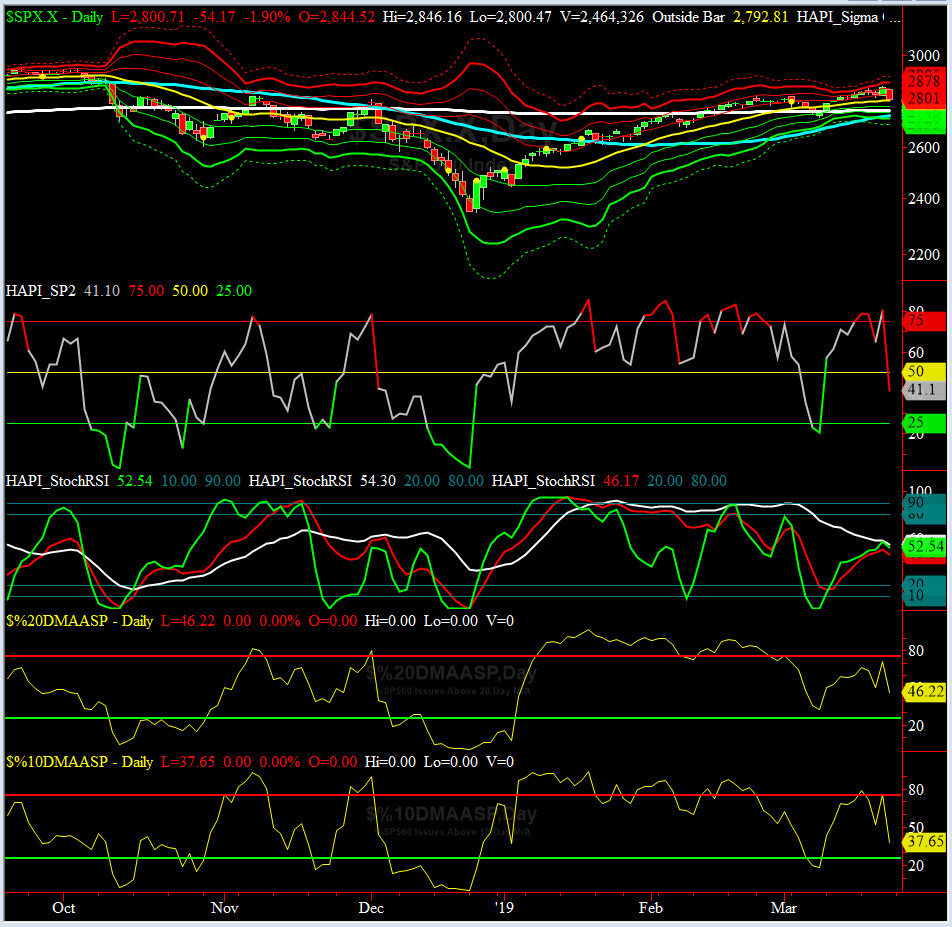
Most recent S&P-500 Cash Index (SPX): 2801 down -21 (down -0.7%) for the week ending on Friday, March 22, 2019, which closed below its zero sigma.
DJIA ALL TIME INTRADAY HIGH = 26951 (reached on Wednesday, October 3, 2018)
DJ TRAN ALL TIME INTRADAY HIGH = 11623 (reached on Friday, September 14, 2018)
SPX ALL TIME INTRADAY HIGH = 2941 (reached on Friday, September 21, 2018)
NDX ALL TIME INTRADAY HIGH = 7700 (reached on Thursday, October 1, 2018)
RUT ALL TIME INTRADAY HIGH = 1742 (reached on Friday, August 31, 2018)
Current DAILY +2 Sigma SPX = 2852 with WEEKLY +2 Sigma = 2904
Current DAILY 0 Sigma SPX = 2799 with WEEKLY 0 Sigma = 2683
Current DAILY -2 Sigma SPX = 2746 with WEEKLY -2 Sigma = 2462
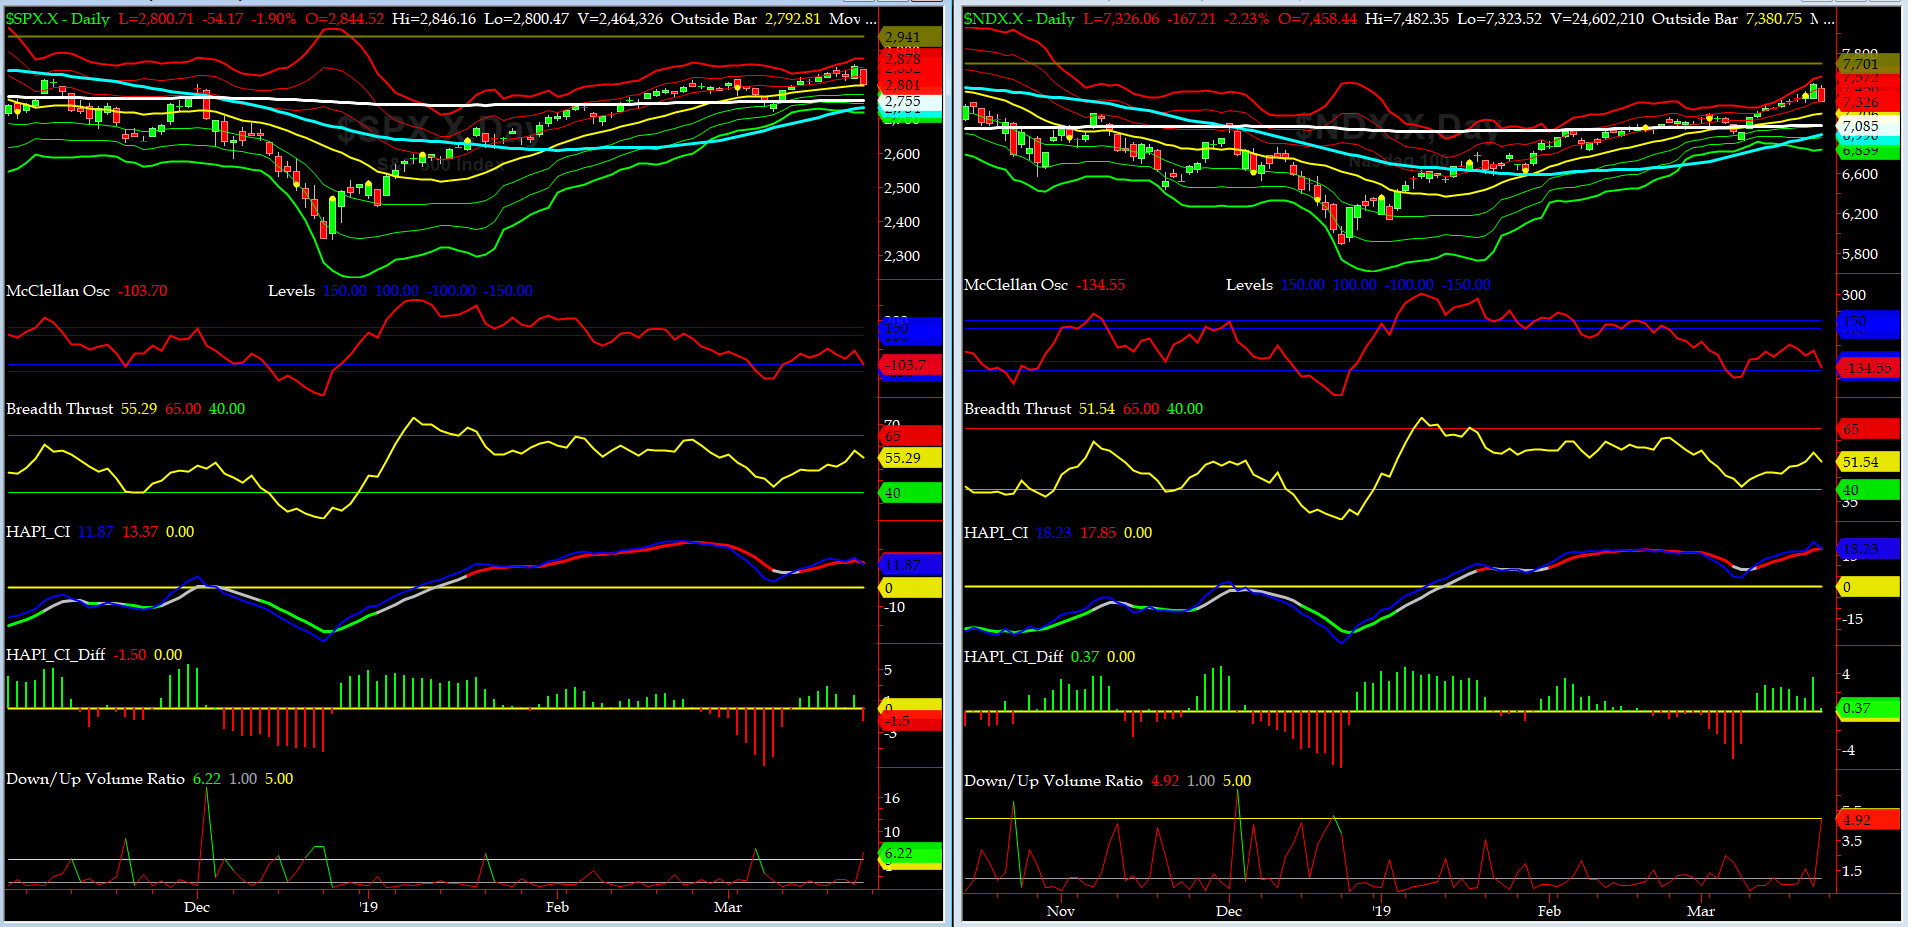
NYSE McClellan Oscillator = -104 (-150 is start of the O/S area; around -275 to -300 area or lower, we go into the �launch-pad� mode; over +150, we are in O/B area)
NYSE Breadth Thrust = 55.3 (40 is considered as oversold and 65 as overbought)
Both SPX and NDX had a wild week with a big move on Friday. Worth noting is the BEARISH DIVERGENCE between SPX & its CI Indicator, put in last Thursday as we saw the 5-month index high of 2860.
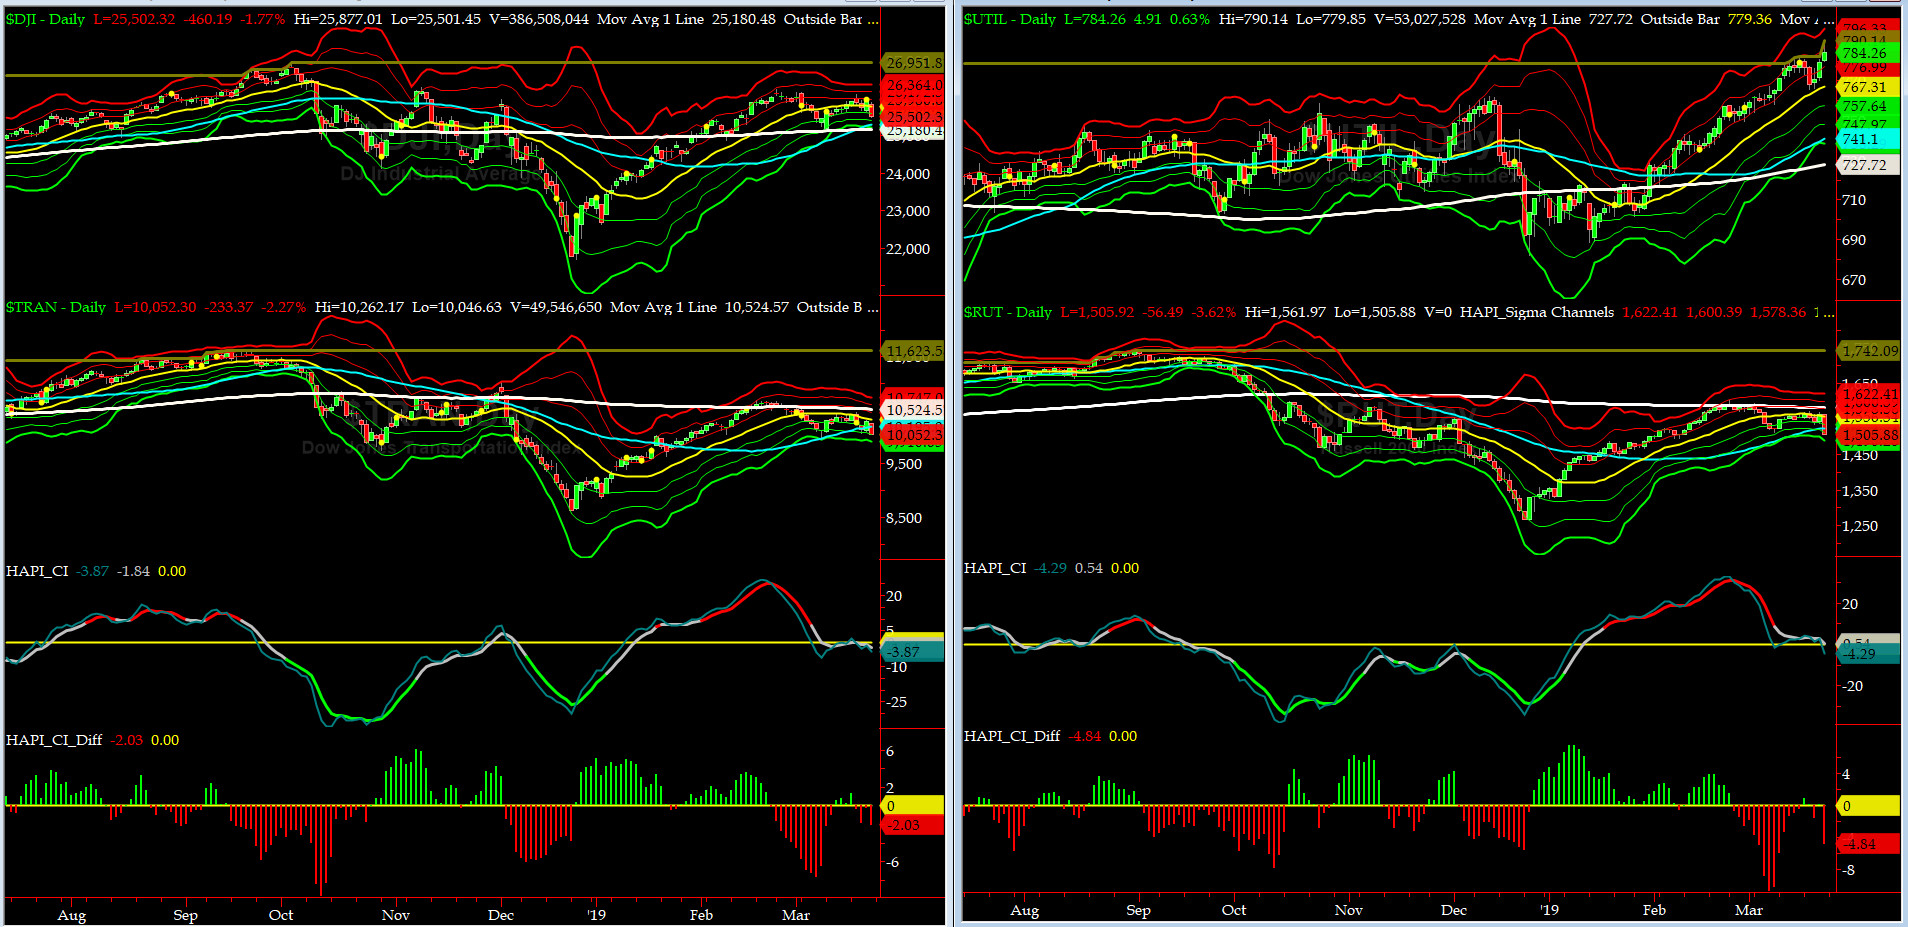
Canaries [in the Coal Mine] Chart for DJ TRAN & RUT Indices
200-Day MA DJ TRAN = 10,524 or 4.5% ABOVE DJ TRAN (max observed in last 7 yrs = 20.2%, min = -20.3%)
200-Day MA RUT = 1581 or 4.8% ABOVE RUT (max observed in last 7 yrs = 21.3%, min = -22.6%)
DJ Transportation Index (proxy for economic conditions 6 to 9 months hence) had another tough week with a big sell off on Friday.
Russell 2000 Small Caps Index (proxy for Risk ON/OFF) went sideways first and then sold off hard on Friday. Is RISK still ON?
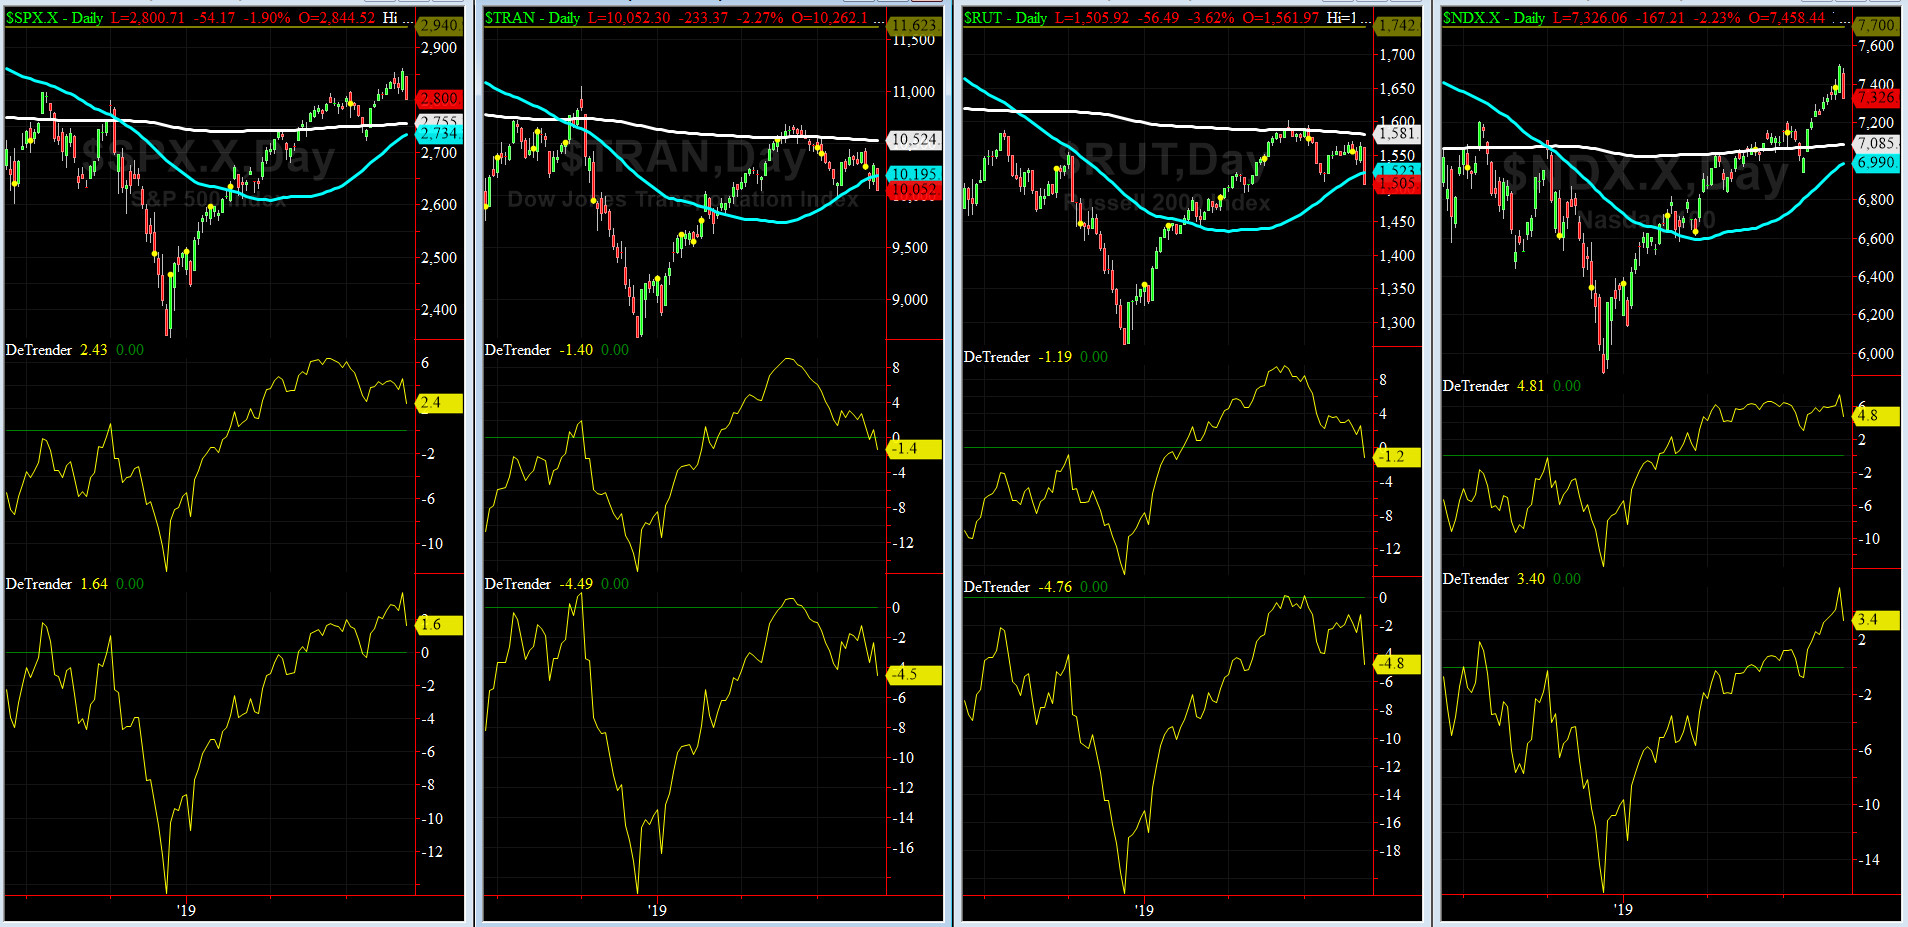
DeTrenders Charts for SPX, NDX, TRAN & RUT Indices
50-Day MA SPX = 2734 or 2.4% BELOW SPX (max observed in last 7 yrs = +8.6%, min = -9.3%)
200-Day MA SPX = 2755 or 1.6% BELOW SPX (max observed in last 7 yrs = 15.2%, min = -14%)
FOUR out of EIGHT of our DeTrenders are now in the POSITIVE territory. The DeTrenders for DJ Tran & RUT will continue to be harbingers of future price behavior in broad indices.

HA_SP1_Momo Chart
WEEKLY Timing Model = on a BUY Signal since Friday, March 8, 2019 CLOSE at 2743
DAILY Timing Model = on a BUY Signal since Thursday, March 14, 2019 CLOSE at 2808
Max SPX 52wk-highs reading last week = 59 (over 120-140, the local maxima is in)
Max SPX 52wk-Lows reading last week = 3 (over 40-60, the local minima is in)
HA_SP1 closed near its +0.5 sigma channels
HA_Momo = -3.03 (reversals most likely occur above +10 or below -10)
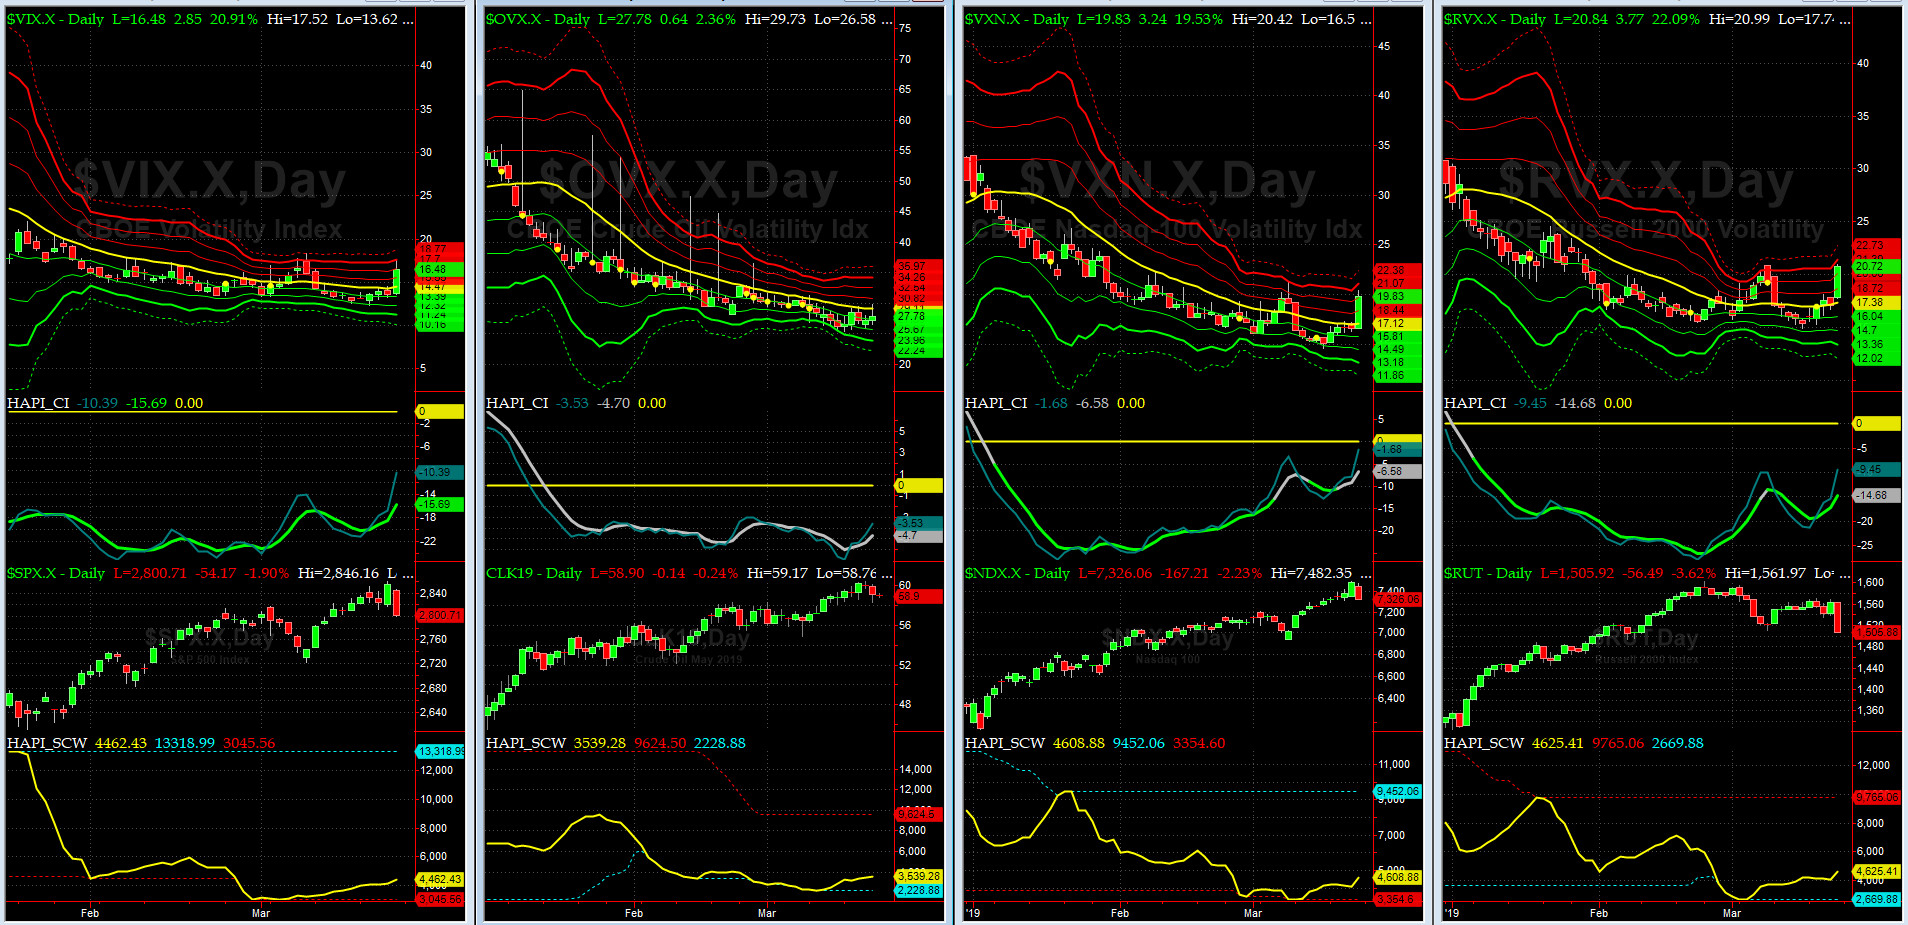
Vol of the Vols Chart
Spot VIX currently stands at 16.48, at about its +2 sigma (remember it's the VIX volatility pattern aka "its sigma channels" that matters, and not the level of VIX itself (this is per Dr. Robert Whaley, a great mentor and inventor of original VIX, now called VXO). VIX usually peaks around a test of its +4 sigma).
VIX was fairly quiet till Friday when it ran up to +3 sigma.
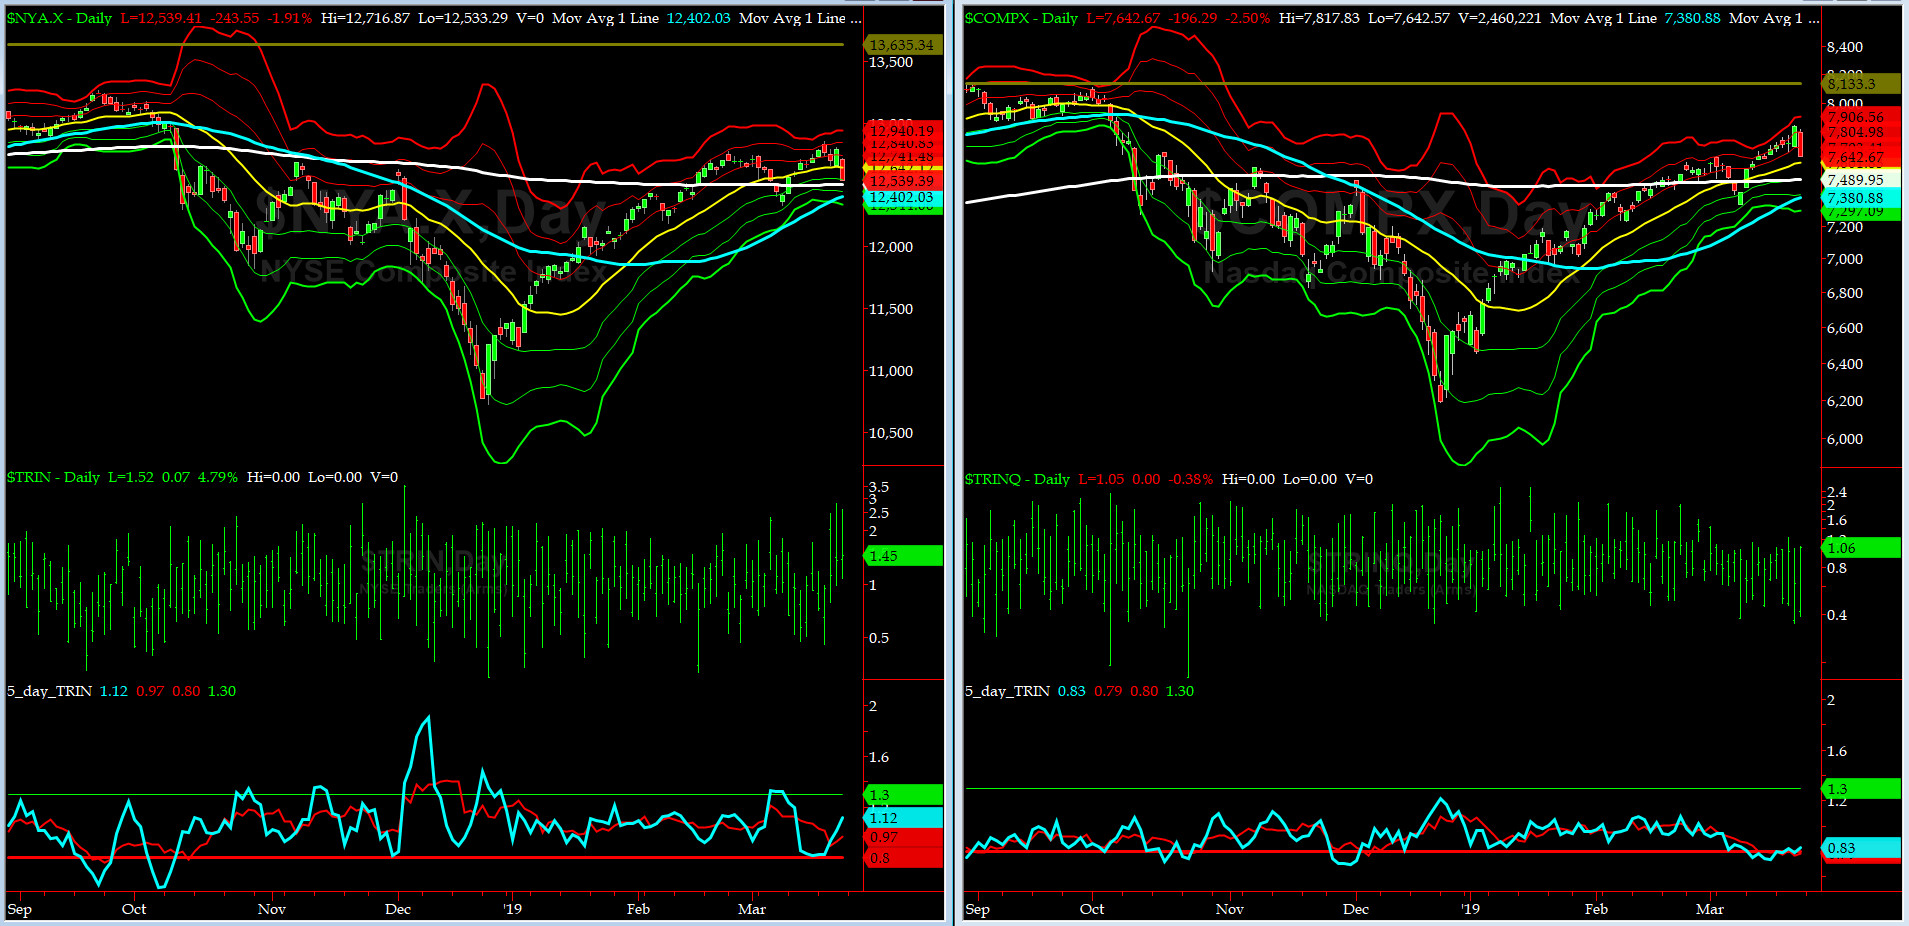
5-day TRIN & TRINQ Charts
5-day TRIN for NYSE is NEUTRAL while 5-day TRINQ for NASDAQ is still very near its SELL zone.
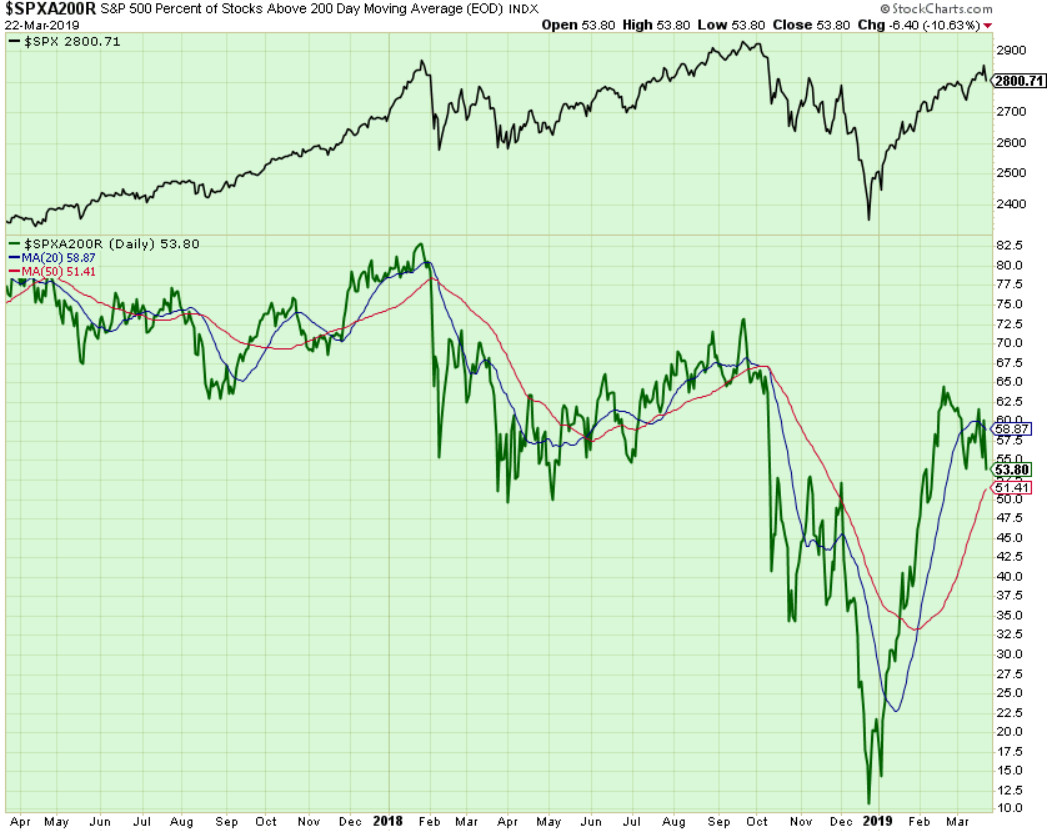
Components of SPX above their respective 200day MA Chart
This scoring indicator eased off to almost 54%, with the 50% level as next key area to watch for.
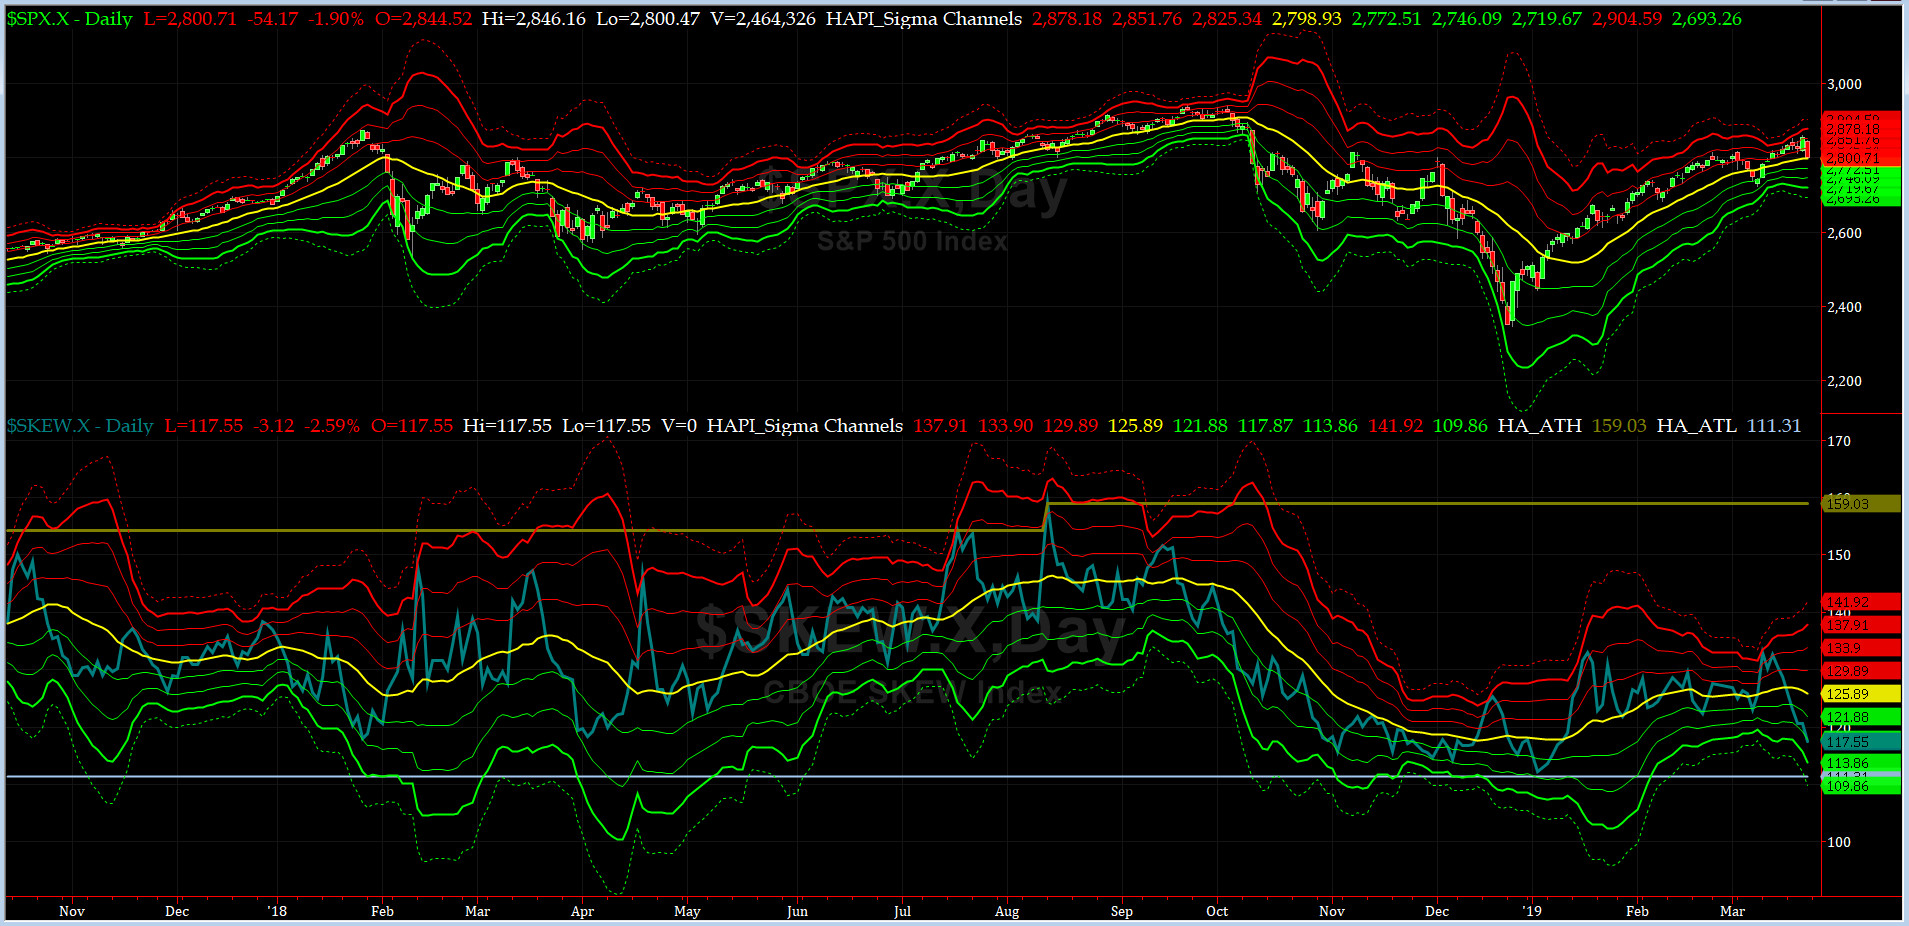
SPX SKEW (Tail Risk) Chart
On Friday, SPX SKEW (Tail Risk) closed near 117.5, now about its -2 sigma (normal = 120-125, range 100-150).
All quiet on the Eastern & Mid-Western Fronts? YES, this is according to our beloved HRH Capt Tiko, KCPE....
How to interpret the value of SPX SKEW? (from CBOE white paper on SKEW)

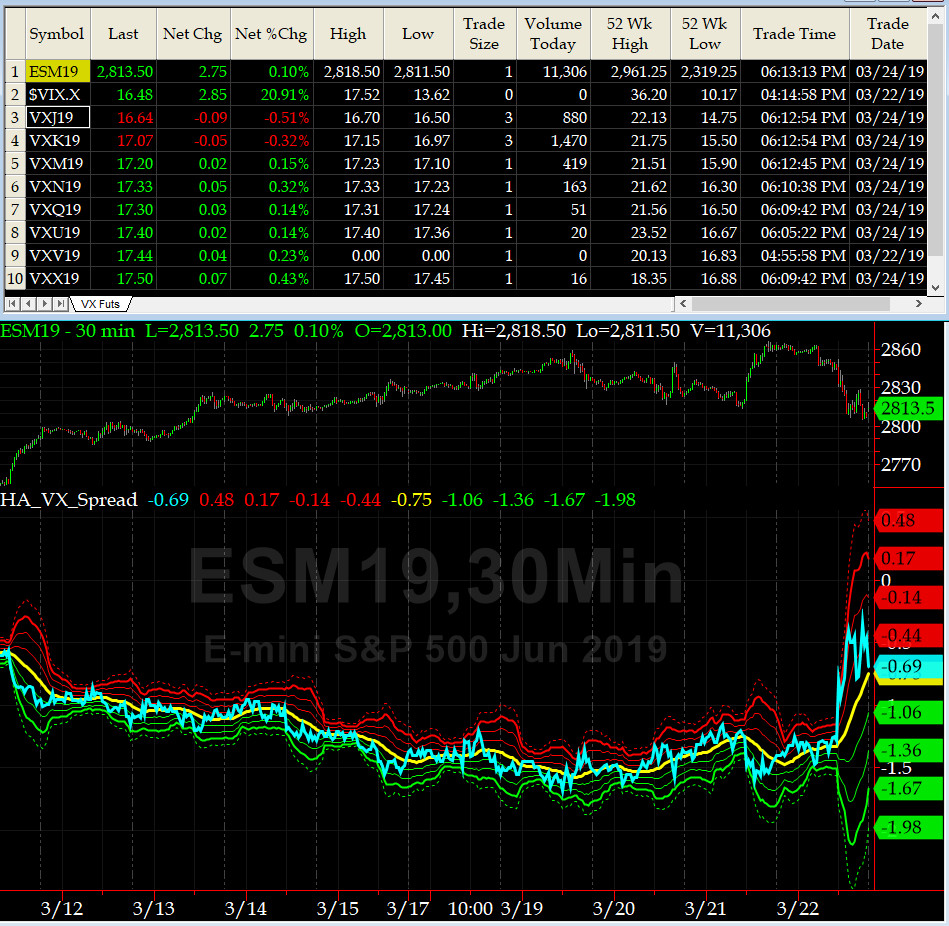
3-month VIX Futures Spread(VX) Chart
This popular timing indicator, (now long APR19, & short JUL19 VIX Futures) crossed the zero line on Friday and closed at -0.5 which is very near OVERSOLD here.
HA_SP2 Chart
HA_SP2 = 41 (Buy signal <= 25, Sell Signal >= 75)
Our coveted SP2 prop indicator went from 81 to 41 on Friday. We are staying short SPX at least 1 more day, may be 2.
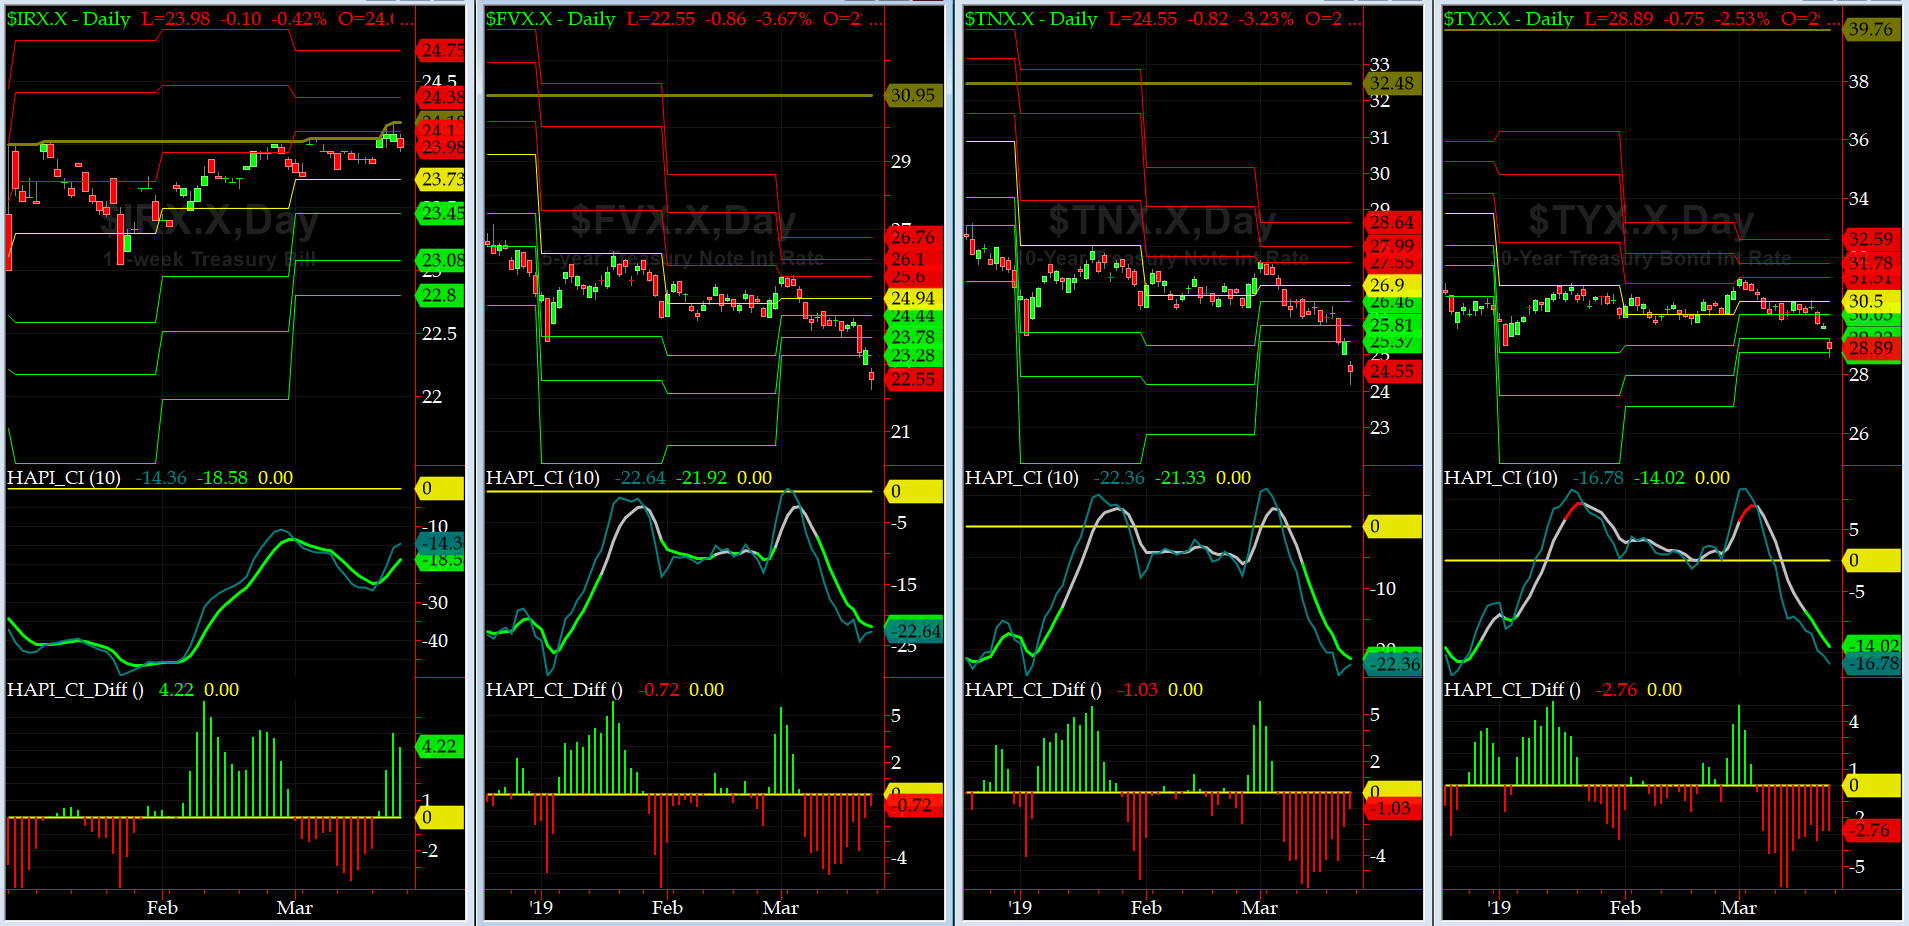
US Treasury T-Notes & T-Bonds Yields Chart
The front end of the Yield Curve eased off a tad this past week while the long end eased off quite a bit. Maury is very upset now.
Fari Hamzei
|


 Proactive Market Timing