
|
 |
 |
 |
 |
 |
 |
 |
 |
 Proactive Market Timing Proactive Market Timing
|
|
|
Most Recent PMT vs SPX Performance Chart

|
|
|
|
Monday, May 13, 2019, 2316ET
Notice of Change of Bias with Timer Digest
Dear Jim,
As much as we think we are soon approaching a perfect storm, the sell-off today was simply too fast & furious (many thanks to Don Grumpino�s uniquely chaotic management style). We went from an oversold condition Thursday night to a small bounce on Friday and then gave it all back & then some today.
Thus, we are now way oversold. We now shall take a small break and let the chips fall where they may.
Going FLAT SPX for 1 to 2 trading days��.
Fari Hamzei
|
|
|
|
|
|
Monday, May 13, 2019, 0945ET
Companion Chart for Market Bias Review, Issue #290
|
|
|
|
|
|
Monday, May 13, 2019, 0940ET
Market Bias for Issue #290
Our current Market Bias with Timer Digest is SHORT SPX as of MAY 10 at 2881
Our previous Market Bias was LONG SPX as of MAY 9 at 2870
Here are the trade parameters for this week:
SPX Money Management Stop for 100% of our position = 2850
SPX BreakEven Stop (Current Price) for last 20% of our position = 2830
SPX Primary Profit Target for first 80% of our position = 2800
SPX Secondary Profit Target for last 20% of our position = 2775
|
| Action |
Asset |
Expiration |
Strike |
Option |
| BUY |
SPY |
Friday MAY 31 |
282 |
Puts |
| SELL SHORT |
SPY |
Friday MAY 31 |
276 |
Puts |
| You need to execute both legs and hold it as a Put-Spread.
|
Note A:
Once the Primary Profit Target has been reached, traders are advised to close 80% of their position in order to lock in profits. The remaining balance can be carried over with a BreakEven STOP, based on the SPX level at the time of entry, in order to make the trade a zero-risk trade with the final position running to reach the Secondary Profit Target.
Once either Secondary Profit or Money Management (BreakEven STOP after the 80% peel-off) is hit, our Option/ETF trade for that week is over. Go to Cash and wait for the next PMT Issue.
Note B:
When we change our Market Bias with Timer Digest, You need to go FLAT asap. With PMT Pro, that is before the Close that day and with the basic PMT, at the open of the next day. The following trading day, we will issue new SPX targets and a new SPY options trade, as long our new market bias with Timer Digest is NOT flat.
Fari Hamzei
|
|
|
|
|
|
Monday, May 13, 2019, 0800ET
Market Timing Charts, Analysis & Commentary for Issue #290
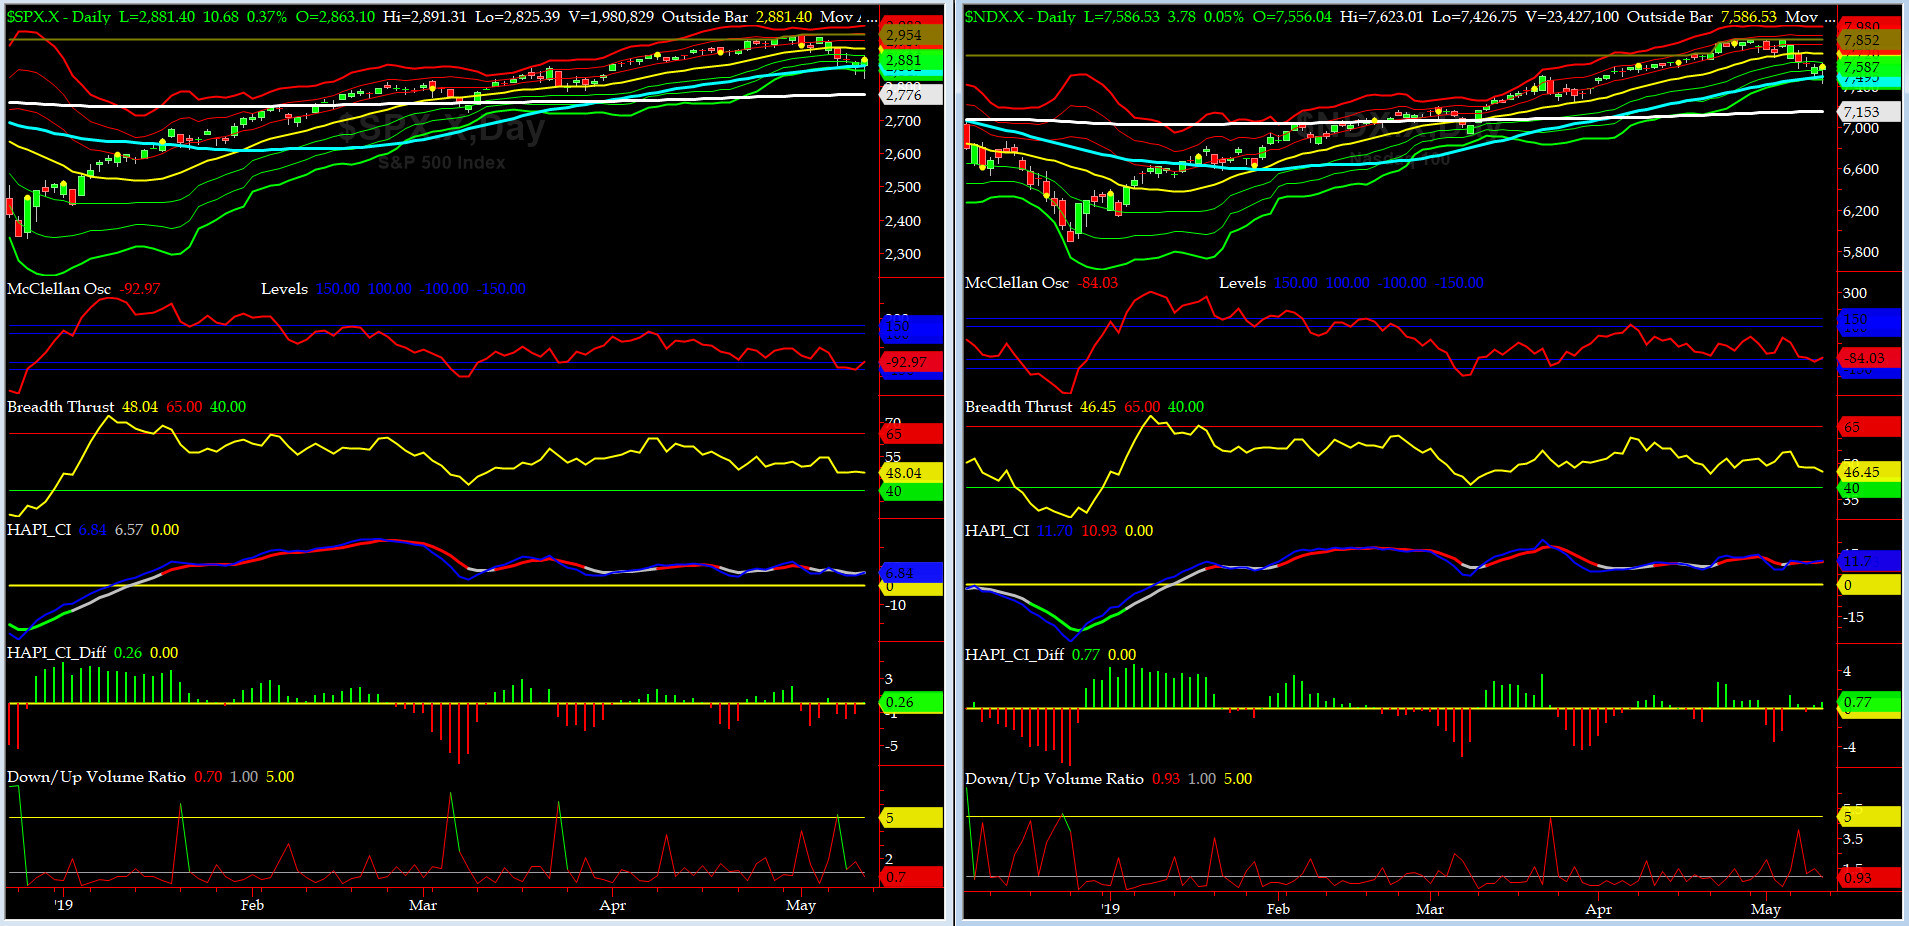
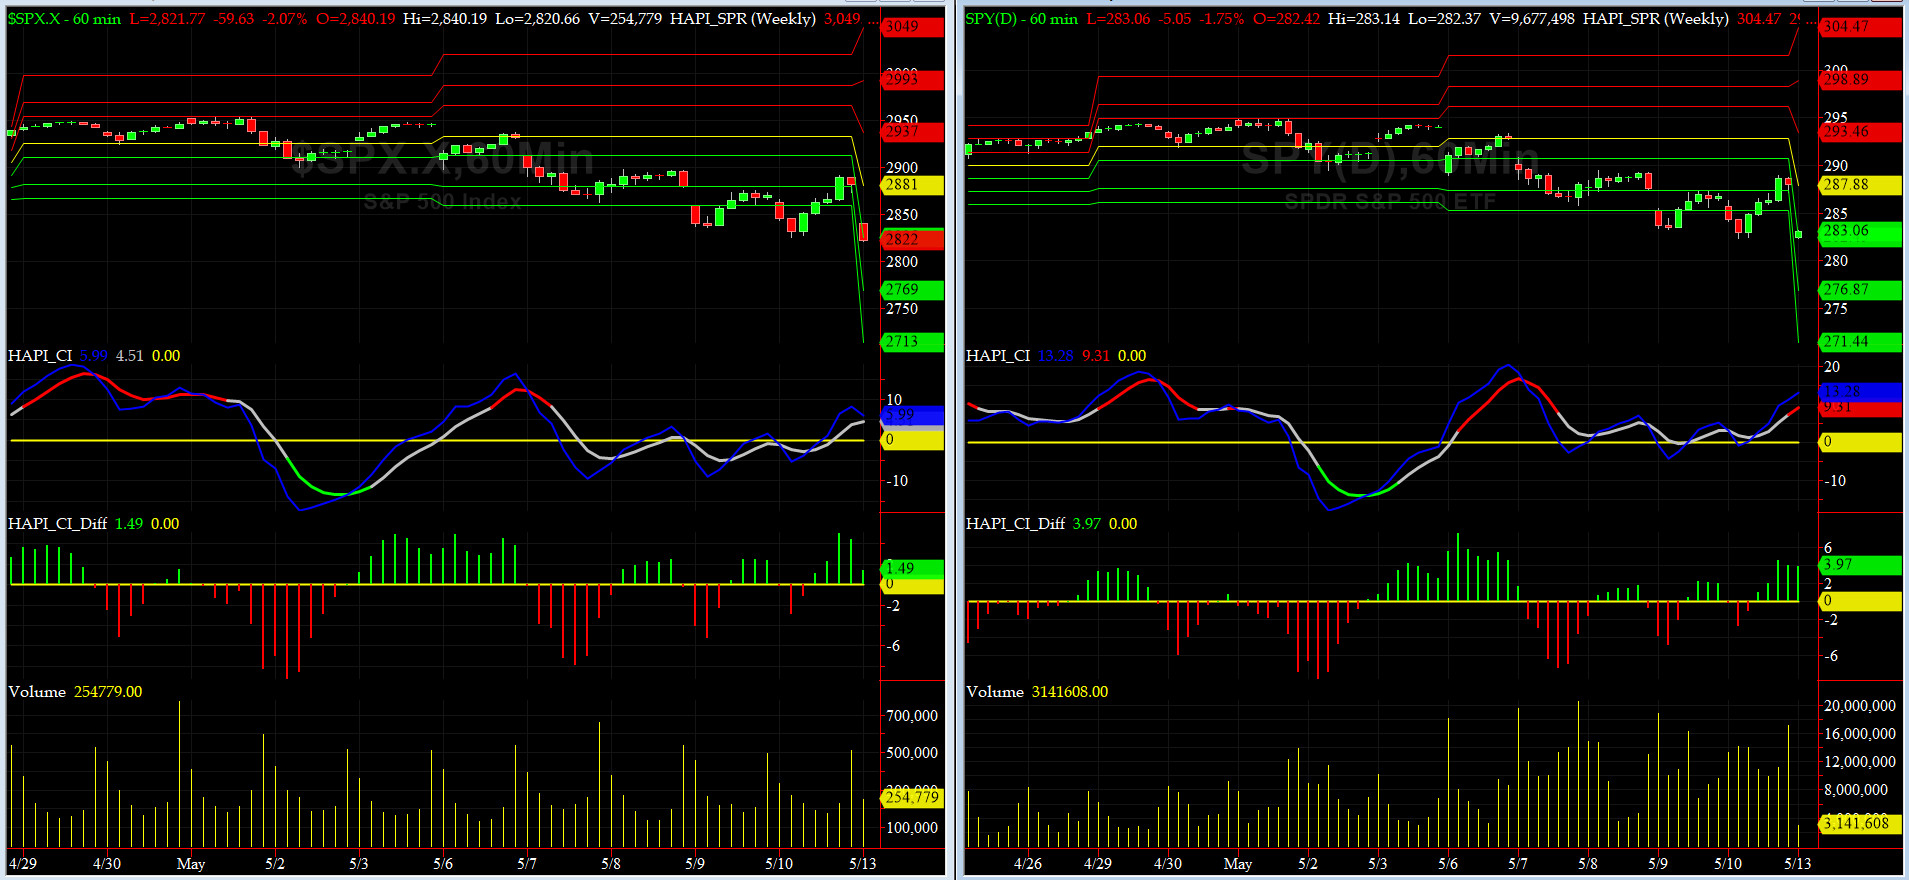
Timer Charts of S&P-500 Cash Index (SPX) + NASDAQ-100 Cash Index (NDX)
Most recent S&P-500 Cash Index (SPX): 2881 down 65 (down -2.2%) for the week ending on Friday, May 10, 2019, which closed near its -1.5 sigma.
DJIA ALL TIME INTRADAY HIGH = 26951 (reached on Wednesday, October 3, 2018)
DJ TRAN ALL TIME INTRADAY HIGH = 11623 (reached on Friday, September 14, 2018)
SPX ALL TIME INTRADAY HIGH = 2954 (reached on Wednesday, May 1, 2019)
NDX ALL TIME INTRADAY HIGH = 7852 (reached on Wednesday, May 1, 2019)
RUT ALL TIME INTRADAY HIGH = 1742 (reached on Friday, August 31, 2018)
Current DAILY +2 Sigma SPX = 2959 with WEEKLY +2 Sigma = 3042
Current DAILY 0 Sigma SPX = 2914 with WEEKLY 0 Sigma = 2773
Current DAILY -2 Sigma SPX = 2869 with WEEKLY -2 Sigma = 2453
NYSE McClellan Oscillator = -93 (-150 is start of the O/S area; around -275 to -300 area or lower, we go into the �launch-pad� mode; over +150, we are in O/B area)
NYSE Breadth Thrust = 48 (40 is considered as oversold and 65 as overbought)
Monday & Tuesday, markets pulled back strongly. Wednesday and Thursday, we ended up going sideways to slightly down but then on Friday we rallied pretty much right about when Europe closed.
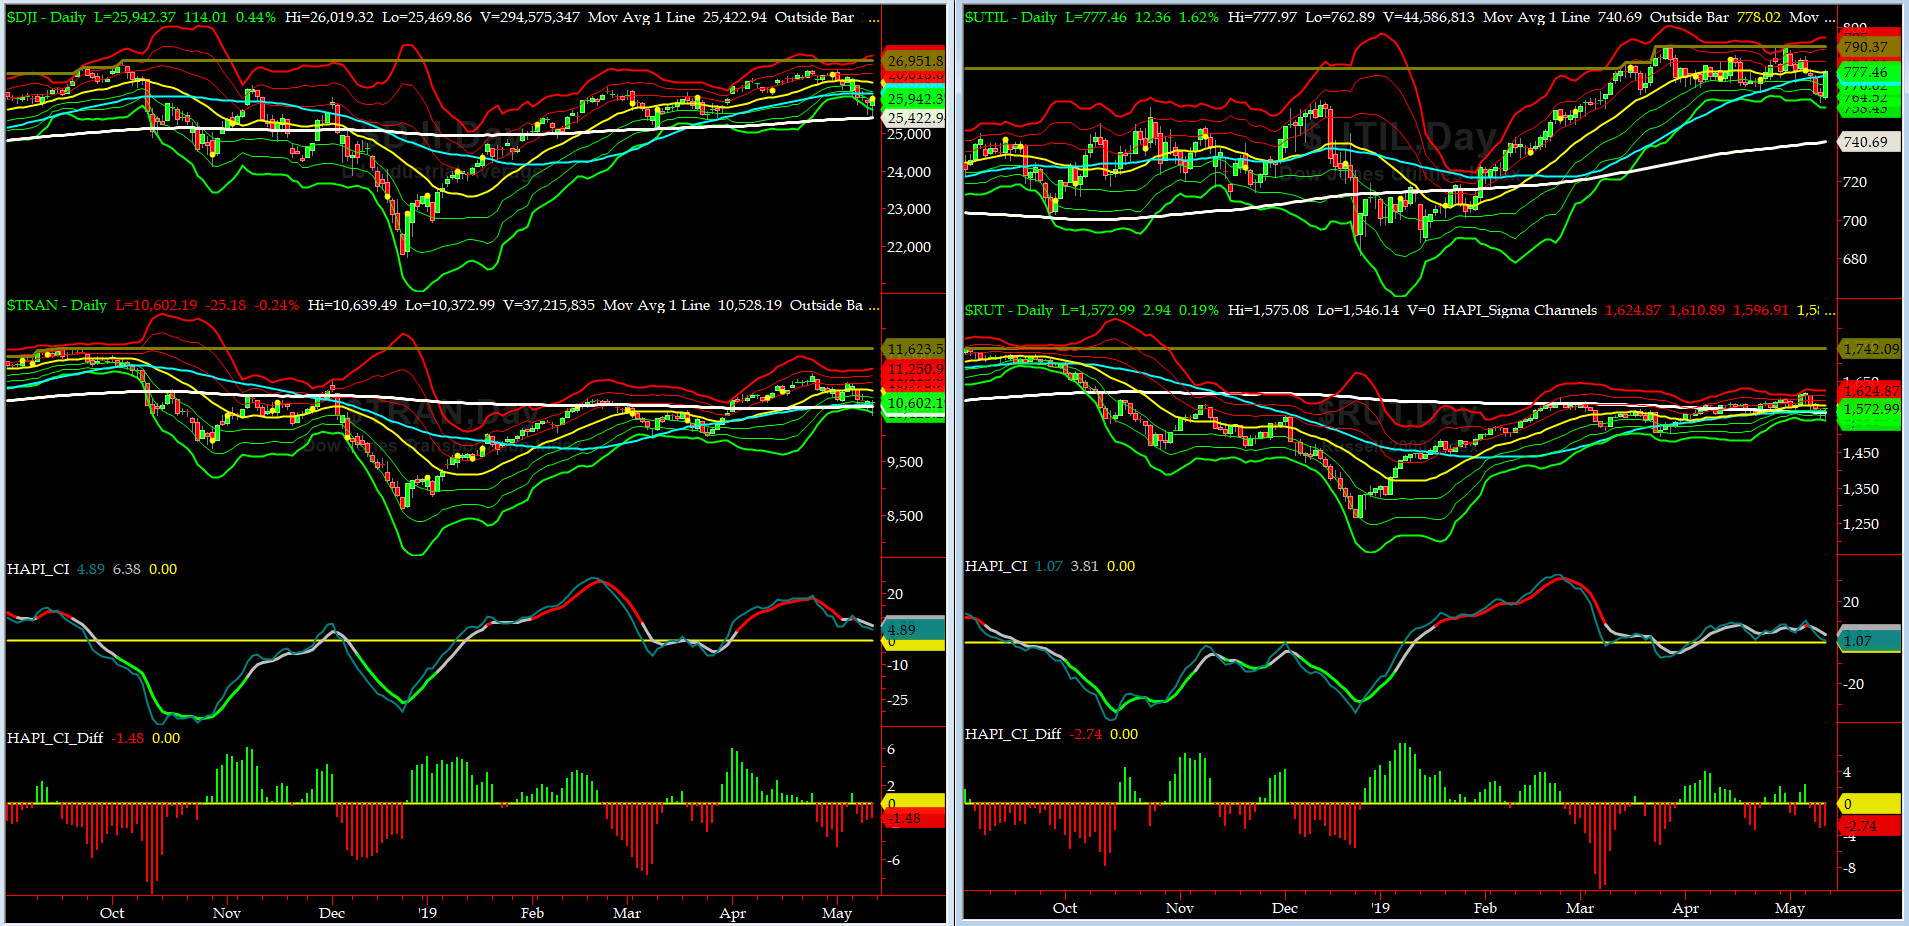
Canaries [in the Coal Mine] Chart for DJ TRAN & RUT Indices
200-Day MA DJ TRAN = 10,528 or 0.7% BELOW DJ TRAN (max observed in last 7 yrs = 20.2%, min = -20.3%)
200-Day MA RUT = 1562 or 0.7% BELOW RUT (max observed in last 7 yrs = 21.3%, min = -22.6%)
DJ Transportation Index (proxy for economic conditions 6 to 9 months hence) sold off during first half of last week then stabilized.
Russell 2000 Small Caps Index (proxy for Risk ON/OFF) also sold off but less dramatically (percentage wise).
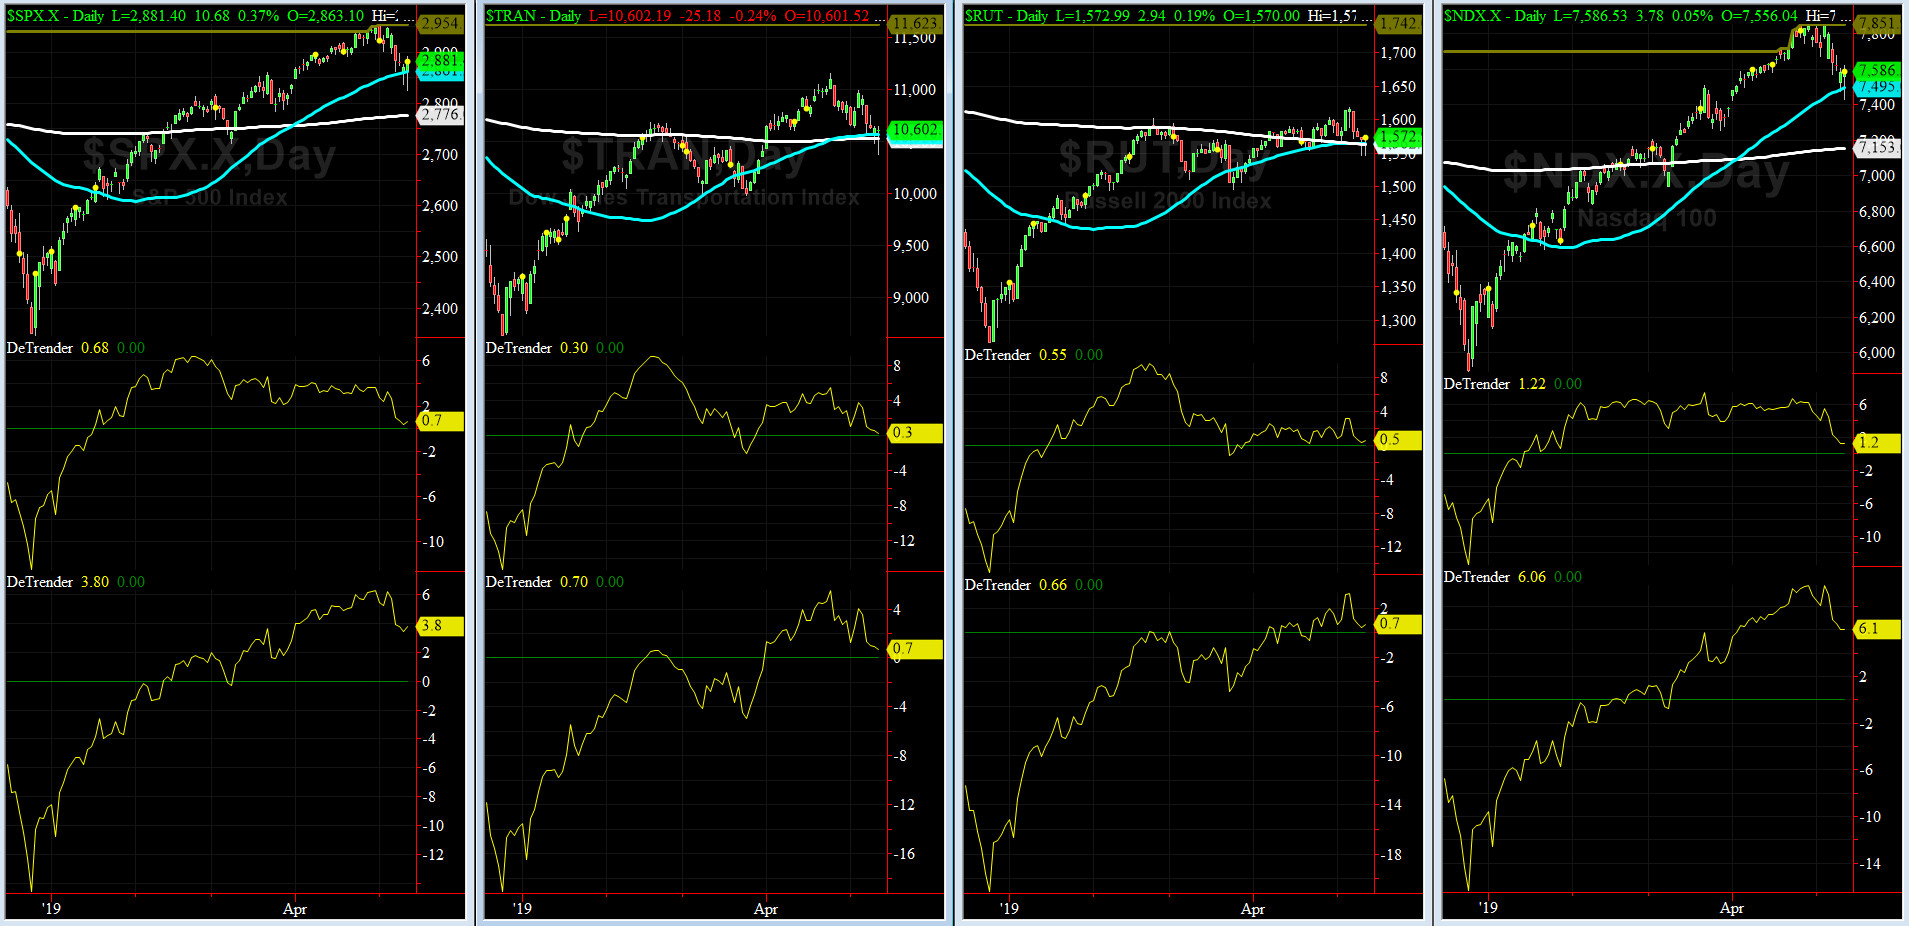
DeTrenders Charts for SPX, NDX, TRAN & RUT Indices
50-Day MA SPX = 2861 or 0.7% BELOW SPX (max observed in last 7 yrs = +8.6%, min = -9.3%)
200-Day MA SPX = 2776 or 3.8% BELOW SPX (max observed in last 7 yrs = 15.2%, min = -14%)
ALL of our EIGHT DeTrenders are in the POSITIVE territory. The DeTrenders for DJ Tran & RUT will continue to be harbingers of future price behavior in broad indices.
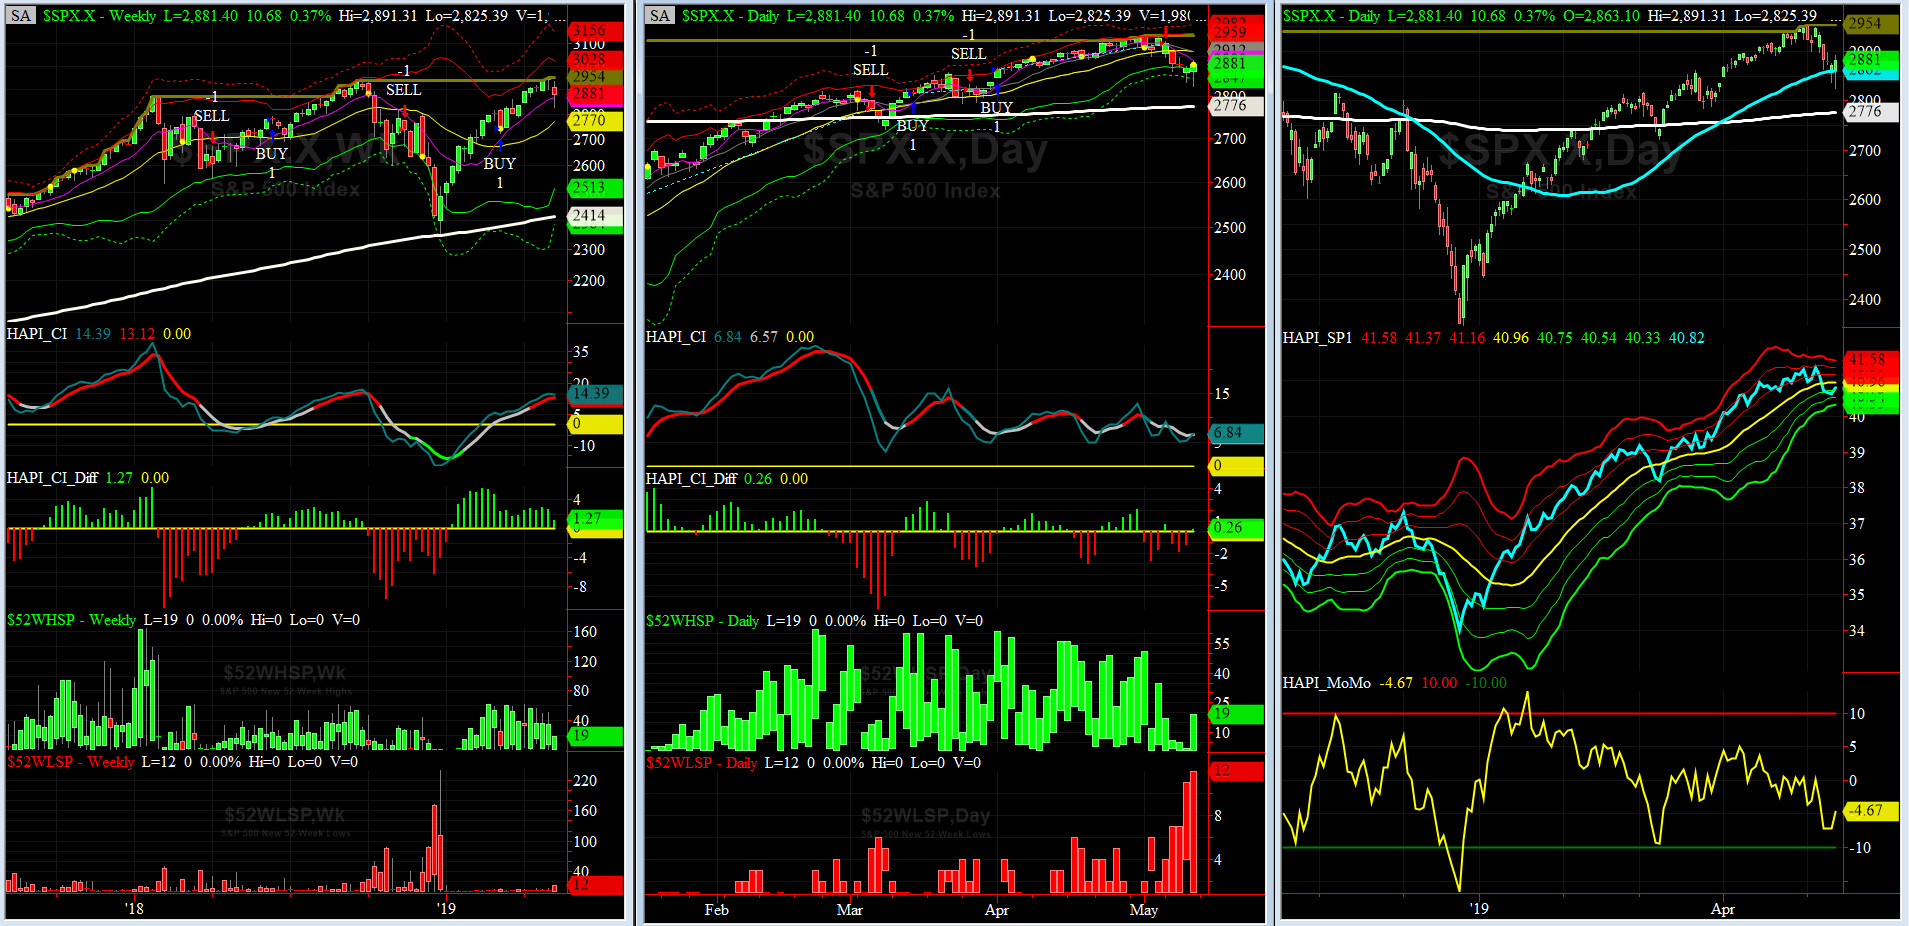
HA_SP1_Momo Chart
WEEKLY Timing Model = on a BUY Signal since Friday, March 8, 2019 CLOSE at 2743
DAILY Timing Model = on a SELL Signal since Monday, May 6, 2019 CLOSE at 2932
Max SPX 52wk-highs reading last week = 19 (over 120-140, the local maxima is in)
Max SPX 52wk-Lows reading last week = 12 (over 40-60, the local minima is in)
HA_SP1 closed near its -1 sigma channels
HA_Momo = -4.67 (reversals most likely occur above +10 or below -10)
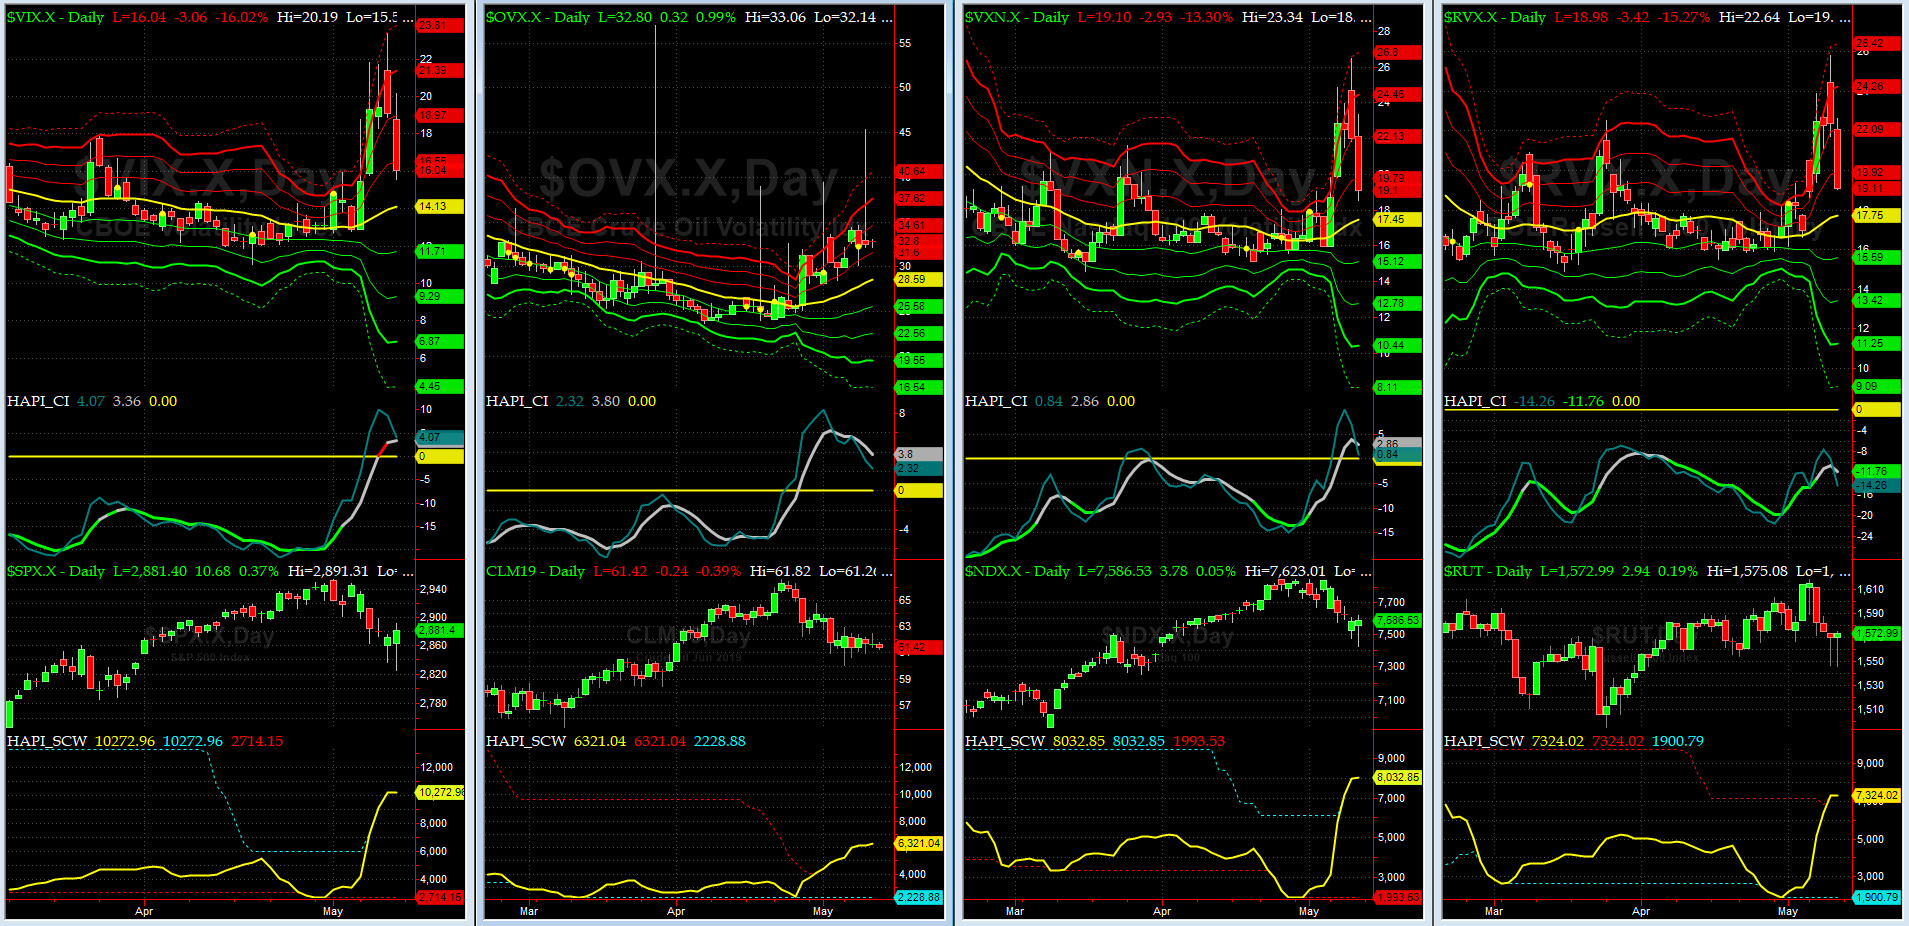
Vol of the Vols Chart
Spot VIX stood at 16 Friday night, at about its +0.5 sigma (remember it's the VIX volatility pattern aka "its sigma channels" that matters, and not the level of VIX itself (this is per Dr. Robert Whaley, a great mentor and inventor of original VIX, now called VXO). VIX usually peaks around a test of its +4 sigma).
A [larger] shockwave is in play now..... read more Rumi? @Capt_Tiko says NOPE... put it down, he thinks we will have some downside action here!
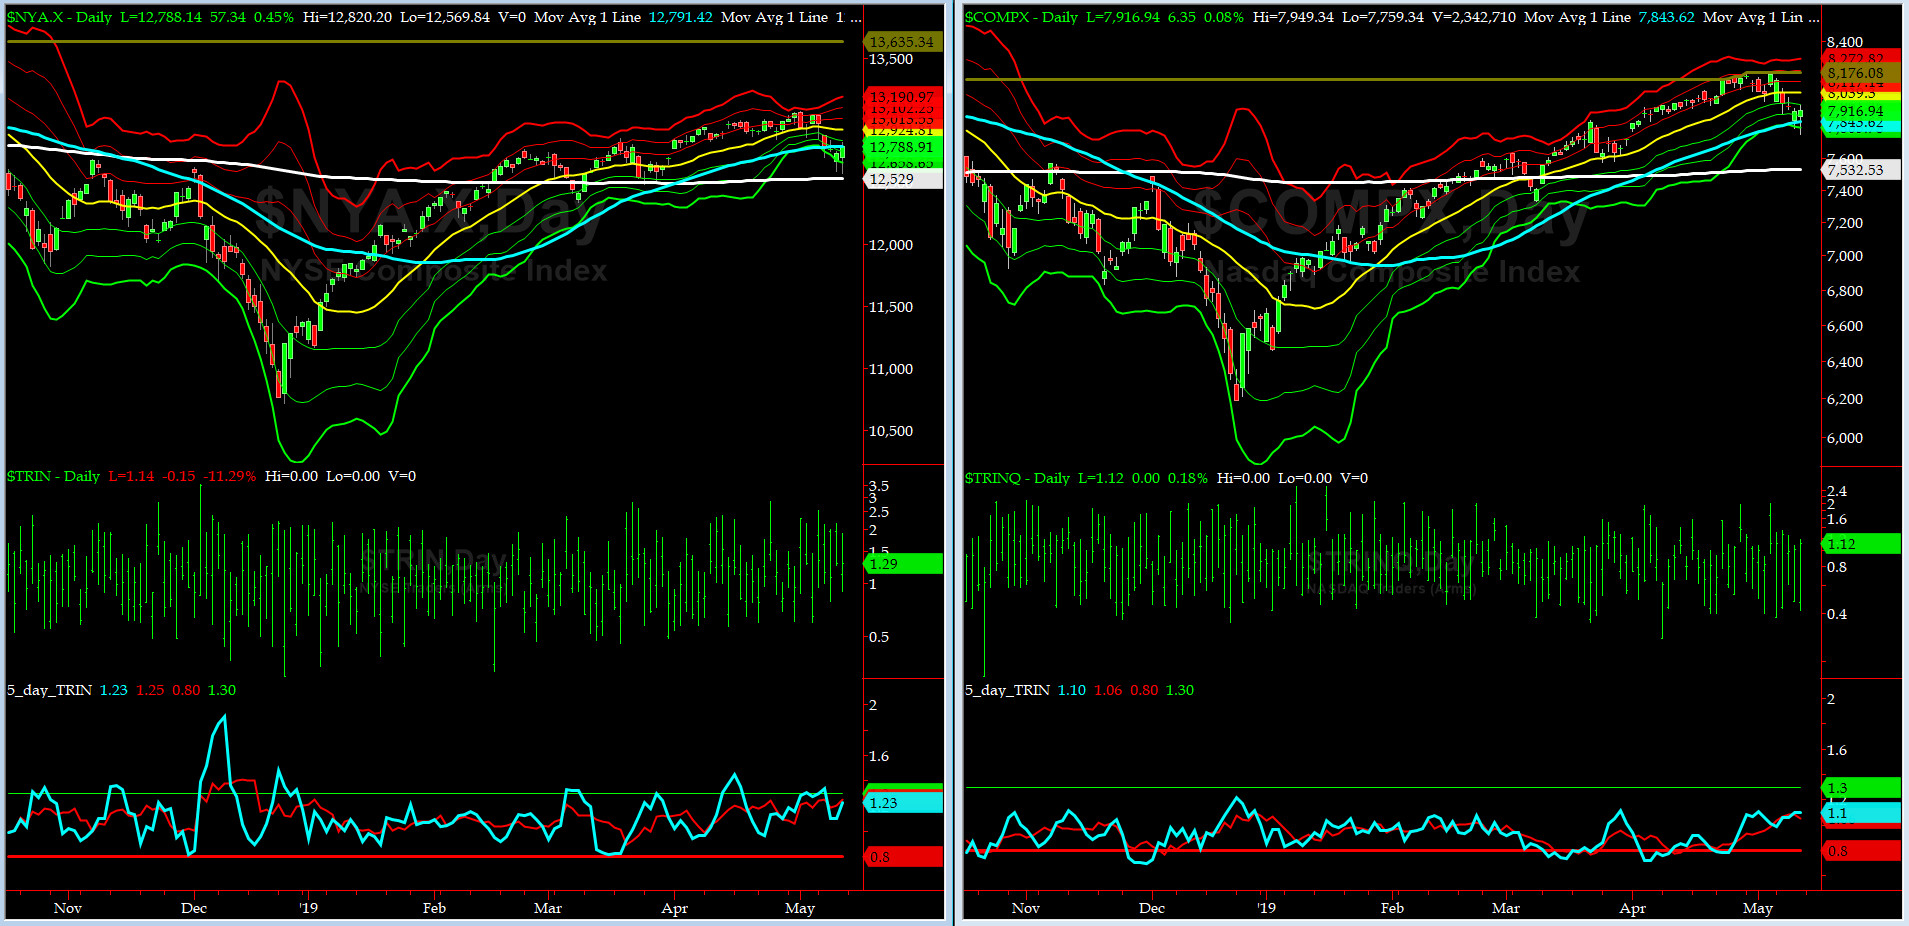
5-day TRIN & TRINQ Charts
Both NYSE 5-day TRIN & NASDAQ 5-day TRINQ are moving towards a "tradable" BUY signal -- could be a week or two away? most likely.
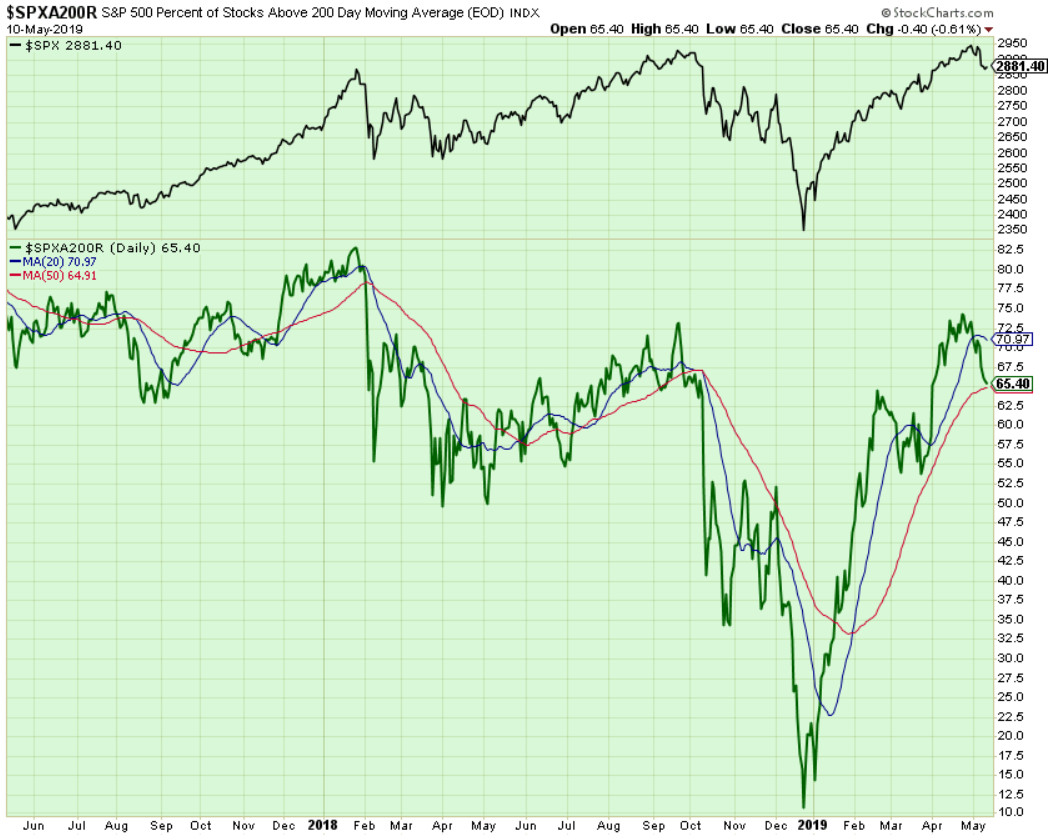
Components of SPX above their respective 200-day MA Chart
This scoring indicator dropped sharply to 65%. The Divergences we wrote about during the last couple of weeks, sure played out.

SPX SKEW (Tail Risk) Chart
On Friday, SPX SKEW (Tail Risk) closed near 118.5, now about its -1.5 sigma (normal = 120-125, range 100-150).
All quiet on the Eastern & Mid-Western Fronts? Still YES, this is according to our beloved HRH Capt Tiko, KCPE....
How to interpret the value of SPX SKEW? (from CBOE white paper on SKEW)

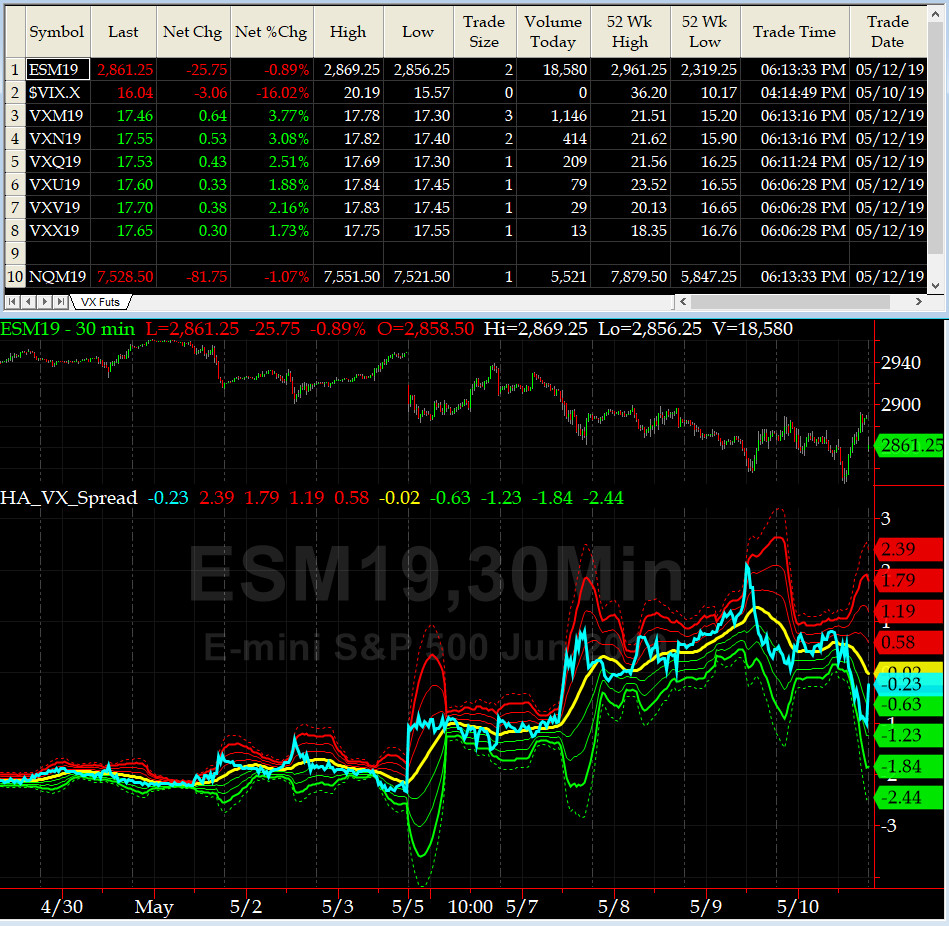
3-month VIX Futures Spread(VX) Chart
This popular timing indicator, (now long MAY19, & short AUG19 VIX Futures) hit +2.08 on Thursday first hour of RTH (about 1000ET) which translates to we are very near the bottom (which was retested the following day before we headed up).
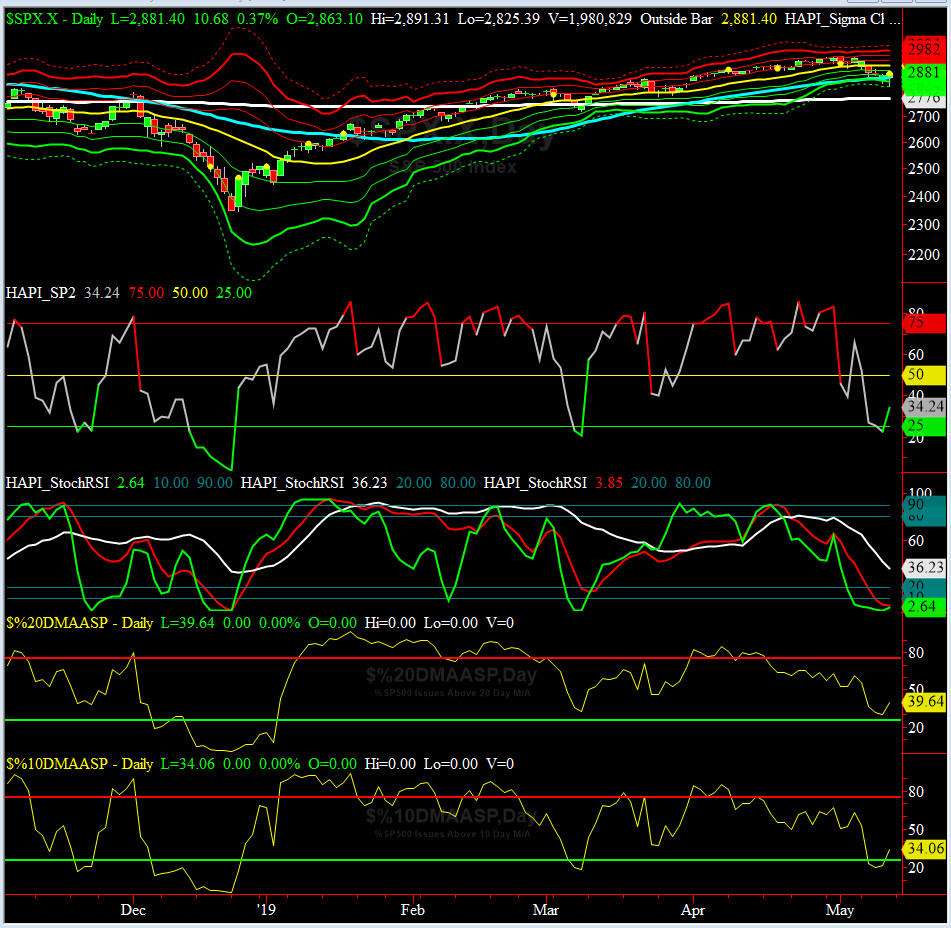
HA_SP2 Chart
HA_SP2 = 34 (Buy signal <= 25, Sell Signal >= 75)
Our coveted SP2 prop indicator dropped to 23 on Thursday (thus we went Long) and then rallied to 34.
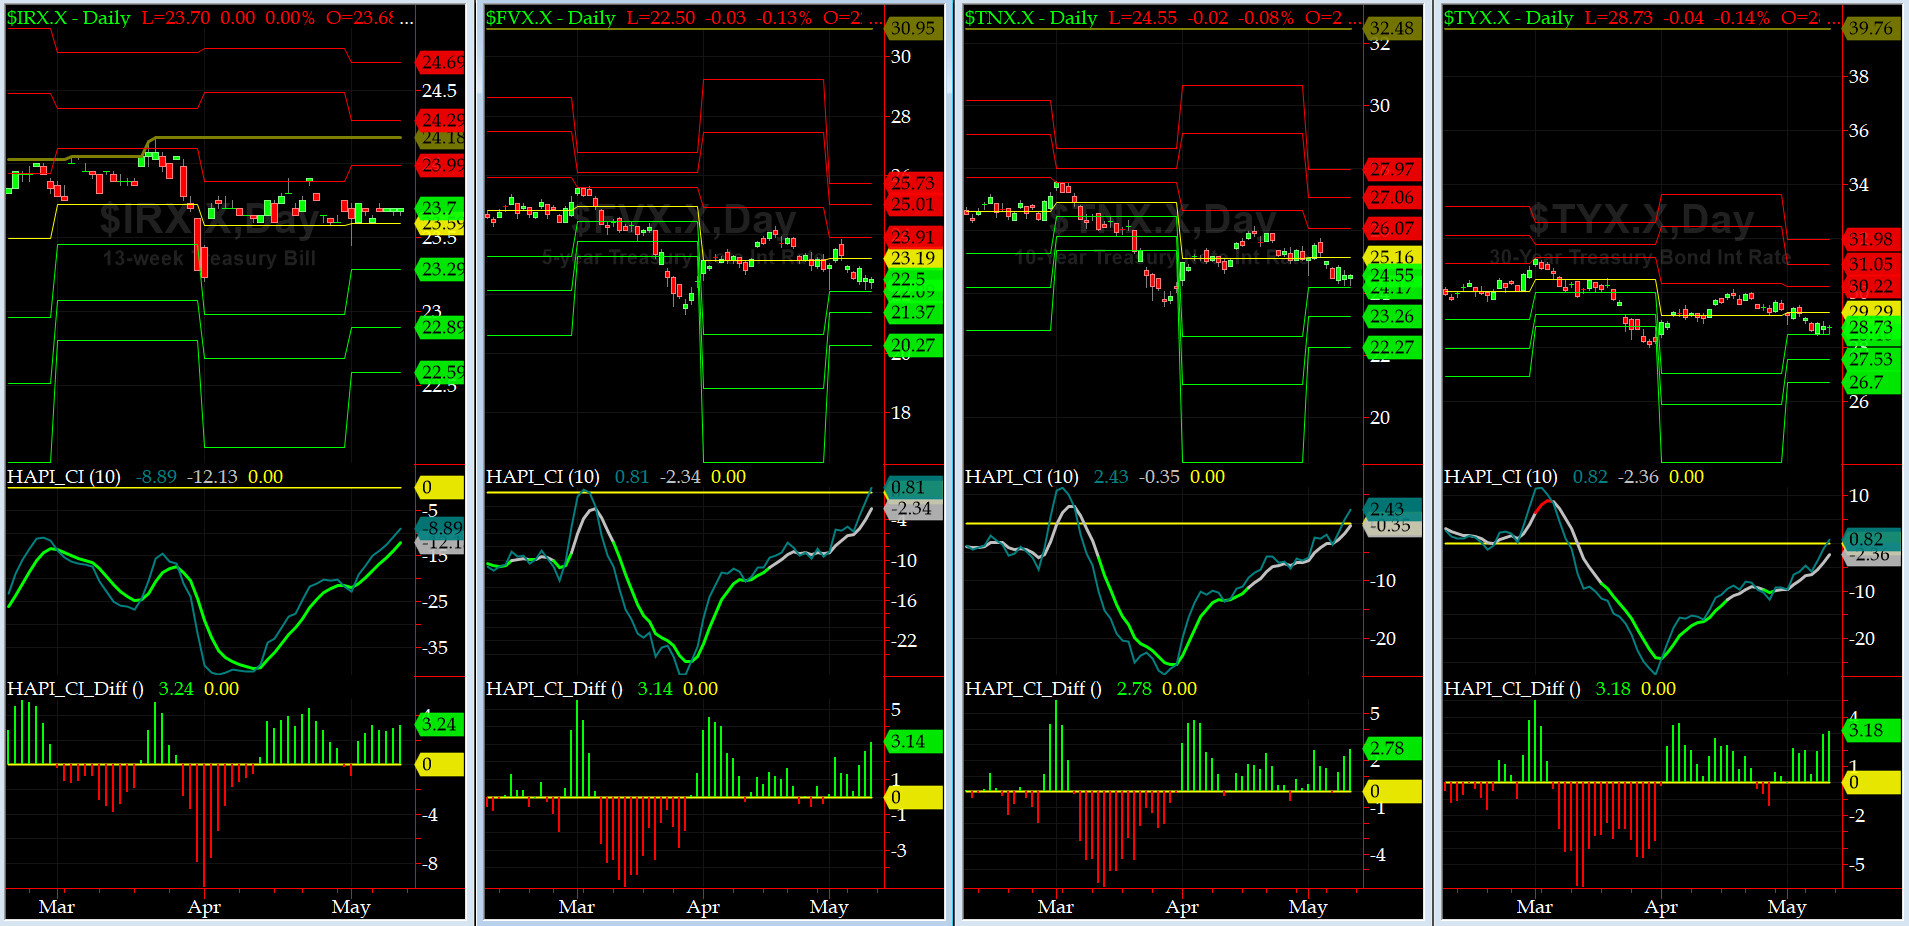
US Treasury T-Notes & T-Bonds Yields Chart
During last week, Yield Curve just eased off more as Maury got more upset.
Fari Hamzei
|
|
|
|
|
|
Sunday, May 12, 2019, 1829ET
Notice of Change of Bias with Timer Digest
Dear Jim,
Every time our prop Market Timing Indicators get shunt away (as we say in EE) by a strong exogenous news (in this case, trade war), we must act nimble & decisive.
Friday�s promise of positive discourse with Chinese high-level trade negotiators visiting Washington DC, turned out to be another fantasy, created by an impulsive & under-siege White House.
Accordingly, we are abandoning our recent LONG SPX bias, and, going back to being SHORT SPX, say, for about 3 days +/- 1.
Fari Hamzei
|
|
|
|
|
|
Customer Care:
|
|
|
|
|
|
|
 |
 |
|
 |
|
 |
 |
 |
HA YouTube Channel ::: HA Blog ::: Testimonials ::: Tutorials & FAQs ::: Privacy Policy
|
Trading Derivatives (Options & Futures) contains substantial risk and is not for every investor. An investor could potentially lose all or more than his/her initial investment.
Only risk capital should be used for trading and only those with sufficient risk capital should consider trading derivatives. Past performance is not
necessarily indicative of future results. Testimonials appearing on this website may not be representative of other clients or customers
and are not a guarantee of future performance or success.
|
| (c) 1998-2025, Hamzei Analytics, LLC.® All Rights Reserved. |
|
|