
|
 |
 |
 |
 |
 |
 |
 |
 |
 Proactive Market Timing Proactive Market Timing
|
|
|
Most Recent PMT vs SPX Performance Chart

|
|
|
|
Friday, June 7, 2019, 1112ET
Notice of Change of Bias with Timer Digest
Dear Jim,
Our prop SP2 Indicator is over 75 (overbought threshold) now, so we are going FLAT SPX today at the Close.
Have a great weekend�..
Fari Hamzei
|
|
|
|
|
|
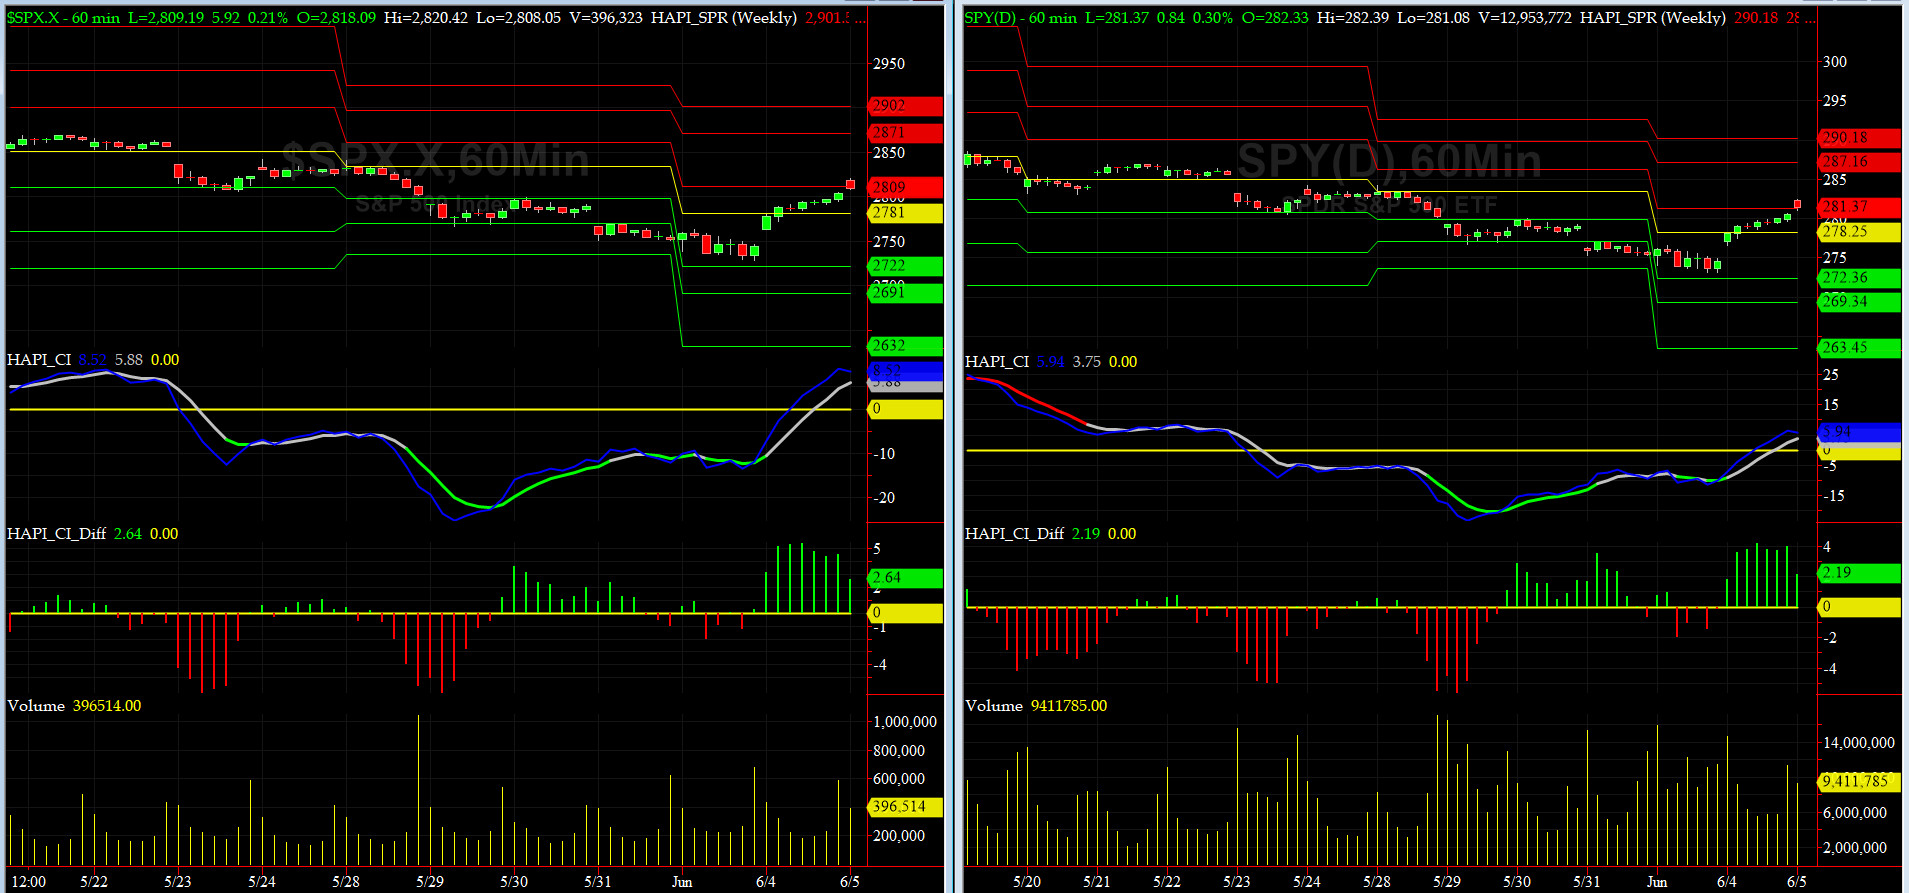
Wednesday, June 5, 2019, 1015ET
5
Companion Chart for Market Bias Review, Issue #293
|
|
|
|
|
|
Wednesday, June 5, 2018, 1005ET
Market Bias for Issue #287
Our current Market Bias with Timer Digest is LONG SPX as of JUN 4 at 2803
Our previous Market Bias was SHORT SPX as of MAY 30 at 2788
Here are the trade parameters for this week:
SPX Secondary Profit Target for last 20% of our position = 2870
SPX Primary Profit Target for first 80% of our position = 2850
SPX BreakEven Stop (Current Price) for last 20% of our position = 2805
SPX Money Management Stop for 100% of our position = 2785
|
| Action |
Asset |
Expiration |
Strike |
Option |
| BUY |
SPY |
Friday JUN 28 |
282 |
Calls |
| SELL SHORT |
SPY |
Friday JUN 28 |
287 |
Calls |
| You need to execute both legs and hold it as a Call-Spread.
|
Note A:
Once the Primary Profit Target has been reached, traders are advised to close 80% of their position in order to lock in profits. The remaining balance can be carried over with a BreakEven STOP, based on the SPX level at the time of entry, in order to make the trade a zero-risk trade with the final position running to reach the Secondary Profit Target.
Once either Secondary Profit or Money Management (BreakEven STOP after the 80% peel-off) is hit, our Option/ETF trade for that week is over. Go to Cash and wait for the next PMT Issue.
Note B:
When we change our Market Bias with Timer Digest, You need to go FLAT asap. With PMT Pro, that is before the Close that day and with the basic PMT, at the open of the next day. The following trading day, we will issue new SPX targets and a new SPY options trade, as long our new market bias with Timer Digest is NOT flat.
Fari Hamzei
|
|
|
|
|
|
Tuesday, June 4, 2019, 2233ET
Notice of Change of Bias with Timer Digest
Dear Jim,
While no one can predict, with any certainty, what a Fed Chair would say at a Monetary Policy Conference, we should have at least moved to the sidelines last night when our prop SP2 Indicator dipped below 25 for 2nd time in 3 weeks and closed at ~16.
Well, we did not do that and thus gave back 2% today.
So, let�s get LONG SPX here. We are not sure about the duration of this trade, as of this writing, as we have a very unpredictable executive branch, caught in a web of legal issues that finds it convenient to use economic headlines to deflect.
Fari Hamzei
|
|
|
|
|
|
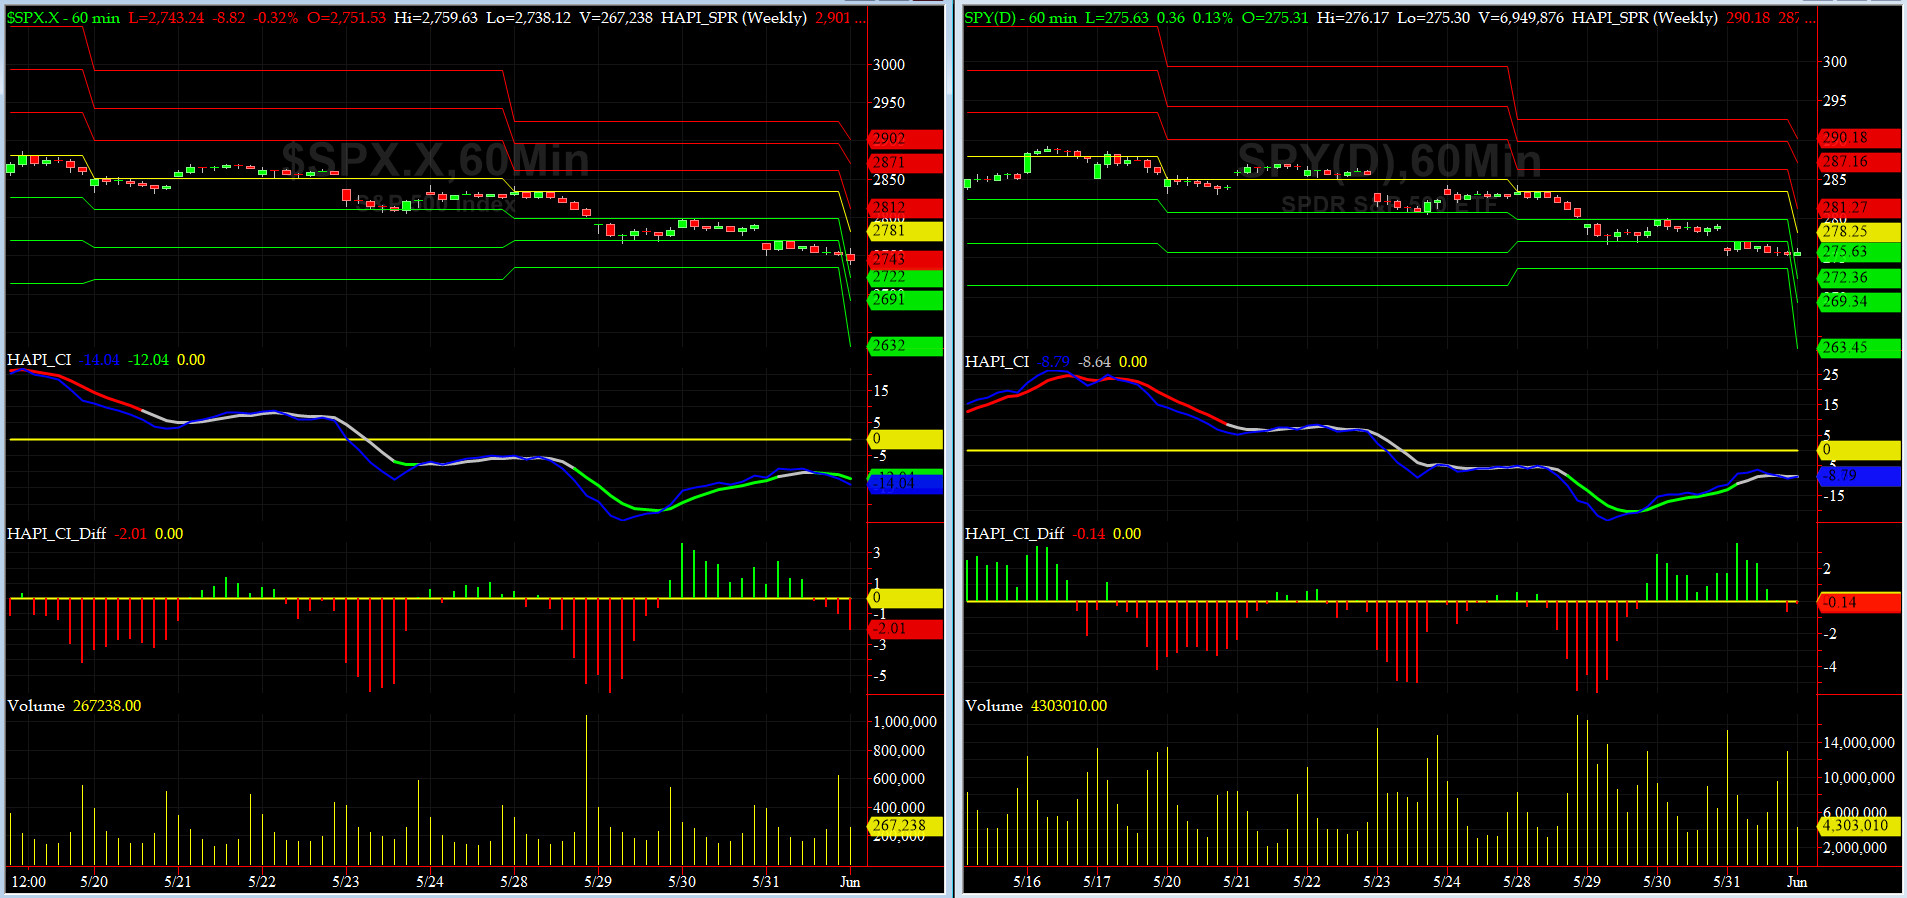
Monday, June 3, 2019, 1010ET
Companion Chart for Market Bias Review, Issue #293
|
|
|
|
|
|
Monday, June 3, 2019, 1005ET
Market Bias for Issue #293
Our current Market Bias with Timer Digest is SHORT SPX as of MAY 30 at 2788
Our previous Market Bias was FLAT SPX as of MAY 29 at 2783
Here are the trade parameters for this week:
SPX Money Management Stop for 100% of our position = 2780
SPX BreakEven Stop (Current Price) for last 20% of our position = 2751
SPX Primary Profit Target for first 80% of our position = 2725
SPX Secondary Profit Target for last 20% of our position = 2700
|
| Action |
Asset |
Expiration |
Strike |
Option |
| BUY |
SPY |
Friday JUN 21 |
275 |
Puts |
| SELL SHORT |
SPY |
Friday JUN 21 |
270 |
Puts |
| You need to execute both legs and hold it as a Put-Spread.
|
Note A:
Once the Primary Profit Target has been reached, traders are advised to close 80% of their position in order to lock in profits. The remaining balance can be carried over with a BreakEven STOP, based on the SPX level at the time of entry, in order to make the trade a zero-risk trade with the final position running to reach the Secondary Profit Target.
Once either Secondary Profit or Money Management (BreakEven STOP after the 80% peel-off) is hit, our Option/ETF trade for that week is over. Go to Cash and wait for the next PMT Issue.
Note B:
When we change our Market Bias with Timer Digest, You need to go FLAT asap. With PMT Pro, that is before the Close that day and with the basic PMT, at the open of the next day. The following trading day, we will issue new SPX targets and a new SPY options trade, as long our new market bias with Timer Digest is NOT flat.
Fari Hamzei
|
|
|
|
|
|
Monday, June 3, 2019, 0915ET
Market Timing Charts, Analysis & Commentary for Issue #293
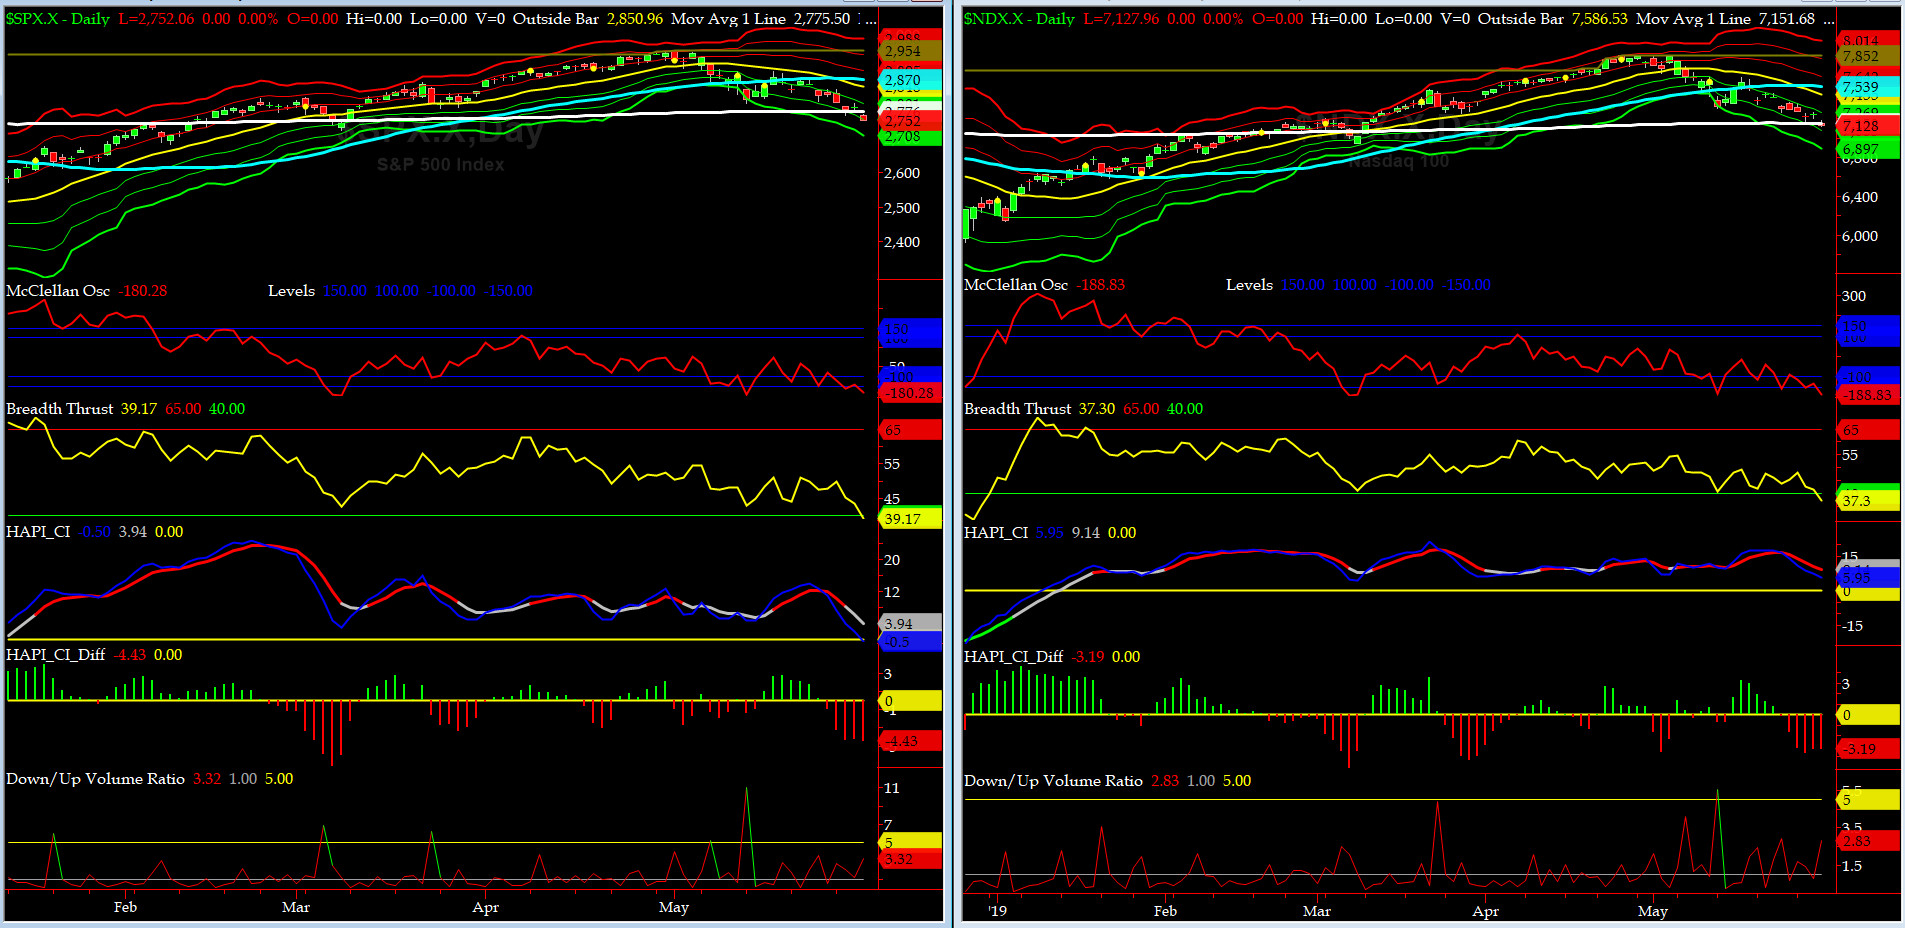
Timer Charts of S&P-500 Cash Index (SPX) + NASDAQ-100 Cash Index (NDX)
Most recent S&P-500 Cash Index (SPX): 2826 down 34 (down -1.2%) for the week ending on Friday, May 24, 2019, which closed near its -1 sigma.
DJIA ALL TIME INTRADAY HIGH = 26951 (reached on Wednesday, October 3, 2018)
DJ TRAN ALL TIME INTRADAY HIGH = 11623 (reached on Friday, September 14, 2018)
SPX ALL TIME INTRADAY HIGH = 2954 (reached on Wednesday, May 1, 2019)
NDX ALL TIME INTRADAY HIGH = 7852 (reached on Wednesday, May 1, 2019)
RUT ALL TIME INTRADAY HIGH = 1742 (reached on Friday, August 31, 2018)
Current DAILY +2 Sigma SPX = 2962 with WEEKLY +2 Sigma = 2995
Current DAILY 0 Sigma SPX = 2878 with WEEKLY 0 Sigma = 2804
Current DAILY -2 Sigma SPX = 2794 with WEEKLY -2 Sigma = 2613
NYSE McClellan Oscillator = -79 (-150 is start of the O/S area; around -275 to -300 area or lower, we go into the �launch-pad� mode; over +150, we are in O/B area)
NYSE Breadth Thrust = 47.9 (40 is considered as oversold and 65 as overbought)
Vols are coming back -- gap down action on Thursday was memorable. It's no longer just 'for some soup money.' Stay focused.
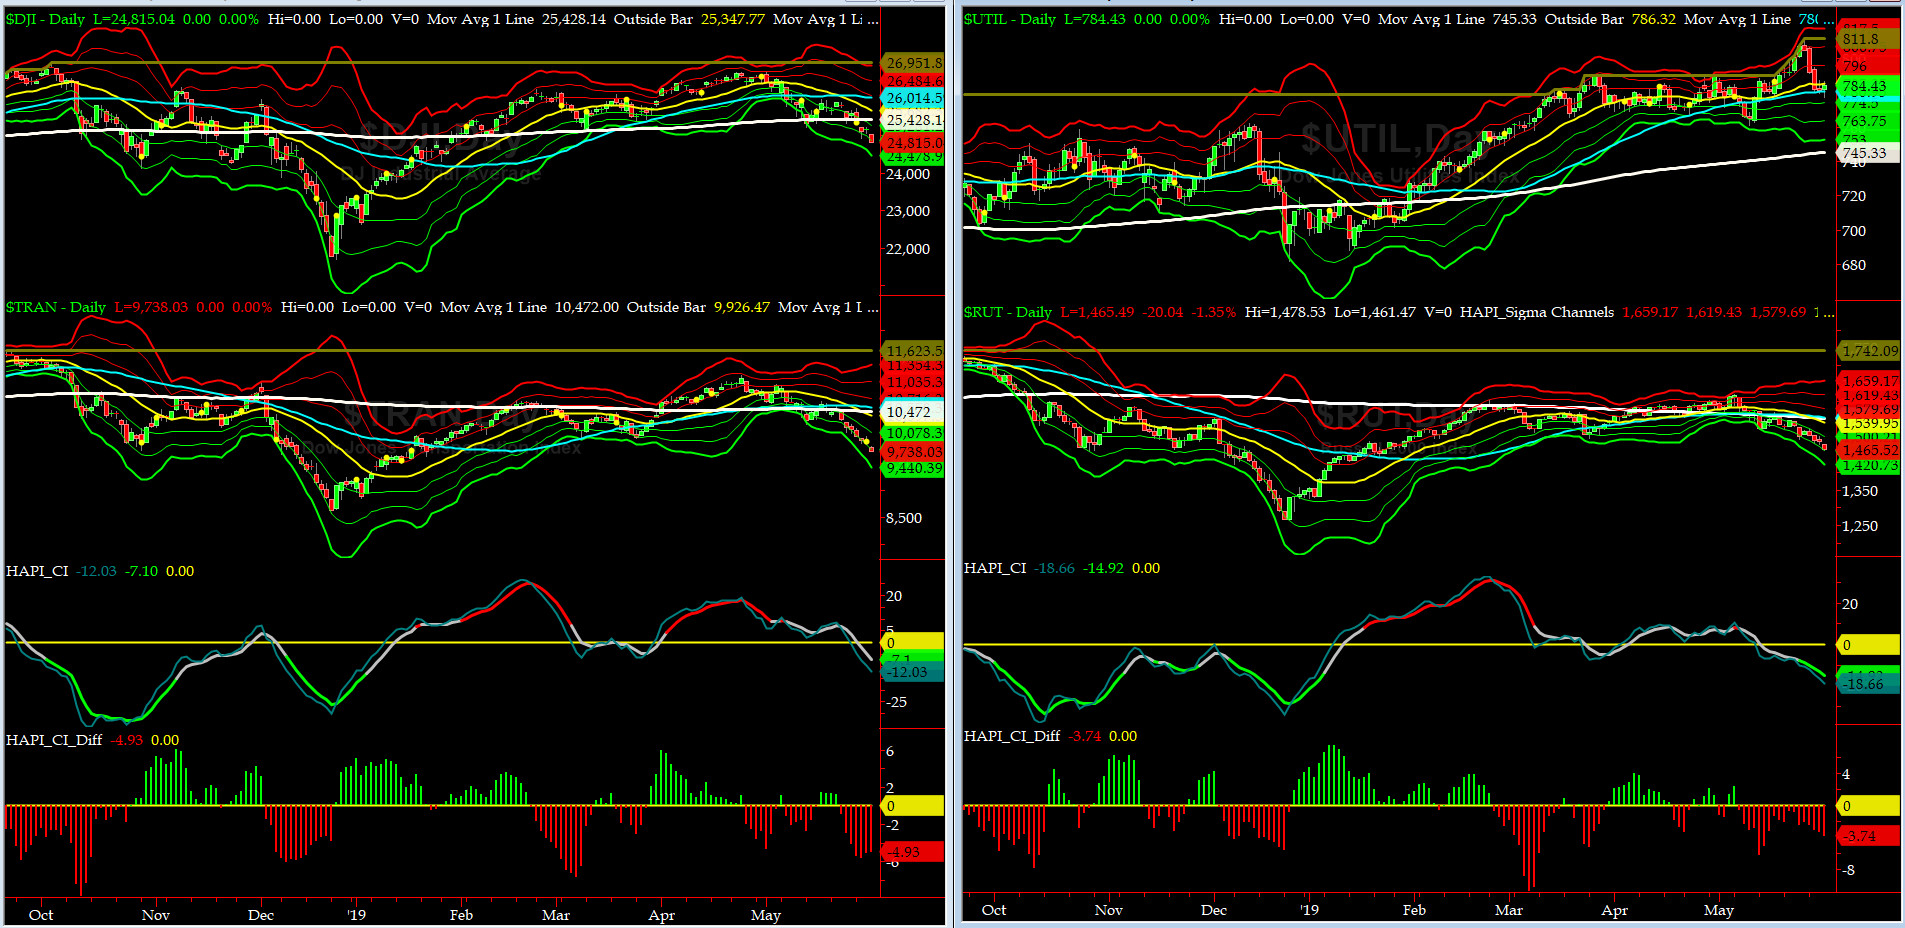
Canaries [in the Coal Mine] Chart for DJ TRAN & RUT Indices
200-Day MA DJ TRAN = 10,496 or 3.4% ABOVE DJ TRAN (max observed in last 7 yrs = 20.2%, min = -20.3%)
200-Day MA RUT = 1555 or 2.7 ABOVE RUT (max observed in last 7 yrs = 21.3%, min = -22.6%)
DJ Transportation Index (proxy for economic conditions 6 to 9 months hence) just keeps on selling. Bad omen to us economy going fwd? ubetcha (in Palingo).
Russell 2000 Small Caps Index (proxy for Risk ON/OFF) sold off pretty steadily..... RISK is OFF.... a quick note for Trumpkins: be extra careful.
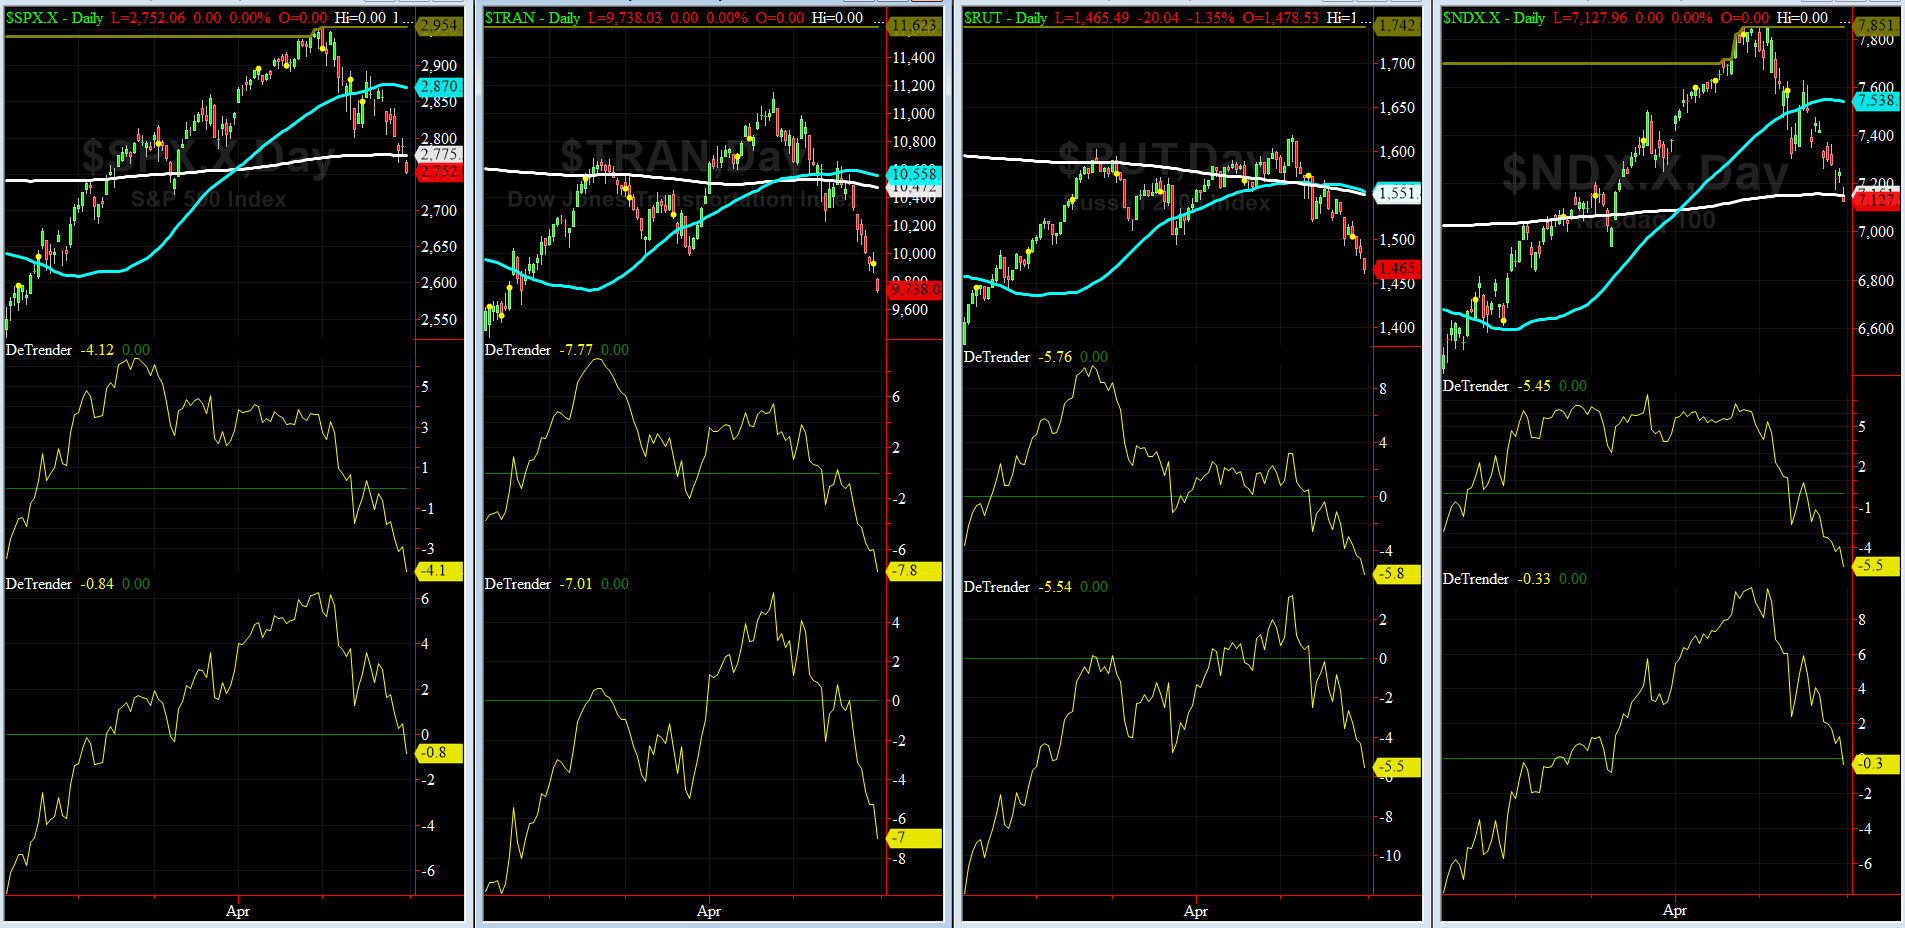
DeTrenders Charts for SPX, NDX, TRAN & RUT Indices
50-Day MA SPX = 2873 or 1.7% ABOVE SPX (max observed in last 7 yrs = +8.6%, min = -9.3%)
200-Day MA SPX = 2776 or 1.8% BELOW SPX (max observed in last 7 yrs = 15.2%, min = -14%)
Again, SIX of our EIGHT DeTrenders are in the NEGATIVE territory. The DeTrenders for DJ Tran & RUT will continue to be harbingers of future price behavior in broad indices.

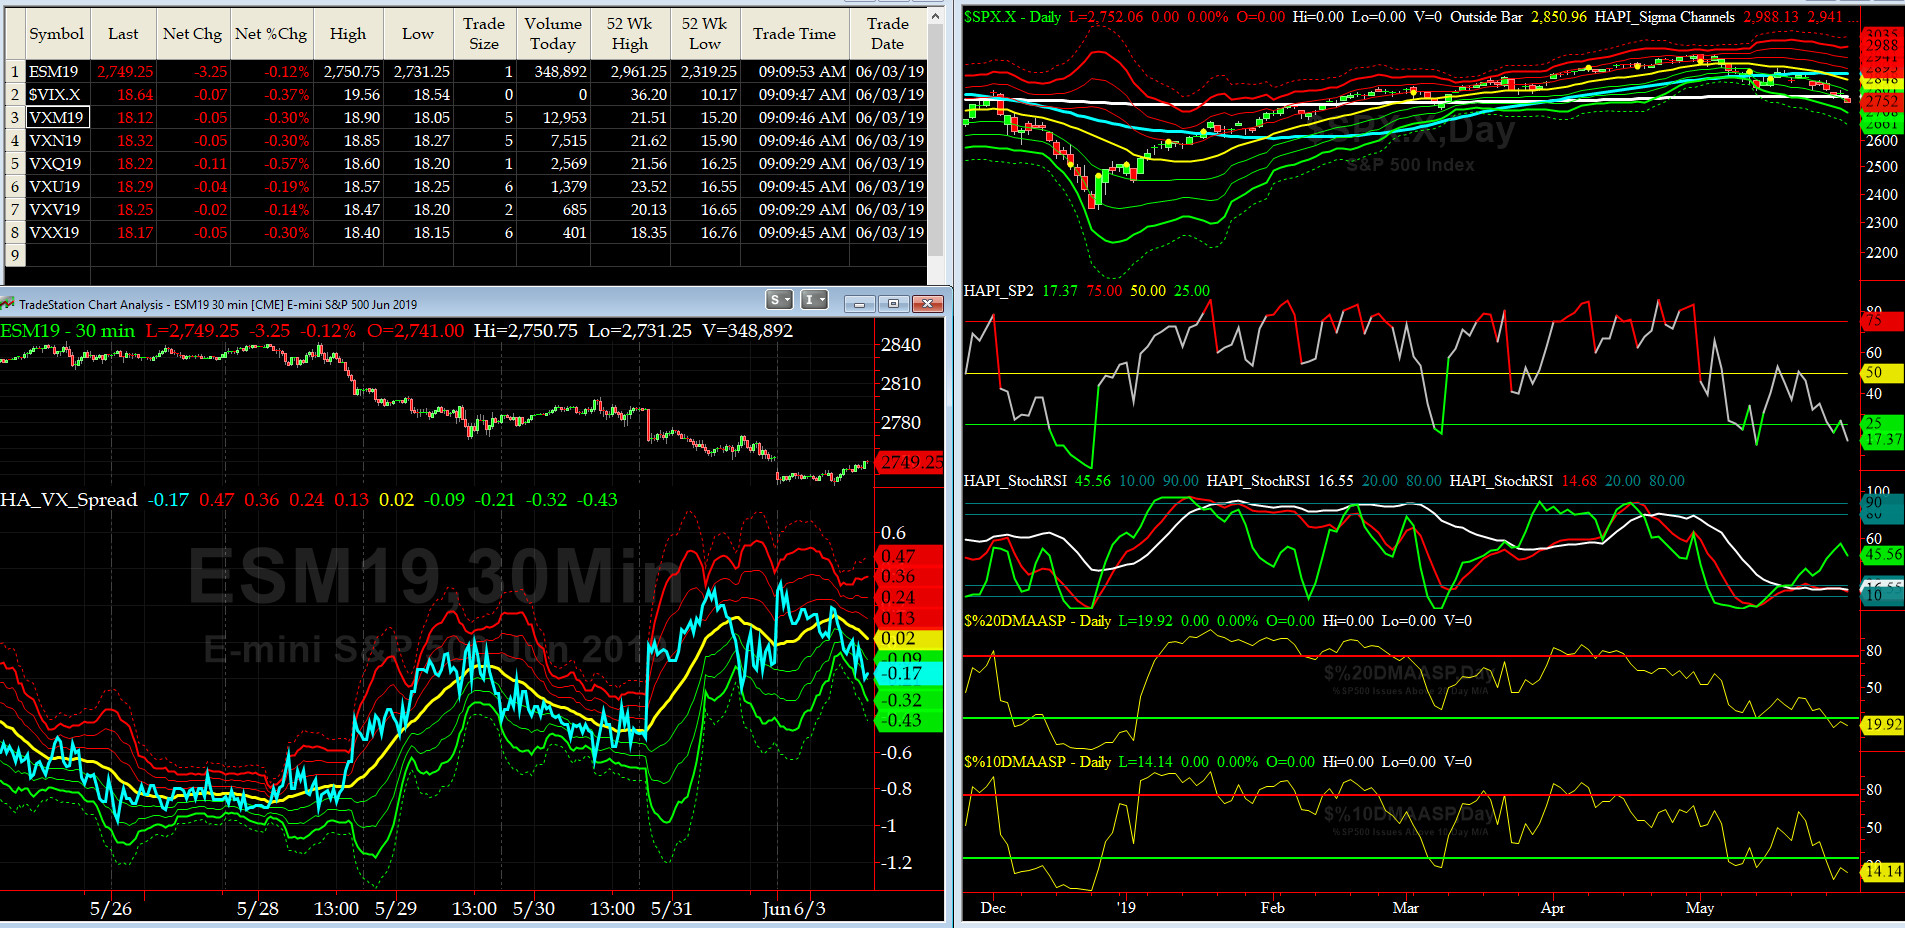
HA_SP1_Momo Chart
WEEKLY Timing Model = on a BUY Signal since Friday, March 8, 2019 CLOSE at 2743
DAILY Timing Model = on a SELL Signal since Friday, May 24, 2019 CLOSE at 2826
Max SPX 52wk-highs reading last week = 37 (over 120-140, the local maxima is in)
Max SPX 52wk-Lows reading last week = 26 (over 40-60, the local minima is in)
HA_SP1 closed near its zero sigma channels
HA_Momo = -2.9 (reversals most likely occur above +10 or below -10)
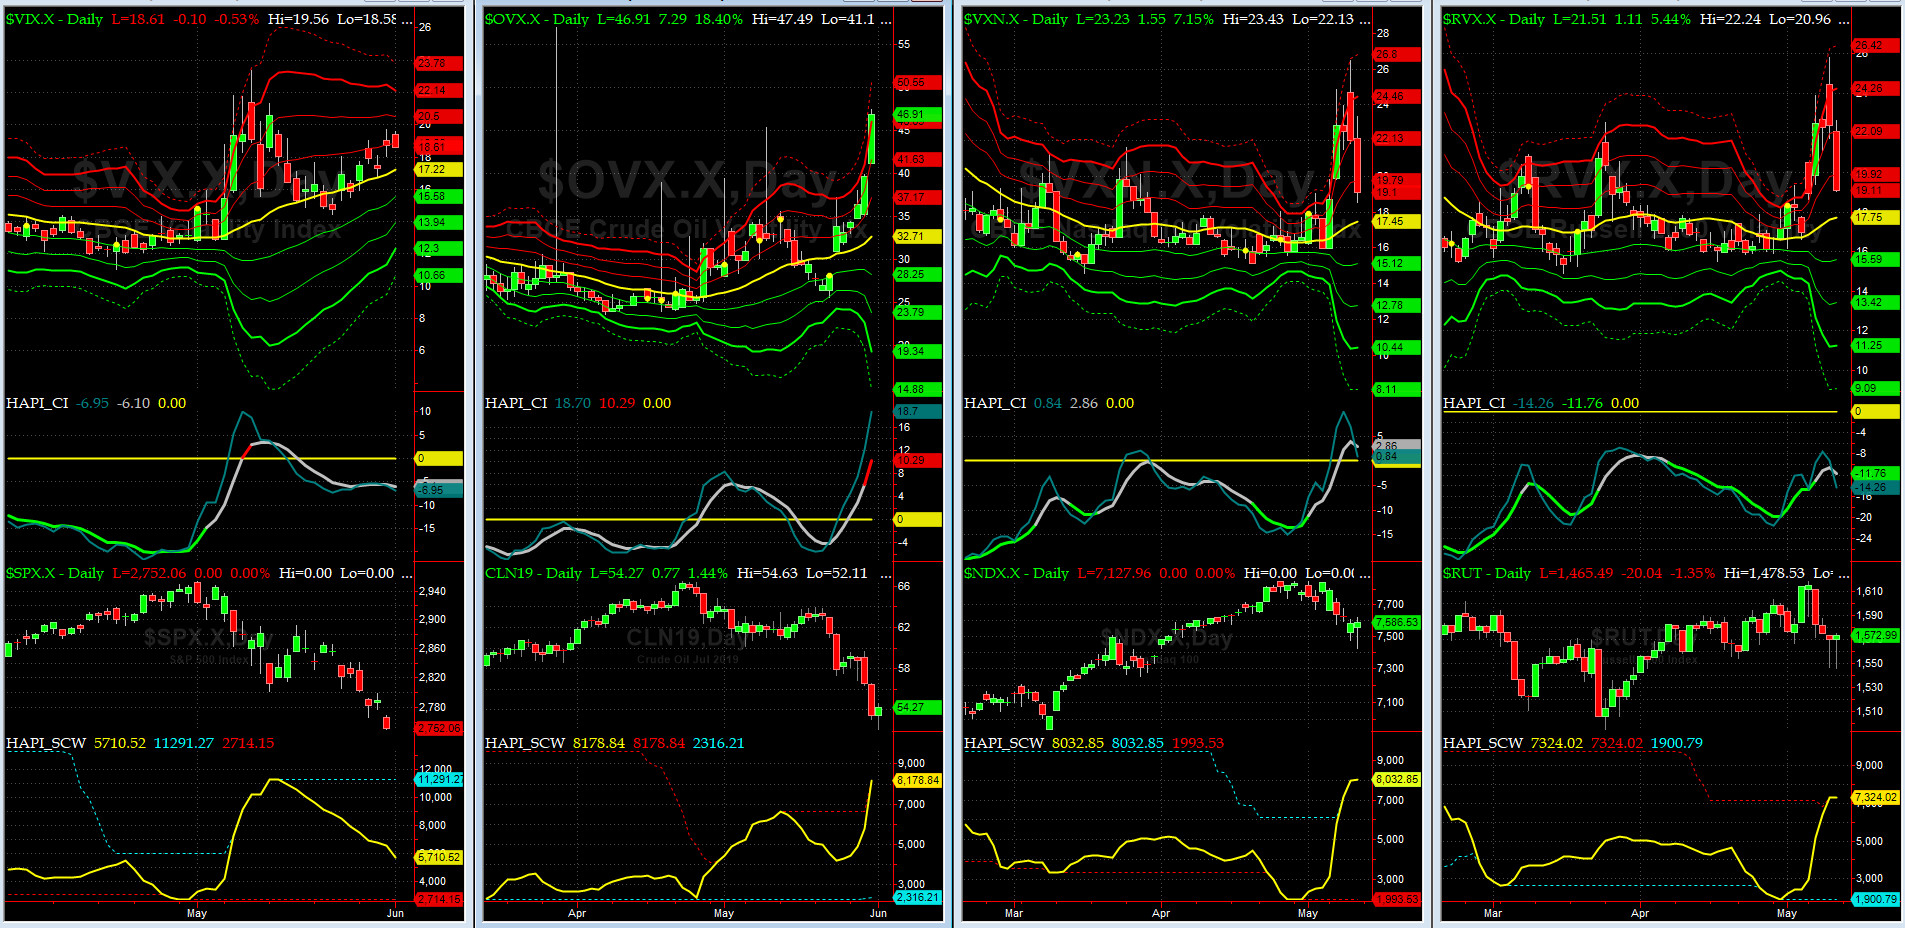
Vol of the Vols Chart
Spot VIX stood at 15.85 Friday night, at about its zero sigma (remember it's the VIX volatility pattern aka "its sigma channels" that matters, and not the level of VIX itself (this is per Dr. Robert Whaley, a great mentor and inventor of original VIX, now called VXO). VIX usually peaks around a test of its +4 sigma).
Vols of the Vols are collapsing. Keep your bet size in check. Long hot Summer days are here. Go to the Beach.

5-day TRIN & TRINQ Charts
Both NYSE 5-day TRIN & NASDAQ 5-day TRINQ are in NEUTRAL zones. No signal here.
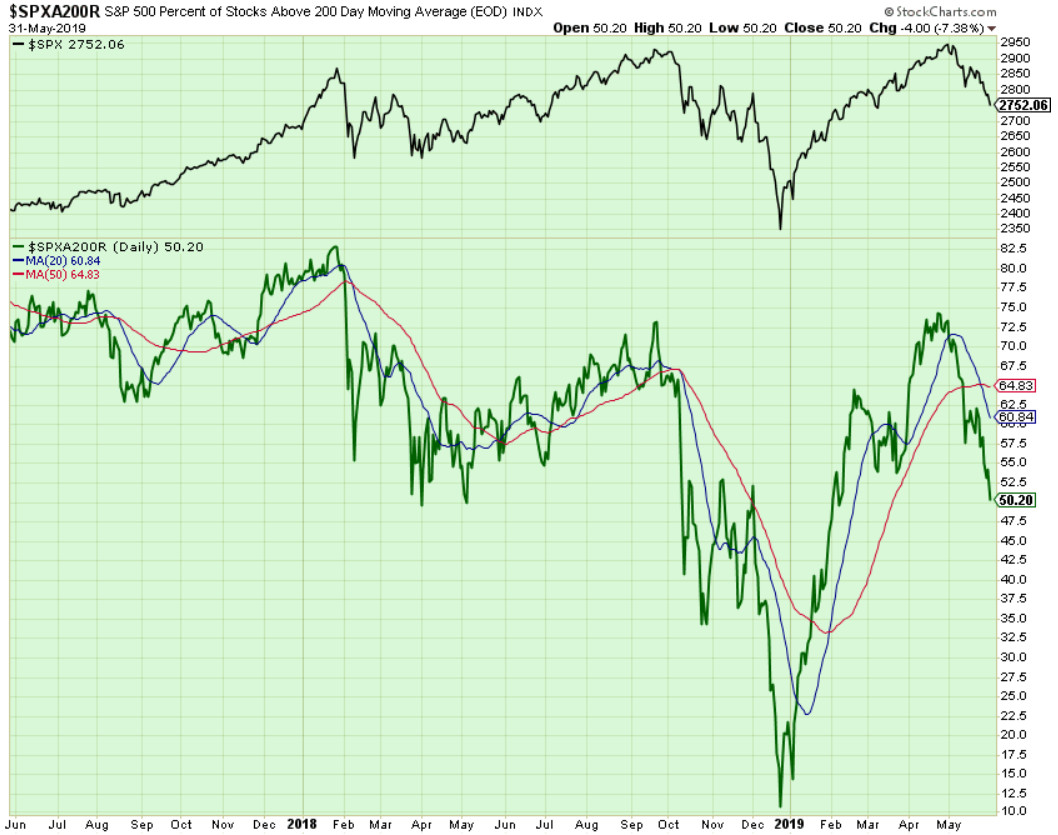
Components of SPX above their respective 200-day MA Chart
This scoring indicator dropped to 58% last week. As discussed in the webinars, watch for separations between this time series & its 20- & 50-day MAs.

SPX SKEW (Tail Risk) Chart
On Friday, SPX SKEW (Tail Risk) closed near 114.1, now about its -1 sigma (normal = 115, range 100-150).
All quiet on the Eastern & Mid-Western Fronts? YES, this is according to our beloved HRH Capt Tiko, KCPE....
How to interpret the value of SPX SKEW? (from CBOE white paper on SKEW)

3-month VIX Futures Spread(VX) Chart
This popular timing indicator, (now long JUN19, & short SEP19 VIX Futures) hit -0.75 on Friday Close which basically says: we are still near the bottom.
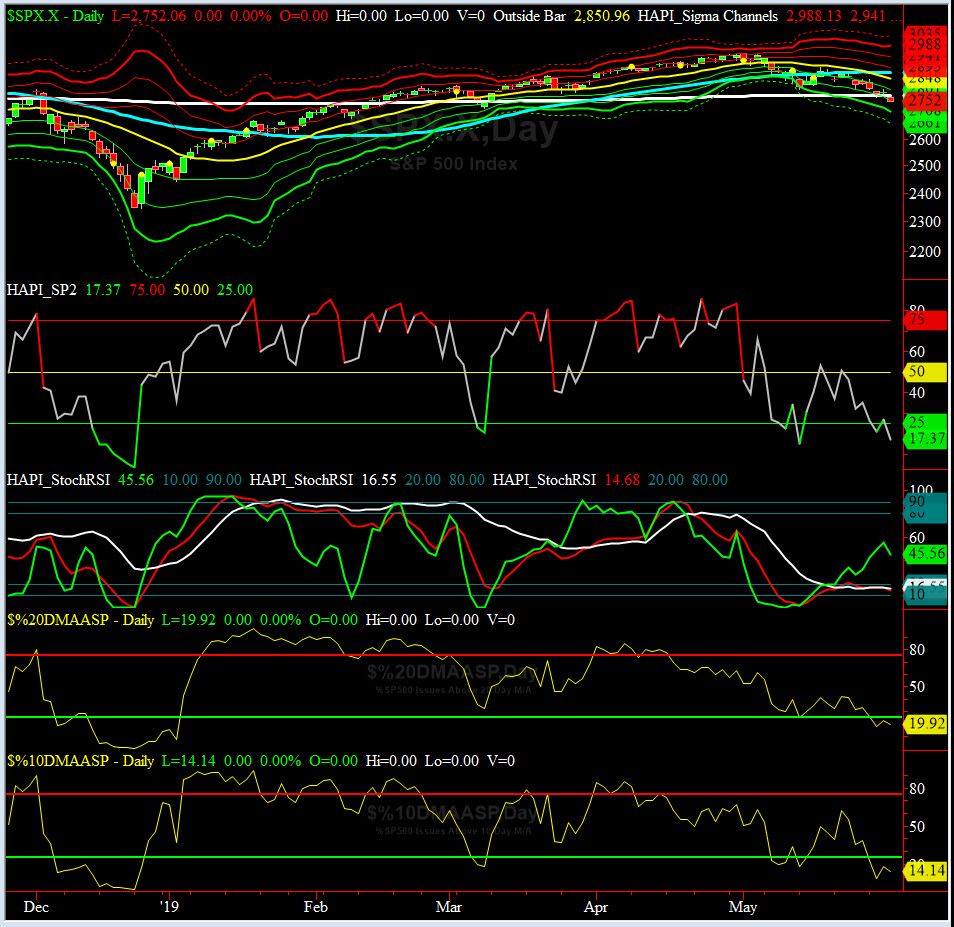
HA_SP2 Chart
HA_SP2 = 35.2 (Buy signal <= 25, Sell Signal >= 75)
Our coveted SP2 prop indicator is slowly approaching another oversold condition? Who knows. @Capt_Tiko thinks so.
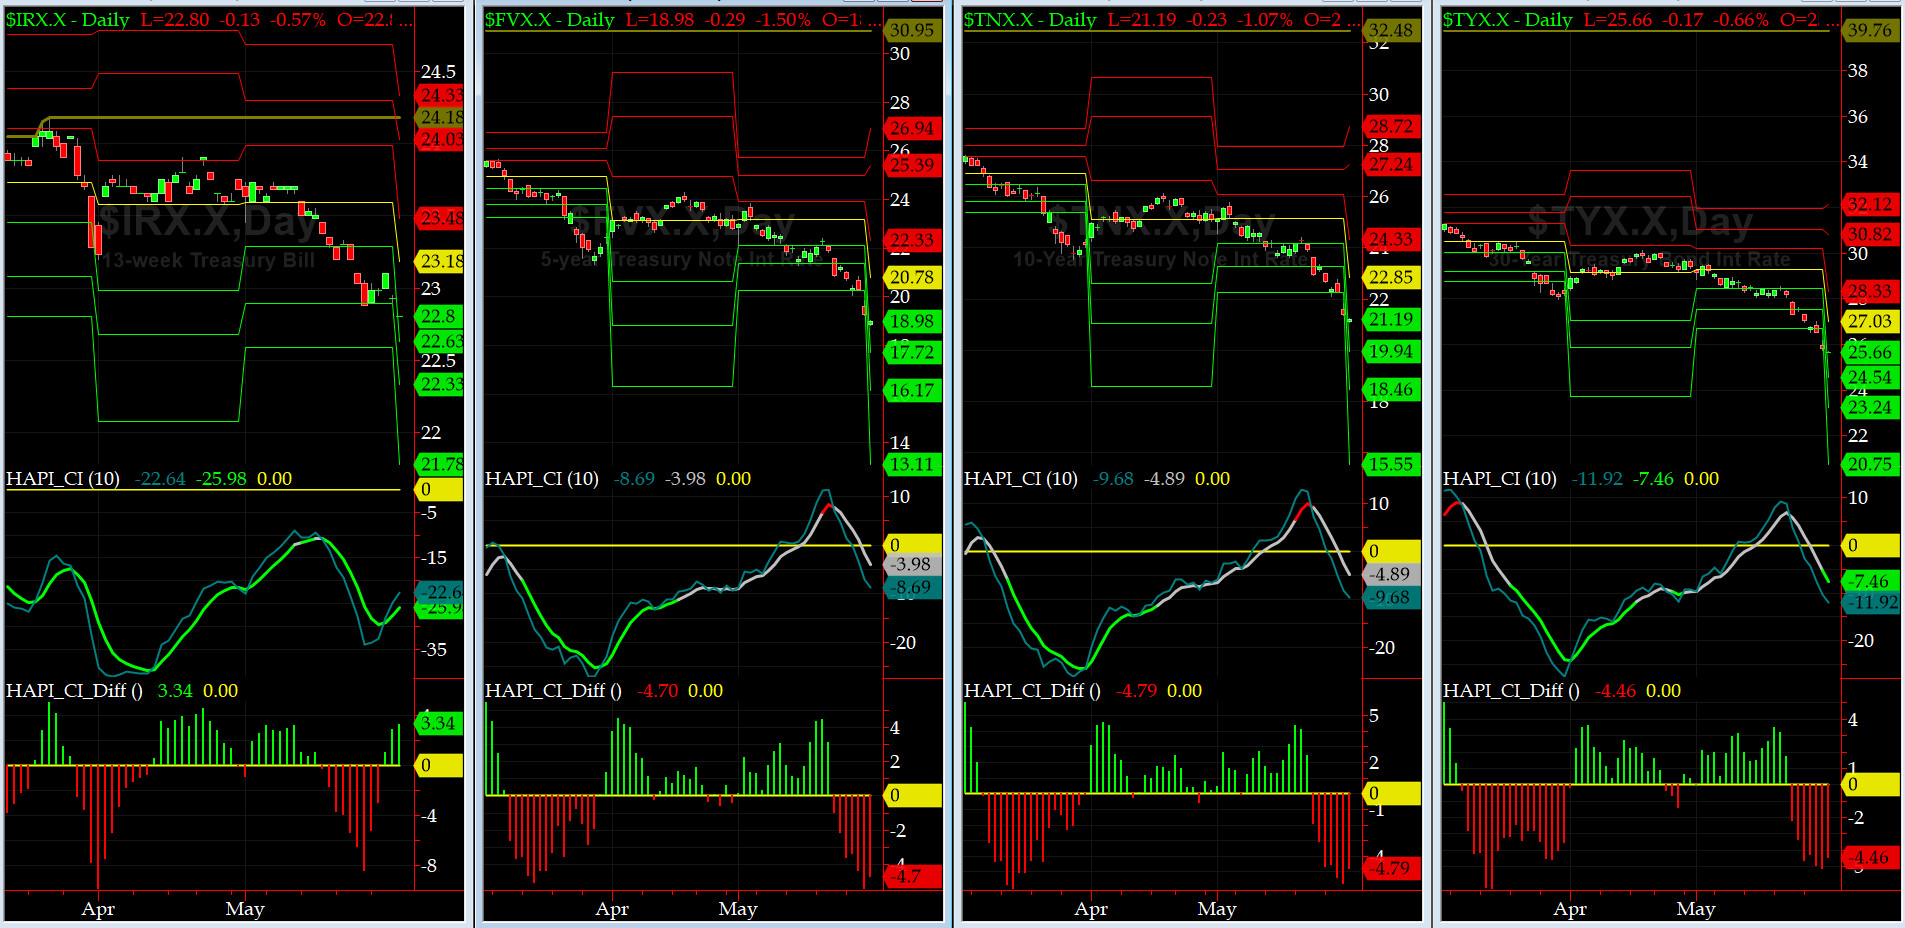
US Treasury T-Notes & T-Bonds Yields Chart
Last week our YTMs got killed. Maury calls this an outrage and a disgrace. Down here in FL, folks tend to agree with that.
Fari Hamzei
|
|
|
|
|
|
Customer Care:
|
|
|
|
|
|
|
 |
 |
|
 |
|
 |
 |
 |
HA YouTube Channel ::: HA Blog ::: Testimonials ::: Tutorials & FAQs ::: Privacy Policy
|
Trading Derivatives (Options & Futures) contains substantial risk and is not for every investor. An investor could potentially lose all or more than his/her initial investment.
Only risk capital should be used for trading and only those with sufficient risk capital should consider trading derivatives. Past performance is not
necessarily indicative of future results. Testimonials appearing on this website may not be representative of other clients or customers
and are not a guarantee of future performance or success.
|
| (c) 1998-2025, Hamzei Analytics, LLC.® All Rights Reserved. |
|
|