|
Sunday, June 9, 2019, 2145ET
Market Timing Charts, Analysis & Commentary for Issue #294
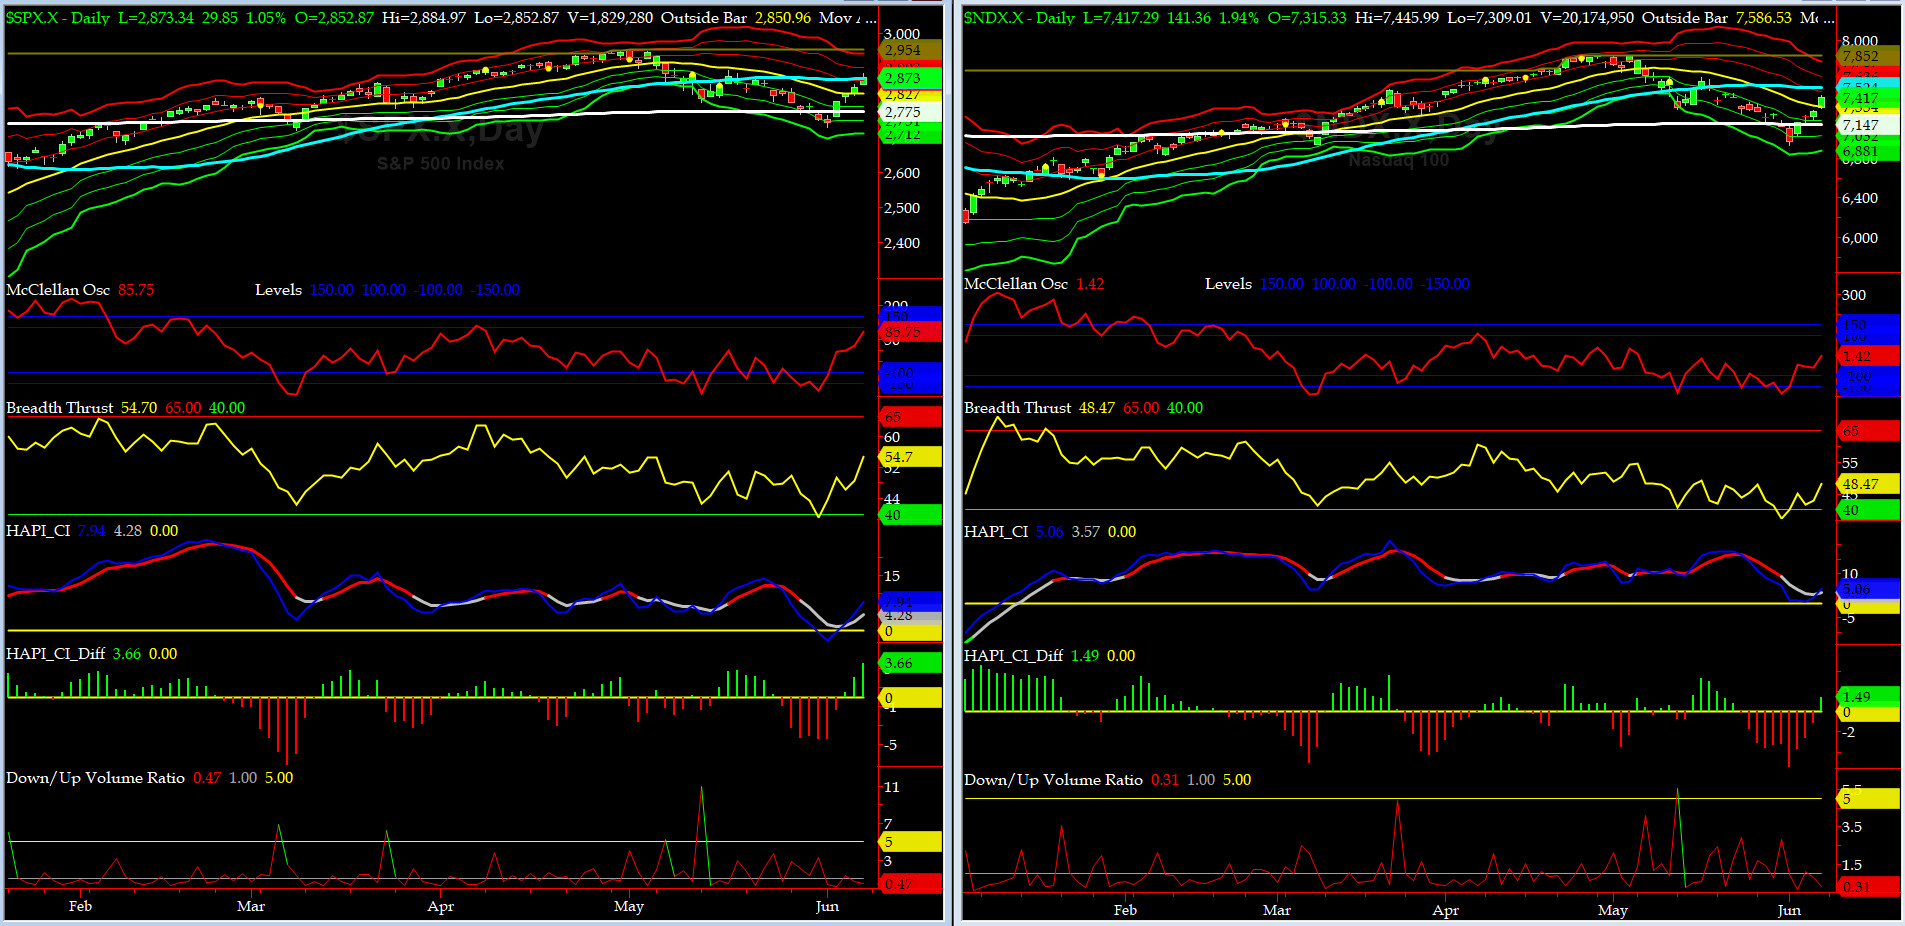
Timer Charts of S&P-500 Cash Index (SPX) + NASDAQ-100 Cash Index (NDX)
Most recent S&P-500 Cash Index (SPX): 2873 up 121 (up +4.4%) for the week ending on Friday, June 7, 2019, which closed near its +1 sigma.
DJIA ALL TIME INTRADAY HIGH = 26951 (reached on Wednesday, October 3, 2018)
DJ TRAN ALL TIME INTRADAY HIGH = 11623 (reached on Friday, September 14, 2018)
SPX ALL TIME INTRADAY HIGH = 2954 (reached on Wednesday, May 1, 2019)
NDX ALL TIME INTRADAY HIGH = 7852 (reached on Wednesday, May 1, 2019)
RUT ALL TIME INTRADAY HIGH = 1742 (reached on Friday, August 31, 2018)
Current DAILY +2 Sigma SPX = 2903 with WEEKLY +2 Sigma = 2978
Current DAILY 0 Sigma SPX = 2827 with WEEKLY 0 Sigma = 2822
Current DAILY -2 Sigma SPX = 2751 with WEEKLY -2 Sigma = 2665
NYSE McClellan Oscillator = +86 (-150 is start of the O/S area; around -275 to -300 area or lower, we go into the �launch-pad� mode; over +150, we are in O/B area)
NYSE Breadth Thrust = 54.7 (40 is considered as oversold and 65 as overbought)
Huge reversal on Tuesday.... Four GREEN sessions back to back. High tides raises all the boats, big and small. Cheers?
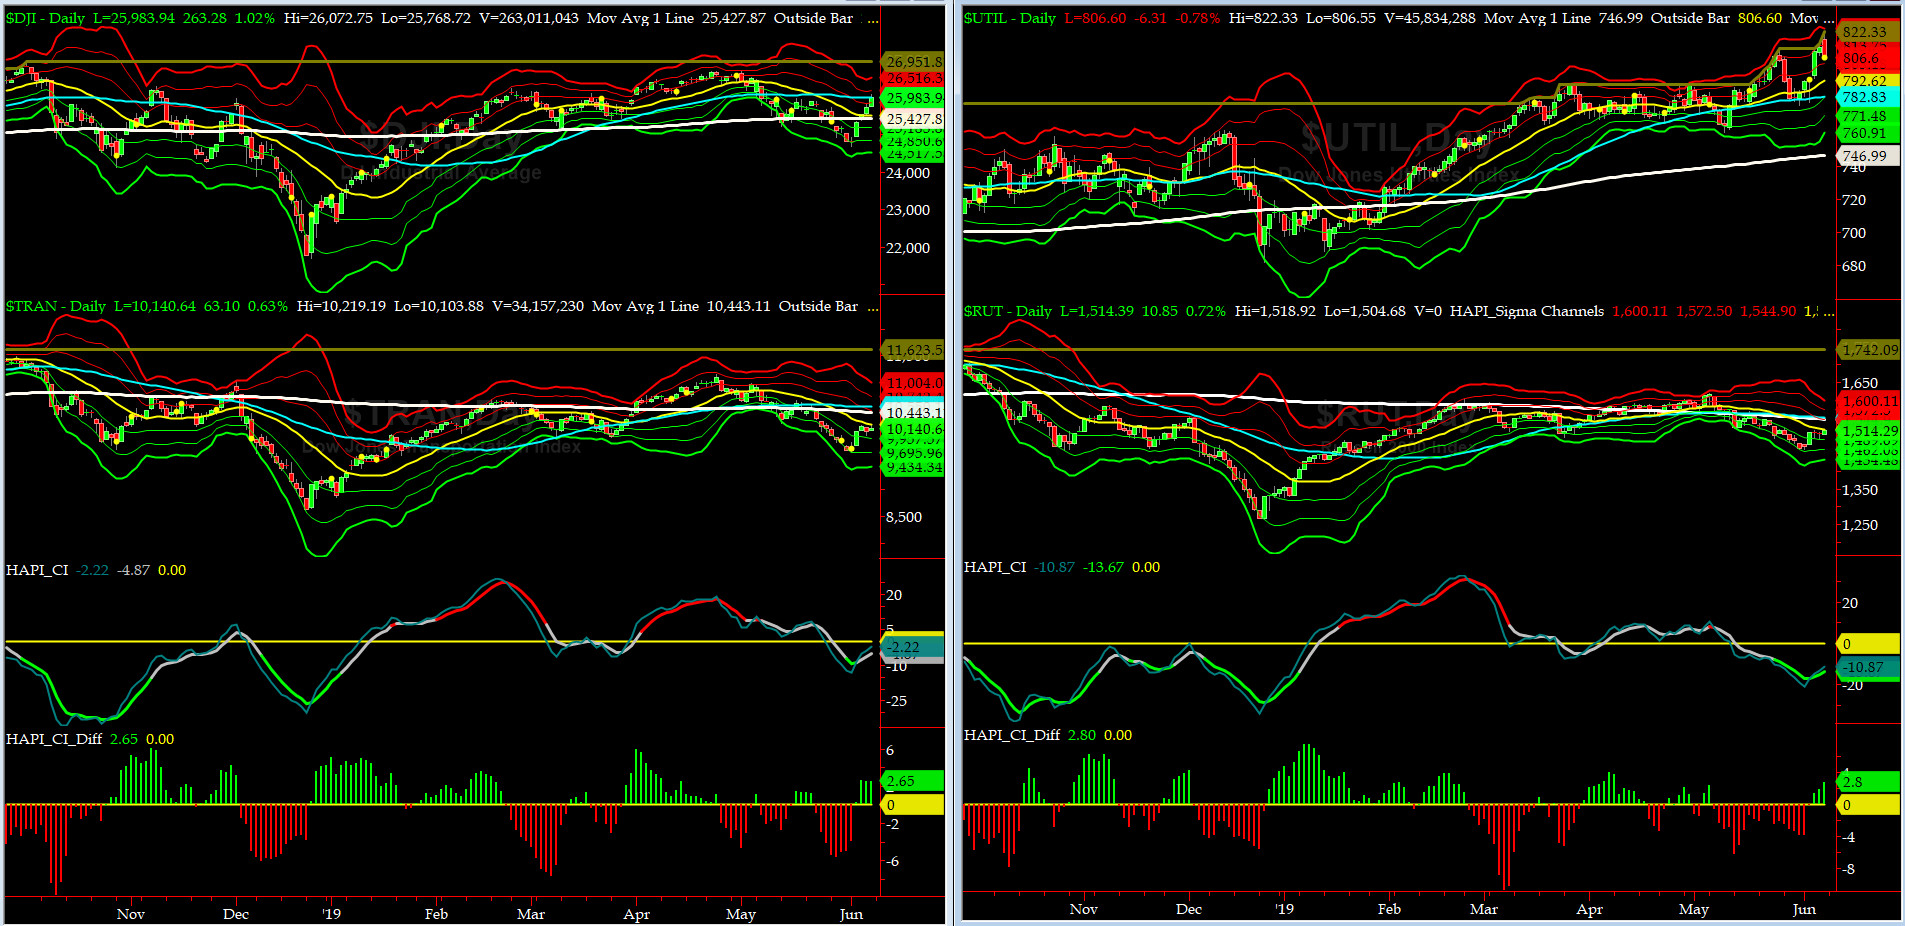
Canaries [in the Coal Mine] Chart for DJ TRAN & RUT Indices
200-Day MA DJ TRAN = 10,443 or 2.9% ABOVE DJ TRAN (max observed in last 7 yrs = 20.2%, min = -20.3%)
200-Day MA RUT = 1546 or 2.1 ABOVE RUT (max observed in last 7 yrs = 21.3%, min = -22.6%)
DJ Transportation Index (proxy for economic conditions 6 to 9 months hence) had a HUGE day on Tuesday then went sideways for the rest of the week.
Russell 2000 Small Caps Index (proxy for Risk ON/OFF) had a good week..... RISK is still OFF.....

DeTrenders Charts for SPX, NDX, TRAN & RUT Indices
50-Day MA SPX = 2870 or 0.1% BELOW SPX (max observed in last 7 yrs = +8.6%, min = -9.3%)
200-Day MA SPX = 2774 or 3.5% BELOW SPX (max observed in last 7 yrs = 15.2%, min = -14%)
FIVE of our EIGHT DeTrenders are in the NEGATIVE territory. The DeTrenders for DJ Tran & RUT will continue to be harbingers of future price behavior in broad indices.
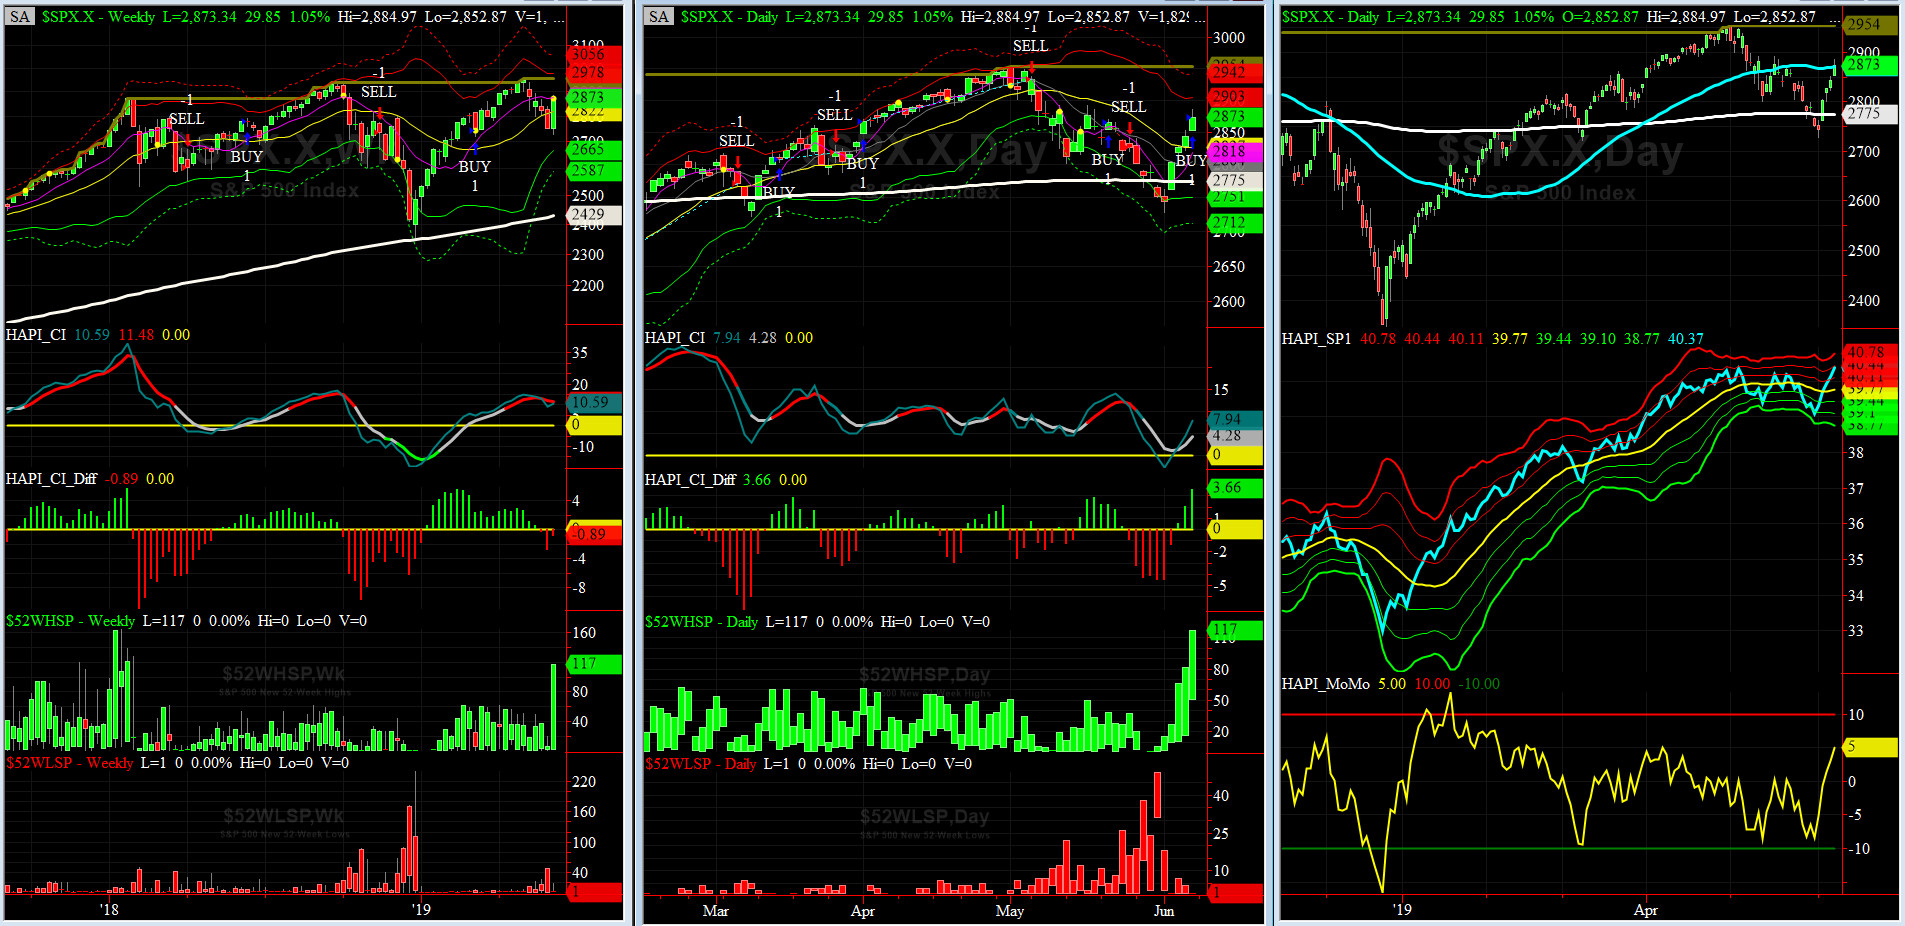
HA_SP1_Momo Chart
WEEKLY Timing Model = on a BUY Signal since Friday, March 8, 2019 CLOSE at 2743
DAILY Timing Model = on a BUY Signal since Friday, June 7, 2019 CLOSE at 2873
Max SPX 52wk-highs reading last week = 117 (over 120-140, the local maxima is in)
Max SPX 52wk-Lows reading last week = 18 (over 40-60, the local minima is in)
HA_SP1 closed near its +2 sigma channels
HA_Momo = +5 (reversals most likely occur above +10 or below -10)
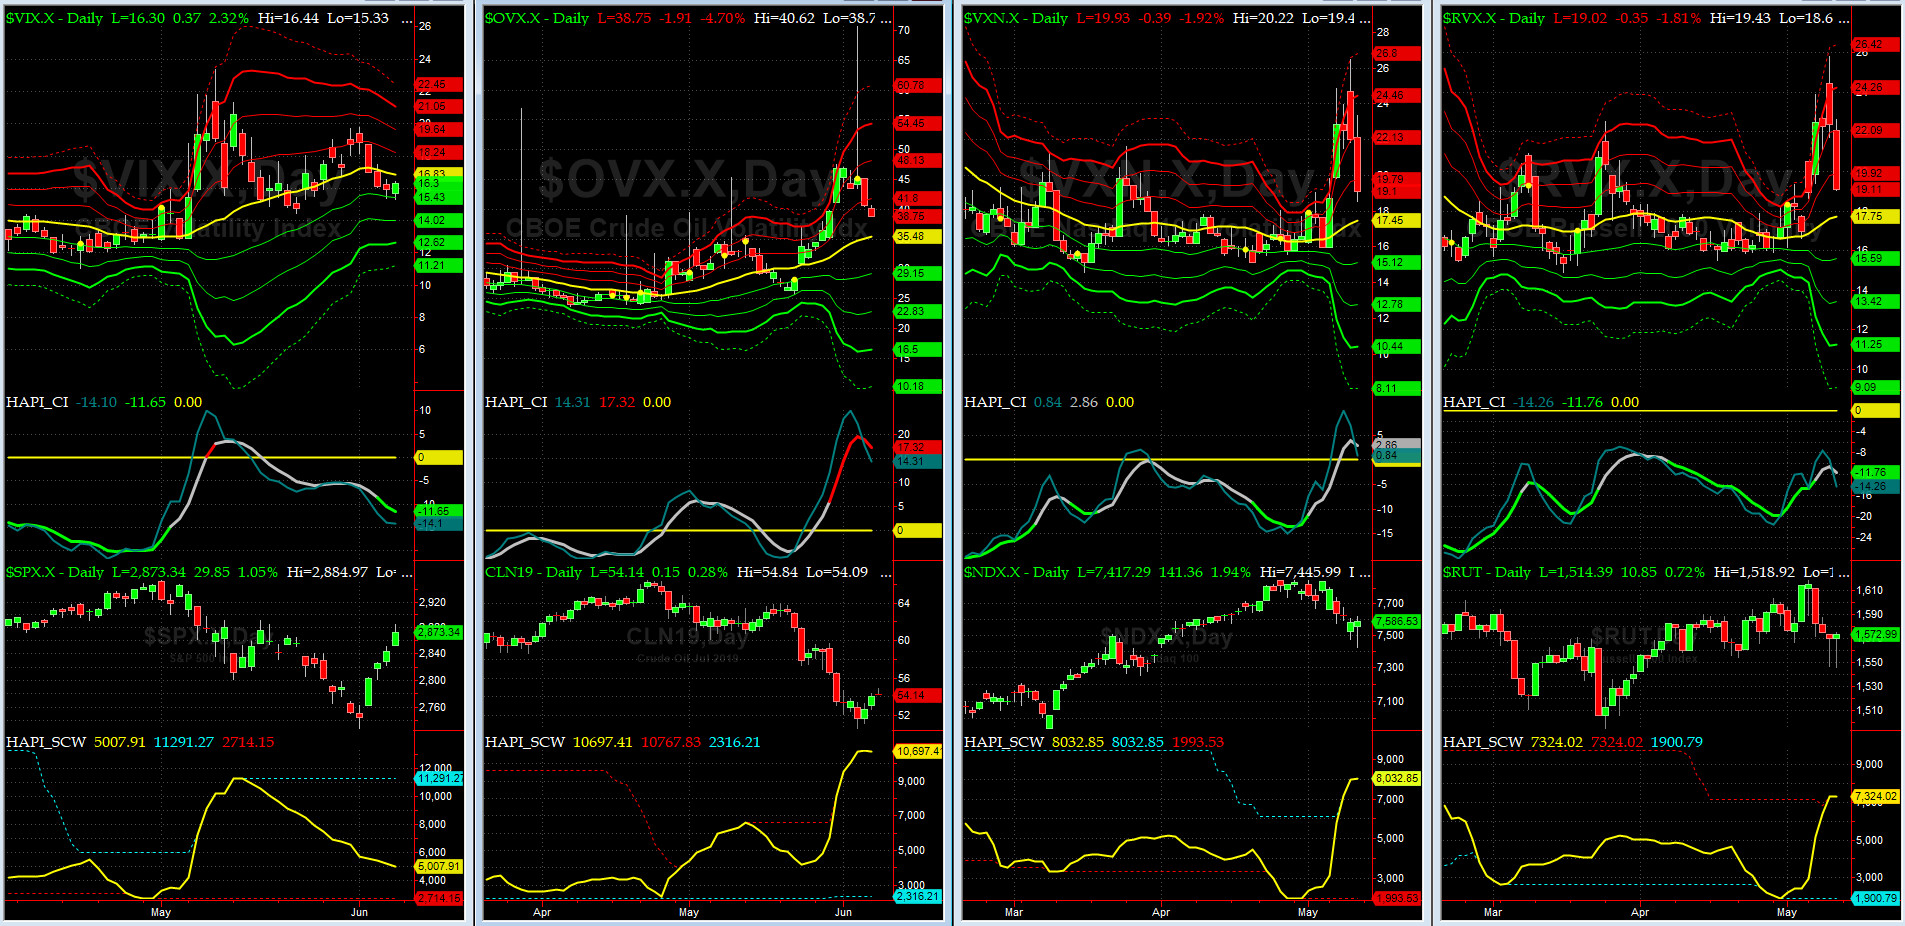
Vol of the Vols Chart
Spot VIX stood at 16.30 Friday night, at about its zero sigma (remember it's the VIX volatility pattern aka "its sigma channels" that matters, and not the level of VIX itself (this is per Dr. Robert Whaley, a great mentor and inventor of original VIX, now called VXO). VIX usually peaks around a test of its +4 sigma).
Vols of the Vols have collapsed. Keep your bet size in check. Long hot Summer days are here. Go to the Beach.
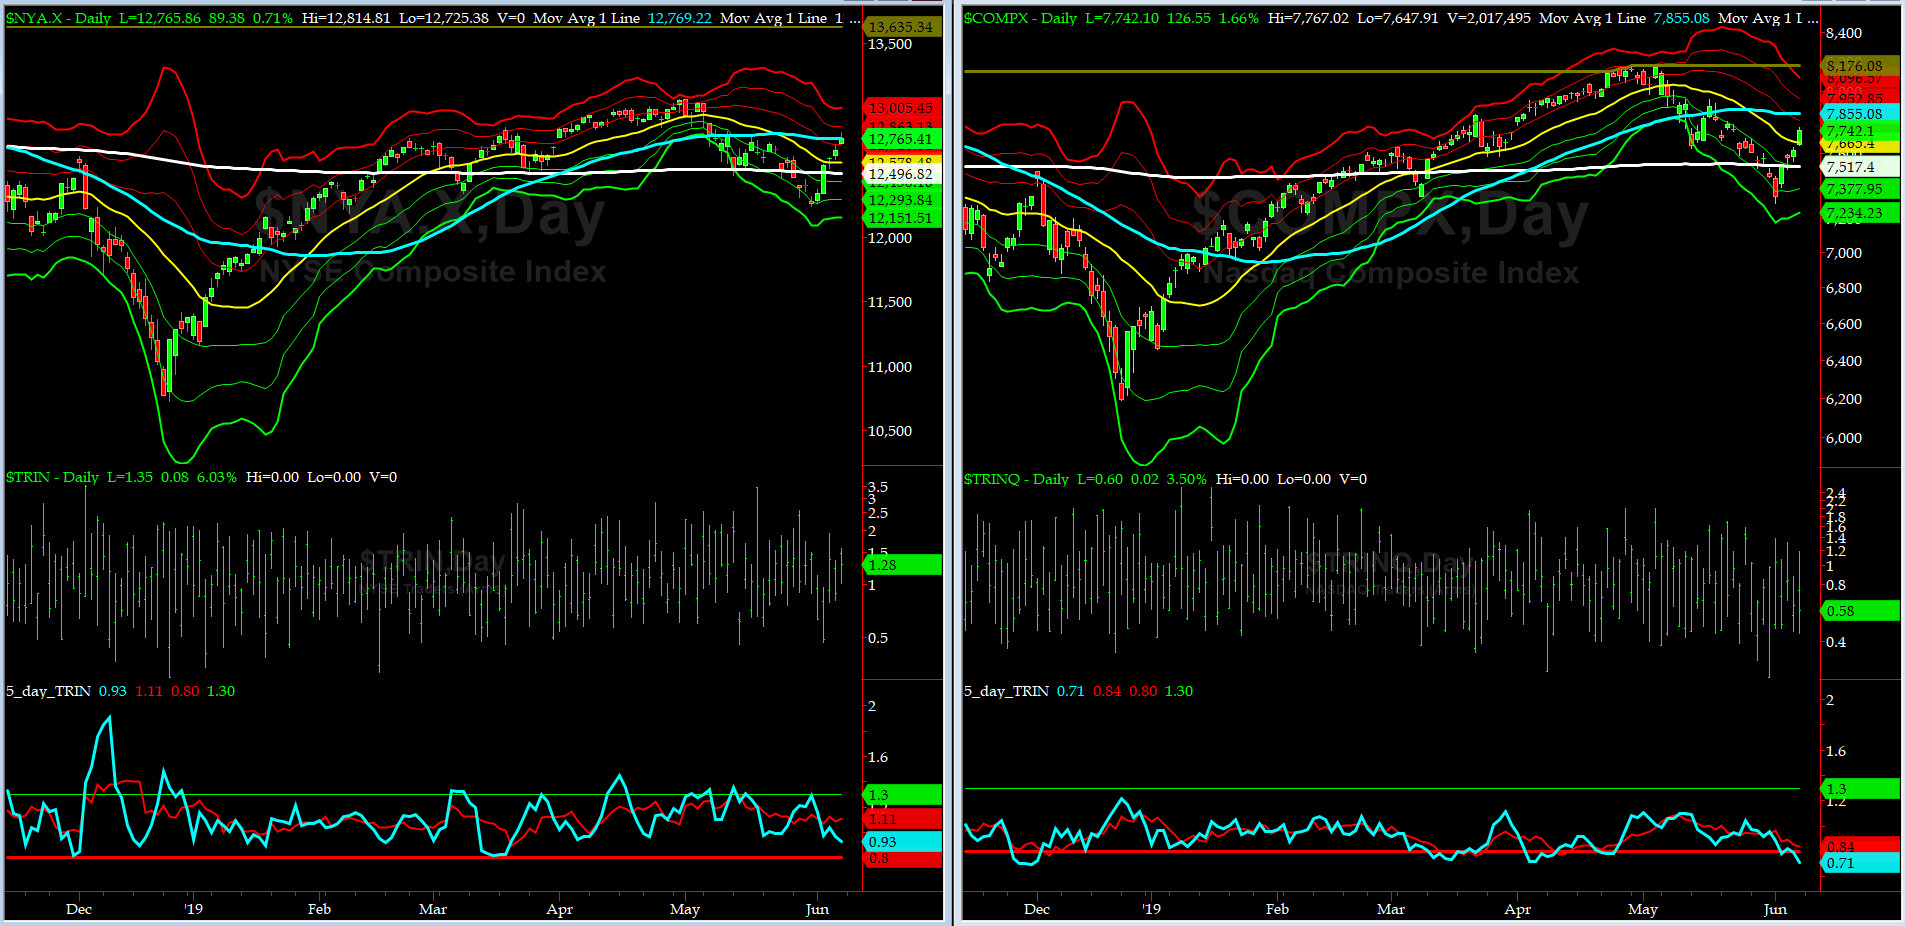
5-day TRIN & TRINQ Charts
NYSE 5-day TRIN is in NEUTRAL zone while NASDAQ 5-day TRINQ is in the SELL zone.
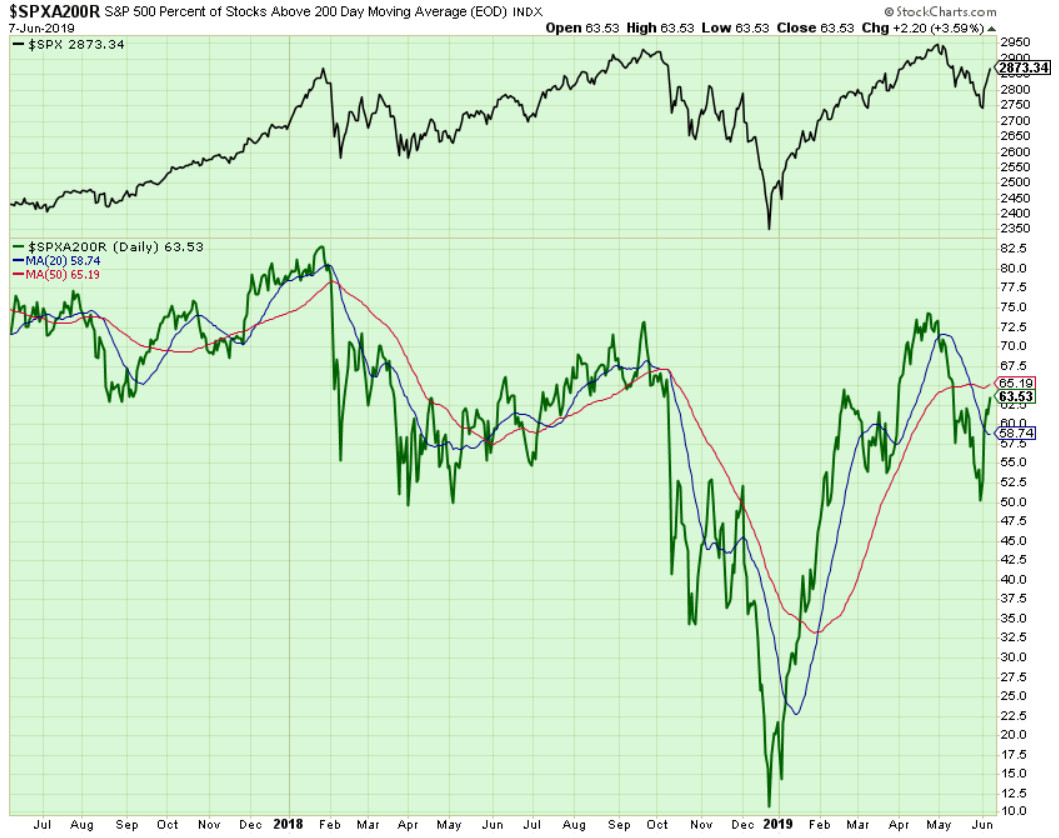
Components of SPX above their respective 200-day MA Chart
This scoring indicator rose to 63.5% by Friday close after plunging to 50% on Monday. If we do not close above the 67% to 70% zone soon, then this indicators should head back down. As discussed in the webinars, watch for separations between this time series & its 20- & 50-day MAs.
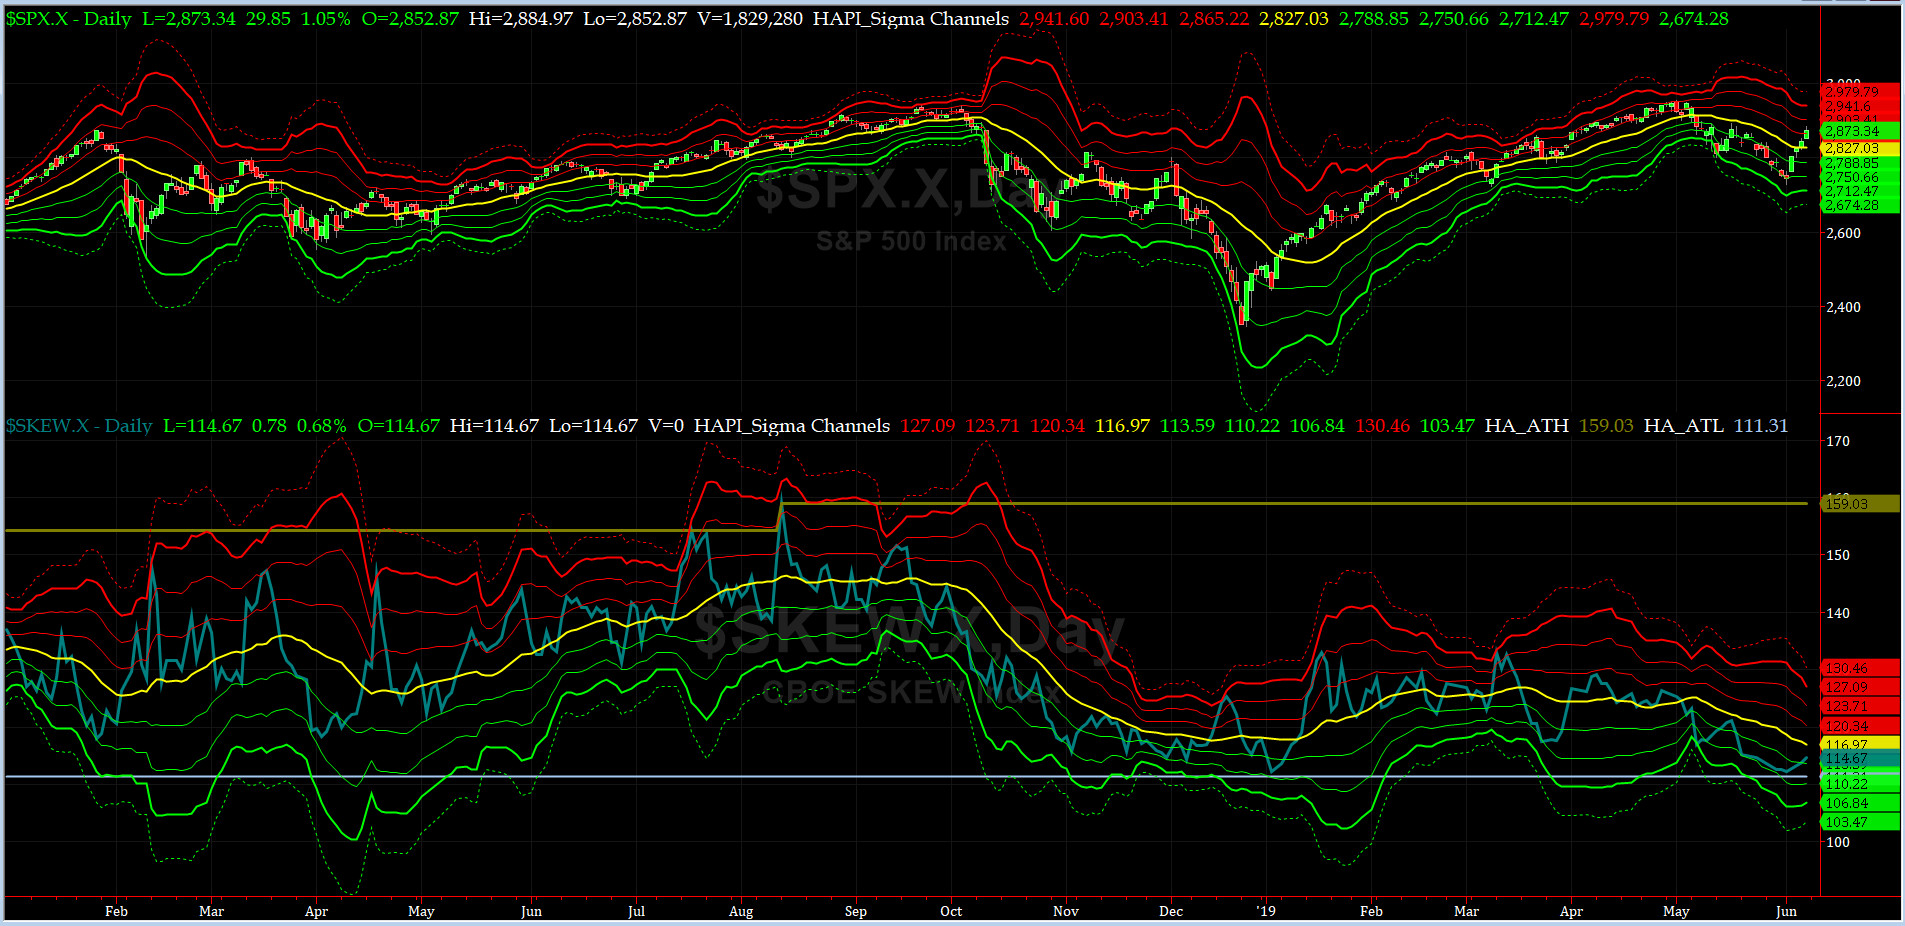
SPX SKEW (Tail Risk) Chart
On Friday, SPX SKEW (Tail Risk) closed near 114.7, now about its -1 sigma (normal = 115, range 100-150).
All quiet on the Eastern & Mid-Western Fronts? YES, this is according to our beloved HRH Capt Tiko, KCPE....
How to interpret the value of SPX SKEW? (from CBOE white paper on SKEW)


3-month VIX Futures Spread(VX) Chart
This popular timing indicator, (now long JUN19, & short SEP19 VIX Futures) hit -0.73 on Friday Close. No signal here.
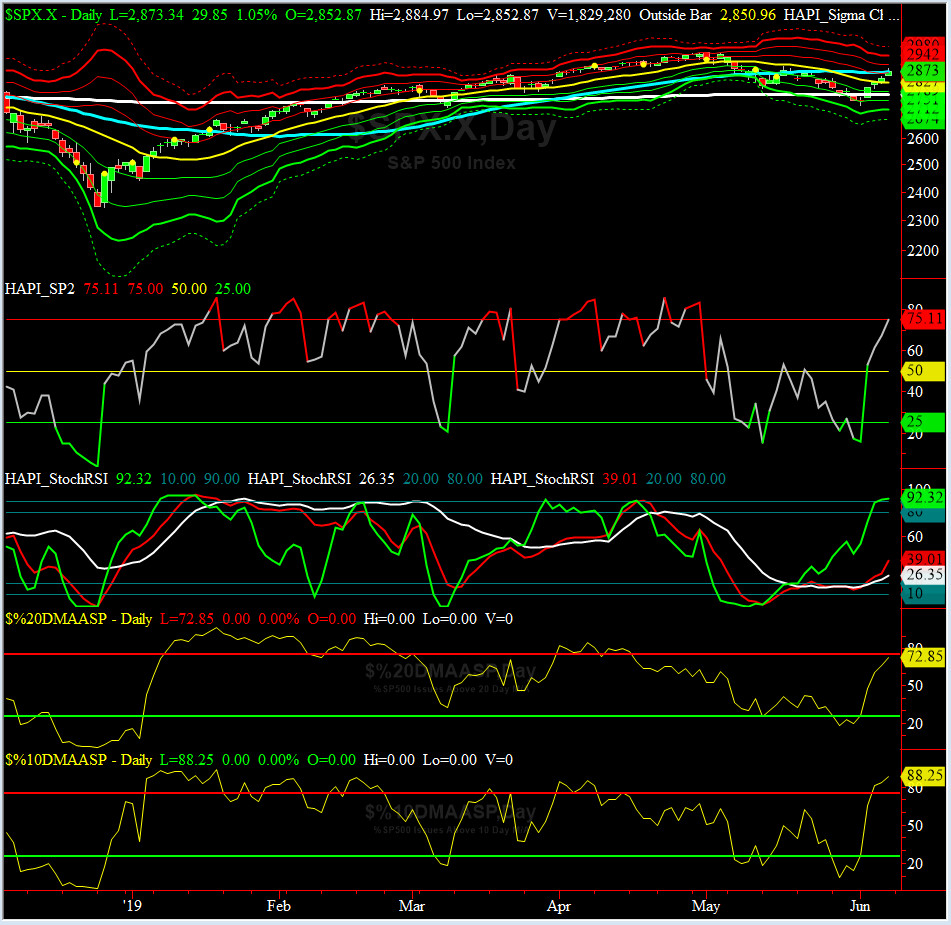
HA_SP2 Chart
HA_SP2 = 75.1 (Buy signal <= 25, Sell Signal >= 75)
Our coveted SP2 prop indicator is fast approaching another overbought condition.

US Treasury T-Notes & T-Bonds Yields Chart
Last week the front end of yield curve sank much faster than the long end. Maury is still very upset.
Fari Hamzei
|


 Proactive Market Timing


