|
Monday, July 1, 2019, 0810ET
Market Timing Charts, Analysis & Commentary for Issue #297
Timer Charts of S&P-500 Cash Index (SPX) + NASDAQ-100 Cash Index (NDX)
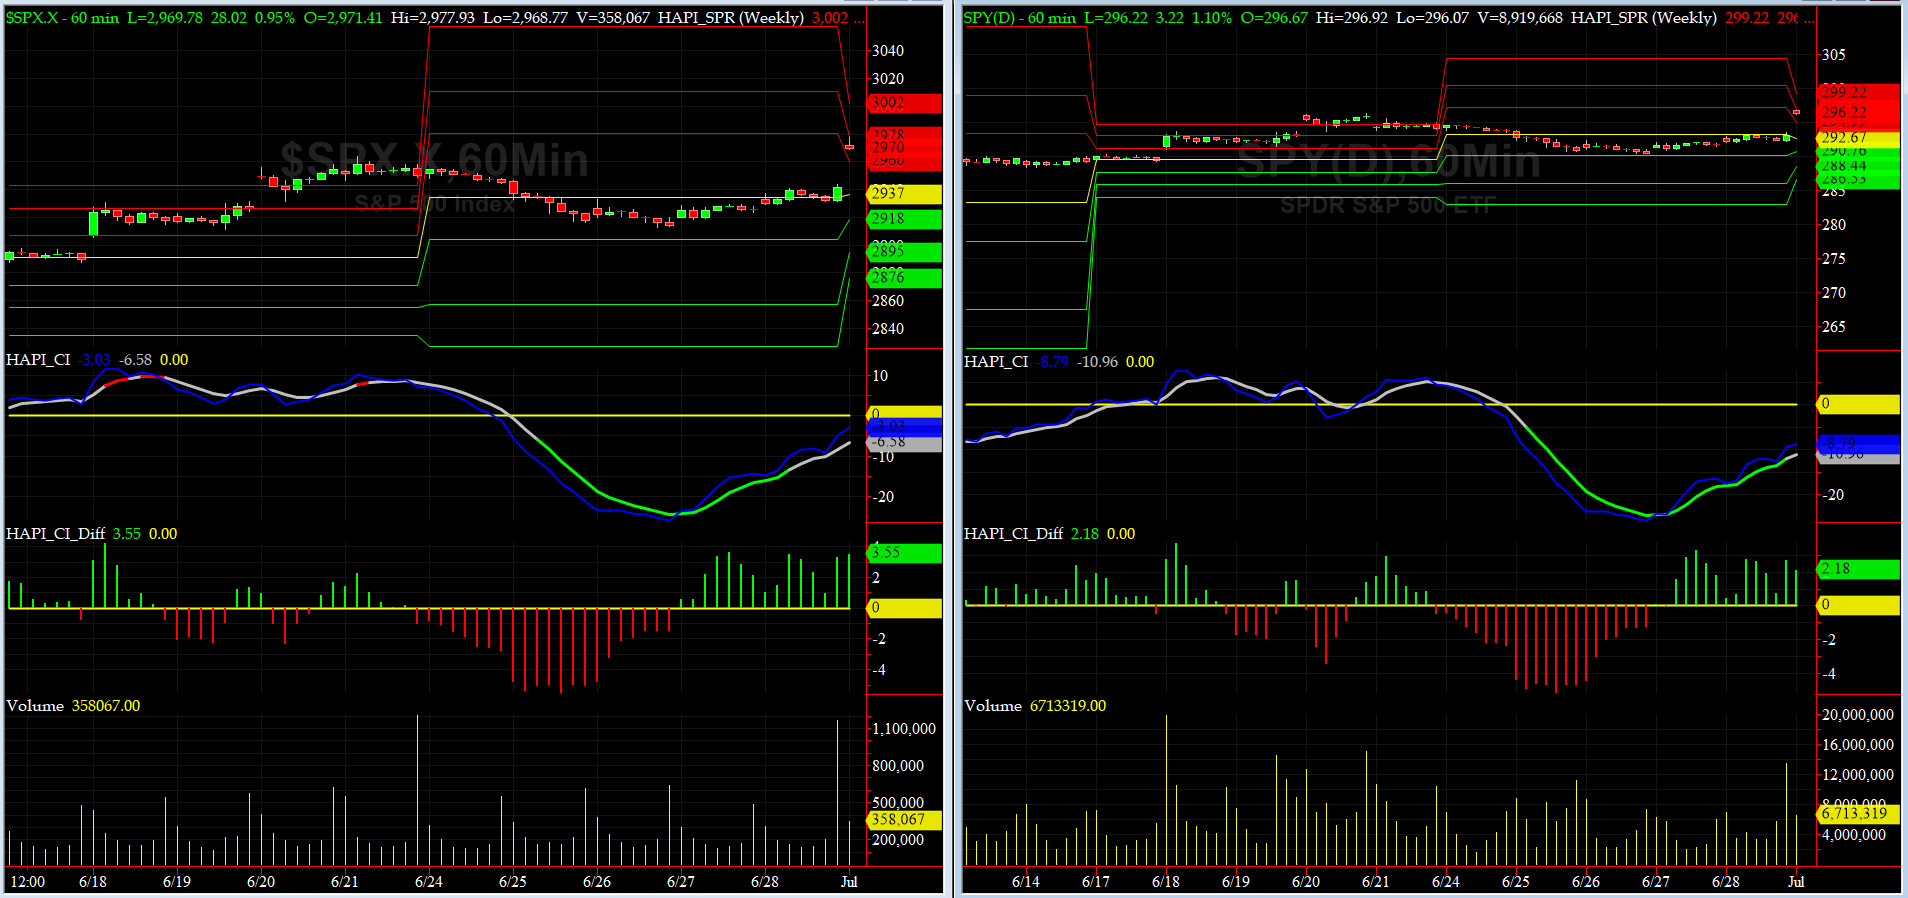
Most recent S&P-500 Cash Index (SPX): 2941 down -8 (down -0.3%) for the week ending on Friday, June 28, 2019, which closed near its +1 sigma.
DJIA ALL TIME INTRADAY HIGH = 26951 (reached on Wednesday, October 3, 2018)
DJ TRAN ALL TIME INTRADAY HIGH = 11623 (reached on Friday, September 14, 2018)
SPX ALL TIME INTRADAY HIGH = 2964 (reached on Friday, June 21, 2019)
NDX ALL TIME INTRADAY HIGH = 7852 (reached on Wednesday, May 1, 2019)
RUT ALL TIME INTRADAY HIGH = 1742 (reached on Friday, August 31, 2018)
Current DAILY +2 Sigma SPX = 2994 with WEEKLY +2 Sigma = 2985
Current DAILY 0 Sigma SPX = 2890 with WEEKLY 0 Sigma = 2857
Current DAILY -2 Sigma SPX = 2787 with WEEKLY -2 Sigma = 2729
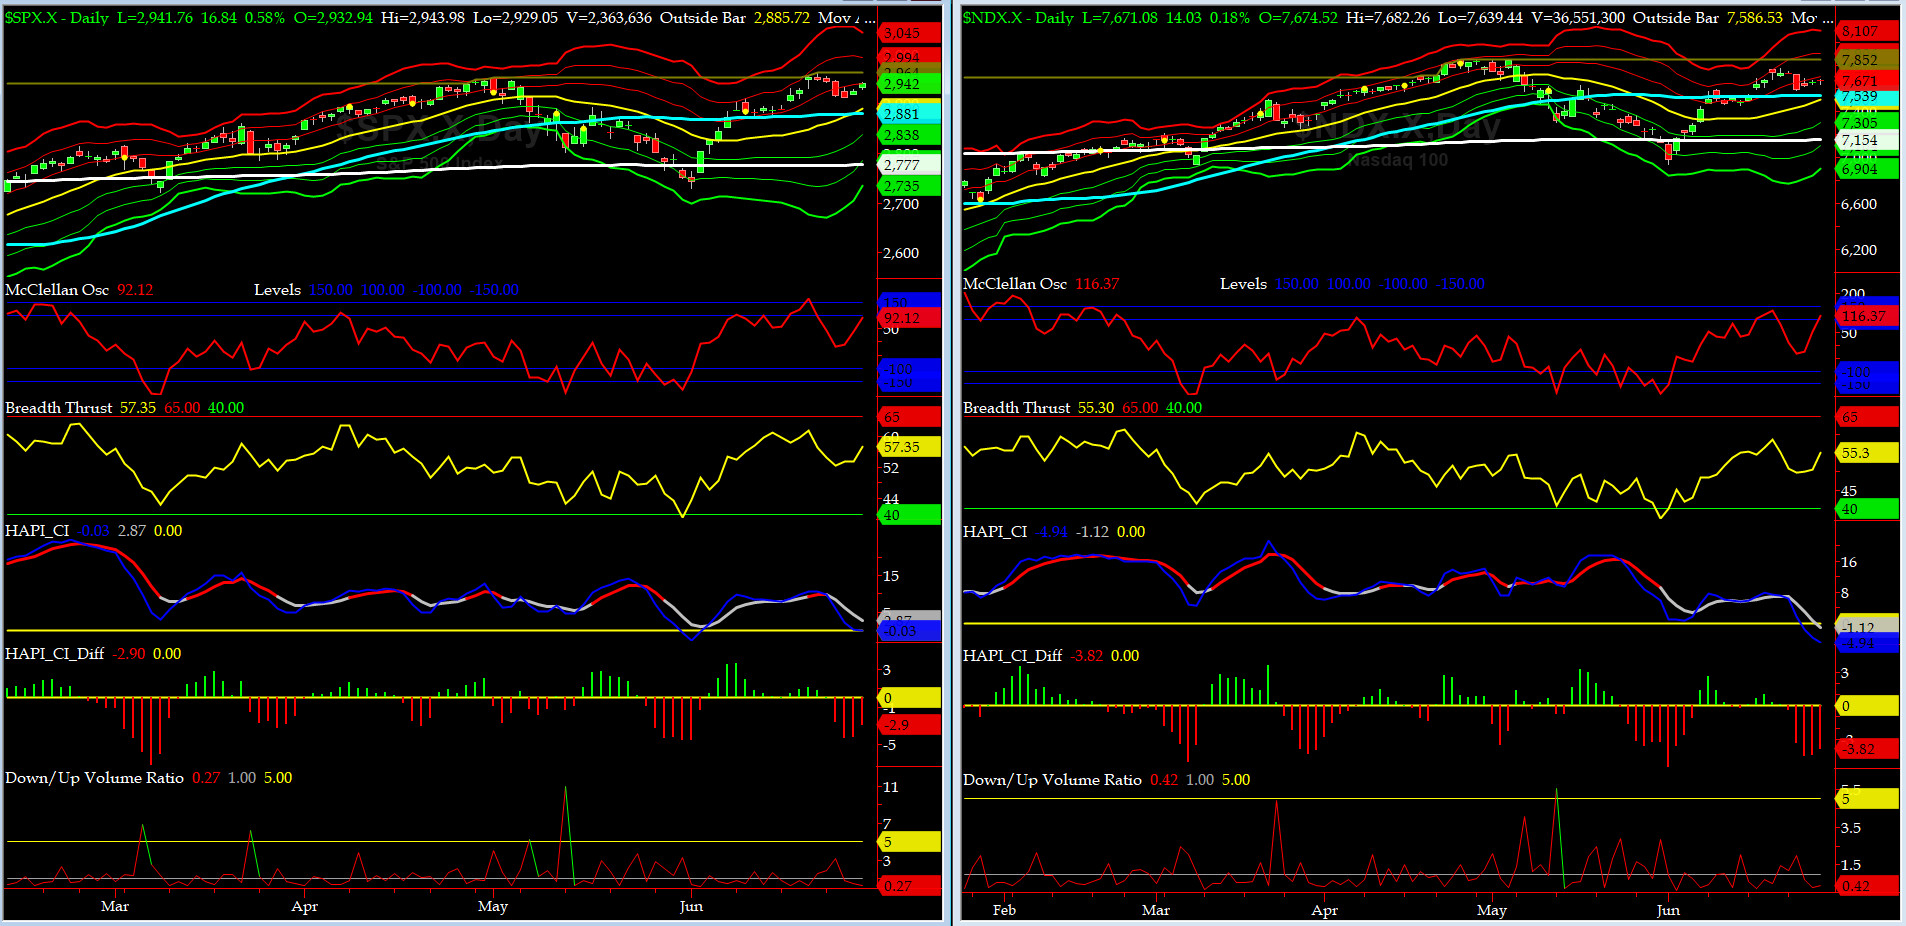
NYSE McClellan Oscillator = +92 (-150 is start of the O/S area; around -275 to -300 area or lower, we go into the �launch-pad� mode; over +150, we are in O/B area)
NYSE Breadth Thrust = 57.4 (40 is considered as oversold and 65 as overbought)
This past week, we went nowhere fast... yes, Summer is here......
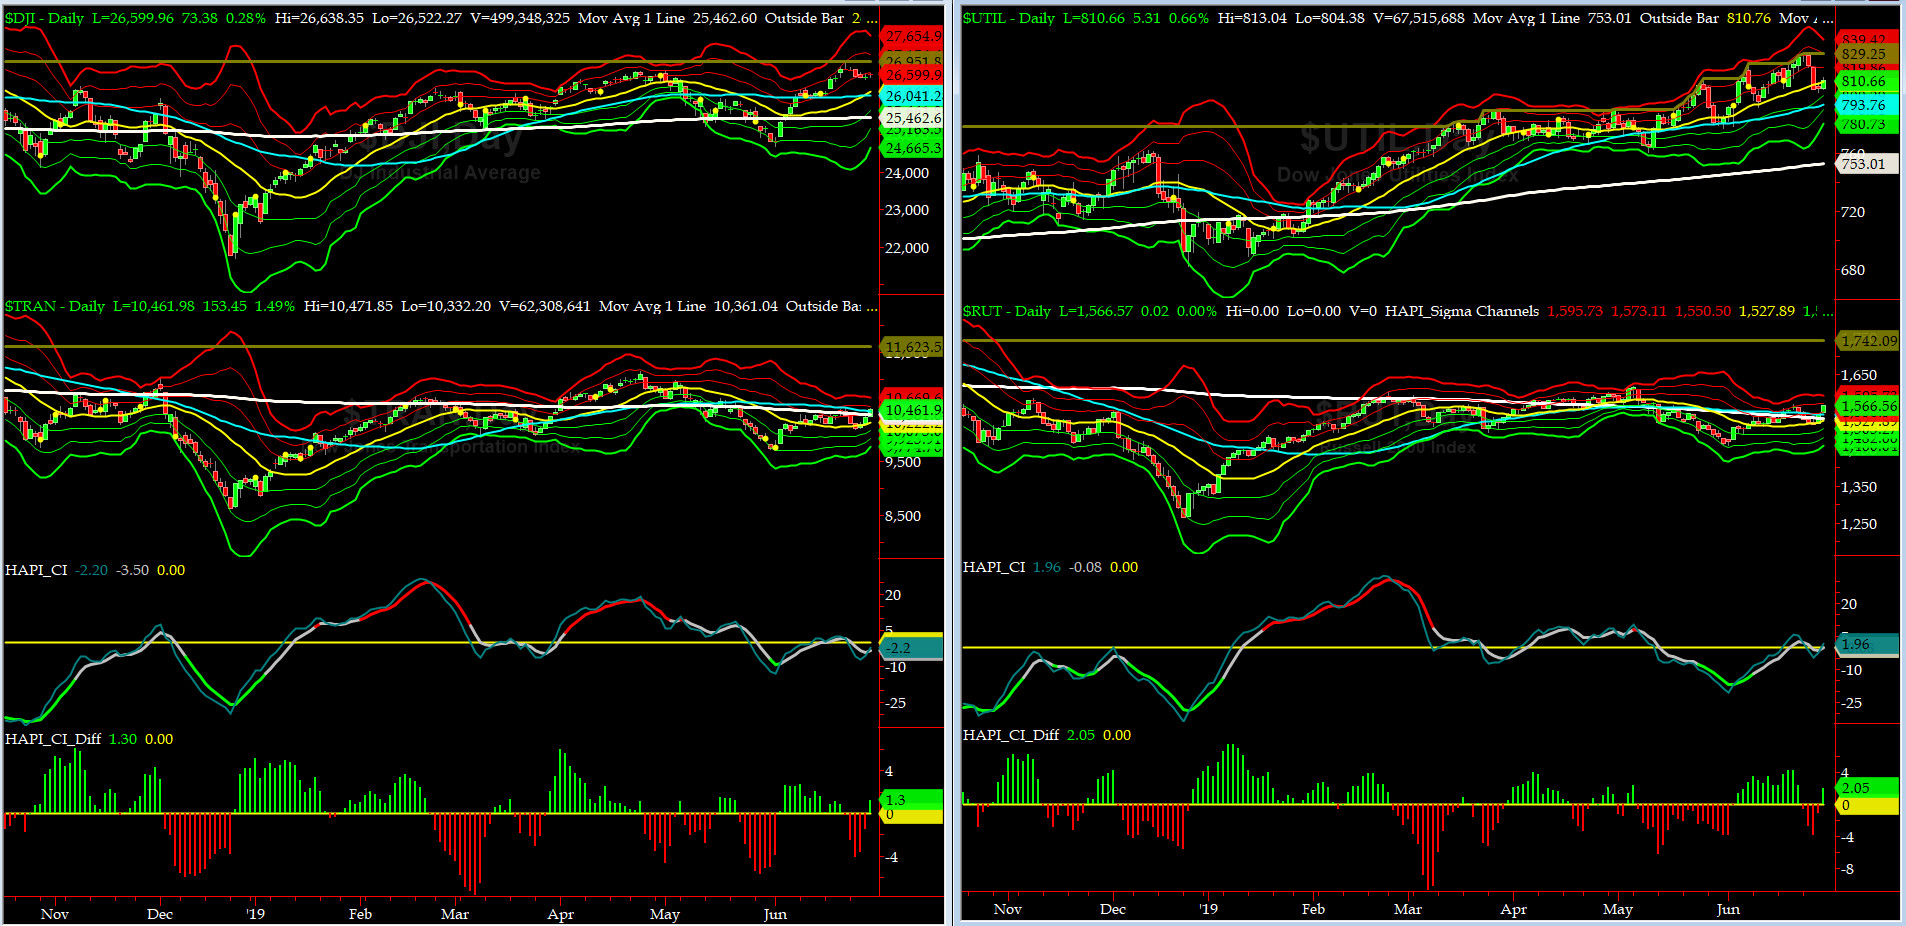
Canaries [in the Coal Mine] Chart for DJ TRAN & RUT Indices
200-Day MA DJ TRAN = 10,361 or 1% BELOW DJ TRAN (max observed in last 7 yrs = 20.2%, min = -20.3%)
200-Day MA RUT = 1532 or 2.2% BELOW RUT (max observed in last 7 yrs = 21.3%, min = -22.6%)
DJ Transportation Index (proxy for economic conditions 6 to 9 months hence) had two great days on Thursday and Friday and may have averted another death cross (50-day MA dipping below 200-day MA).
Russell 2000 Small Caps Index (proxy for Risk ON/OFF) ditto here, but, RISK, is still OFF.....
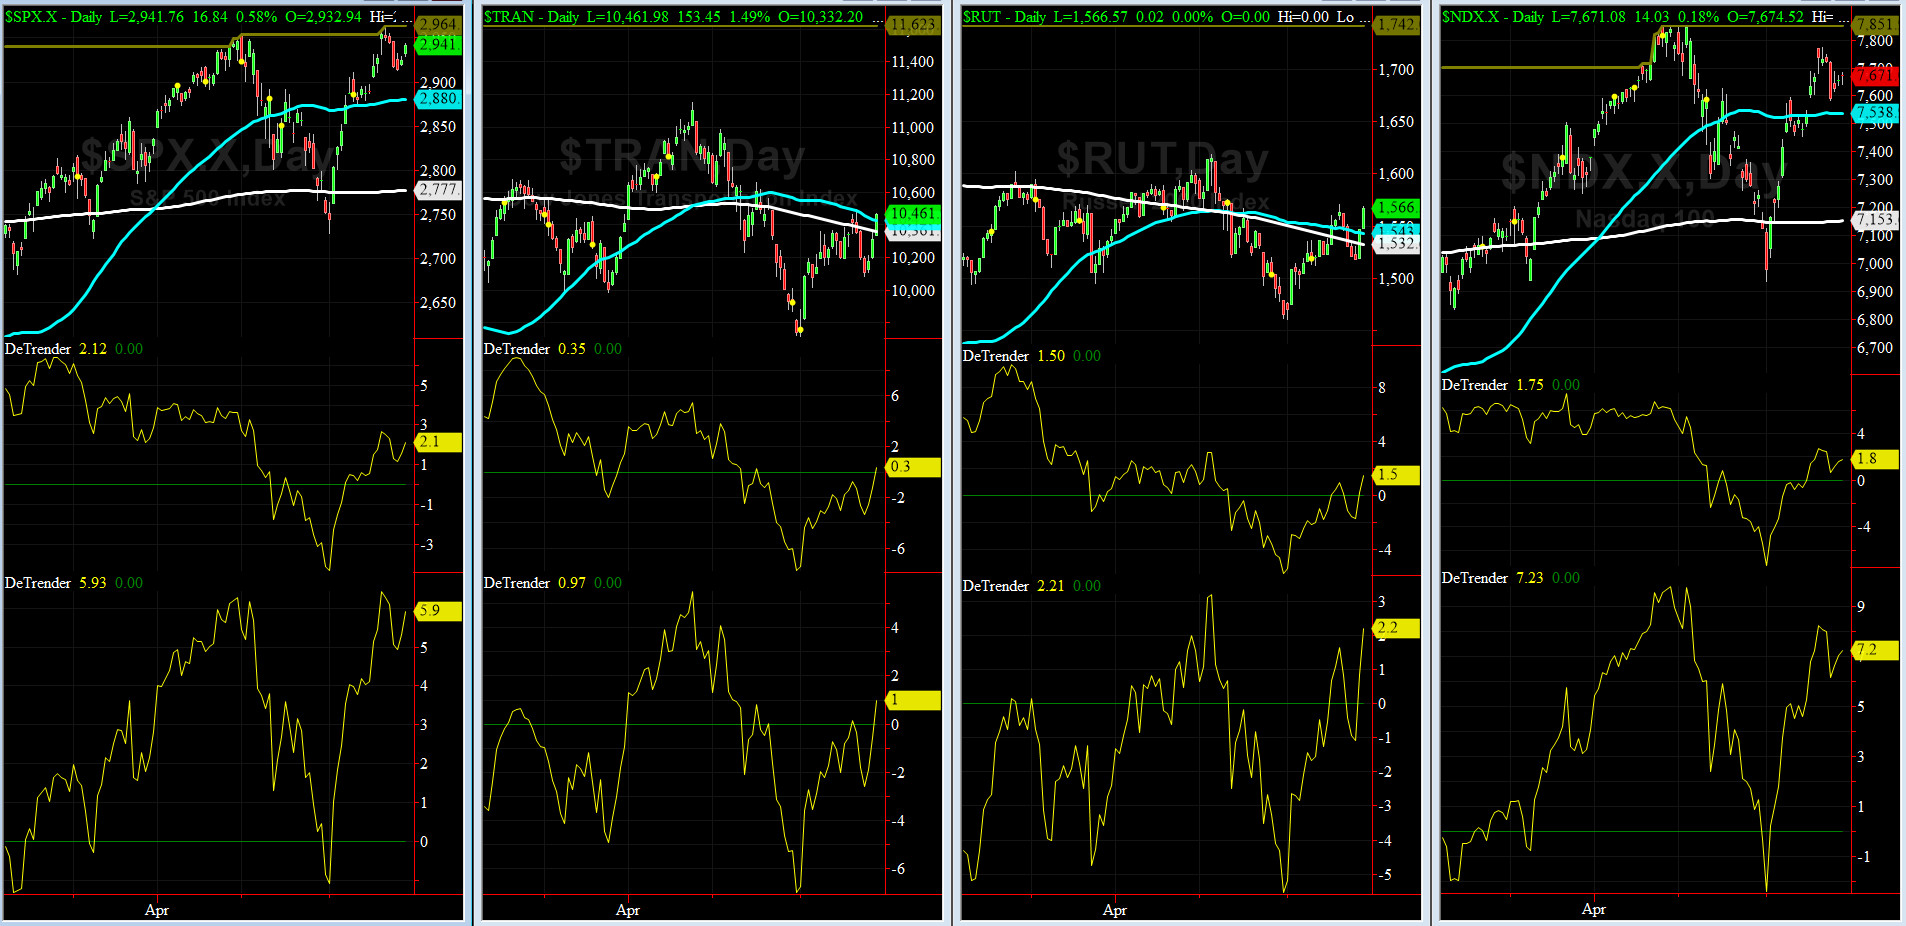
DeTrenders Charts for SPX, NDX, TRAN & RUT Indices
50-Day MA SPX = 2880 or 2.1% BELOW SPX (max observed in last 7 yrs = +8.6%, min = -9.3%)
200-Day MA SPX = 2777 or 5.9% BELOW SPX (max observed in last 7 yrs = 15.2%, min = -14%)
ALL of our EIGHT DeTrenders are in the POSITIVE territory. The DeTrenders for DJ Tran & RUT will continue to be harbingers of future price behavior in broad indices.
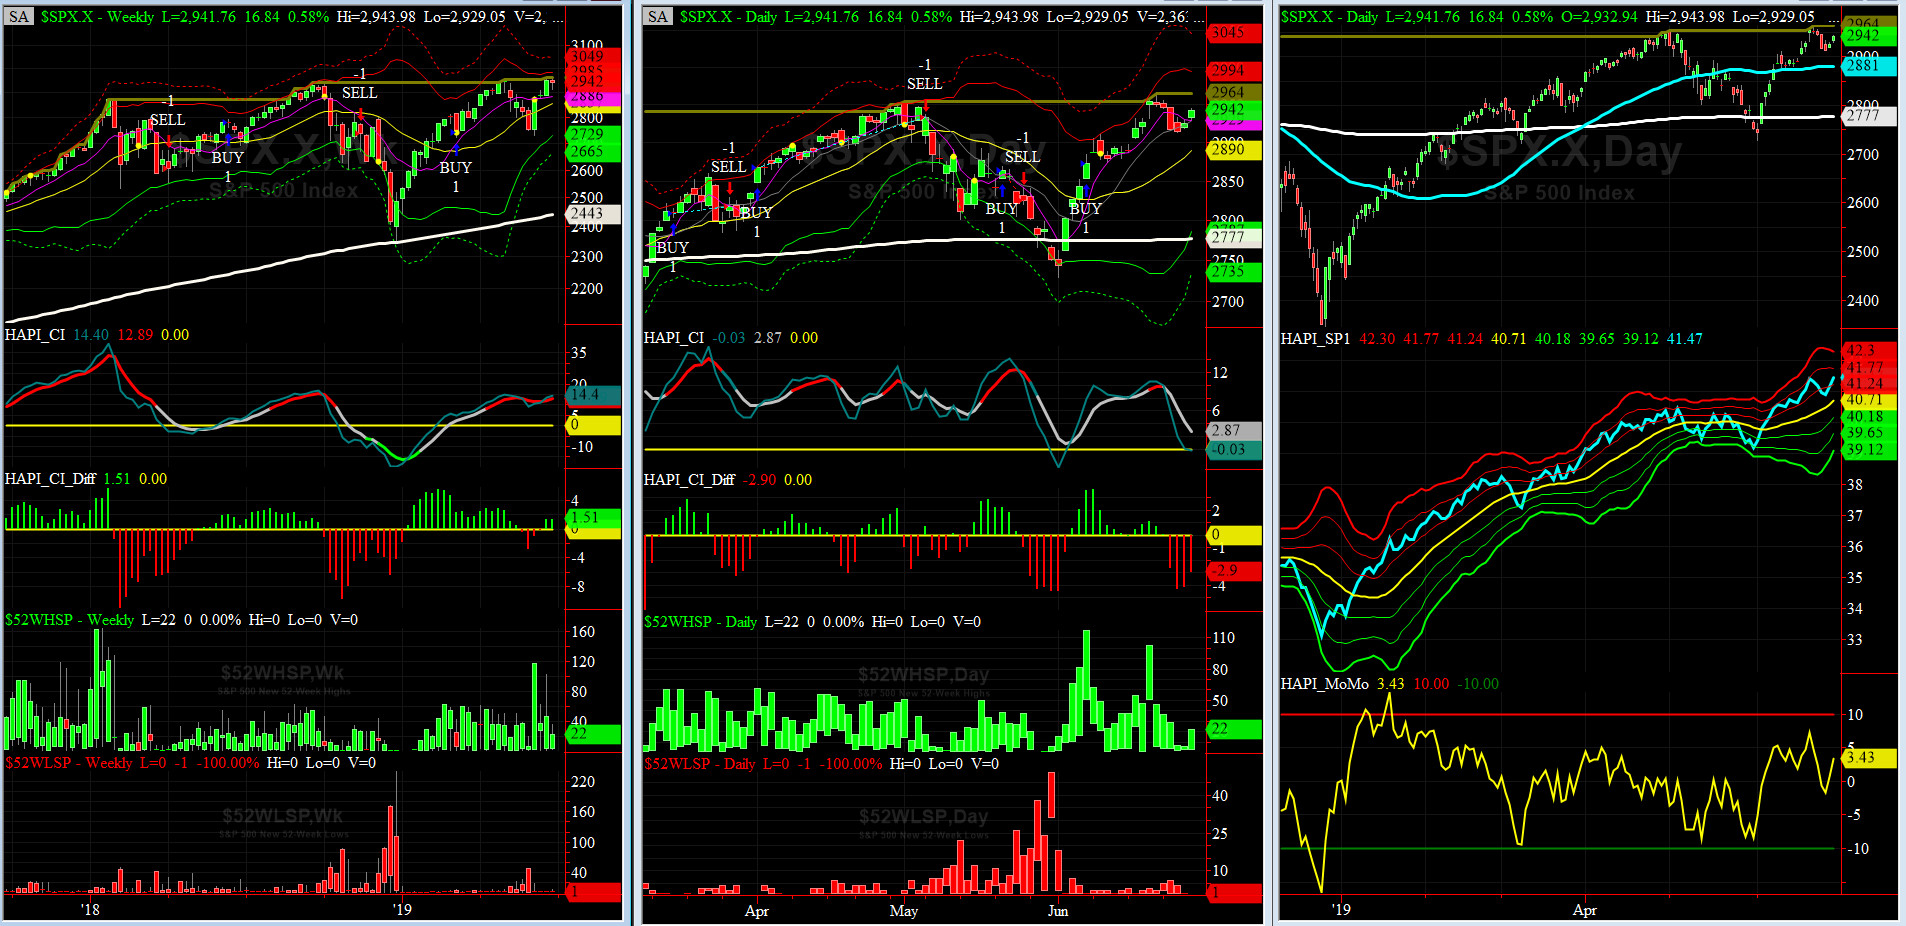
HA_SP1_Momo Chart
WEEKLY Timing Model = on a BUY Signal since Friday, March 8, 2019 CLOSE at 2743
DAILY Timing Model = on a BUY Signal since Friday, June 7, 2019 CLOSE at 2873
Max SPX 52wk-highs reading last week = 36 (over 120-140, the local maxima is in)
Max SPX 52wk-Lows reading last week = 6 (over 40-60, the local minima is in)
HA_SP1 closed near its +1.5 sigma channels
HA_Momo = +3.4 (reversals most likely occur above +10 or below -10)
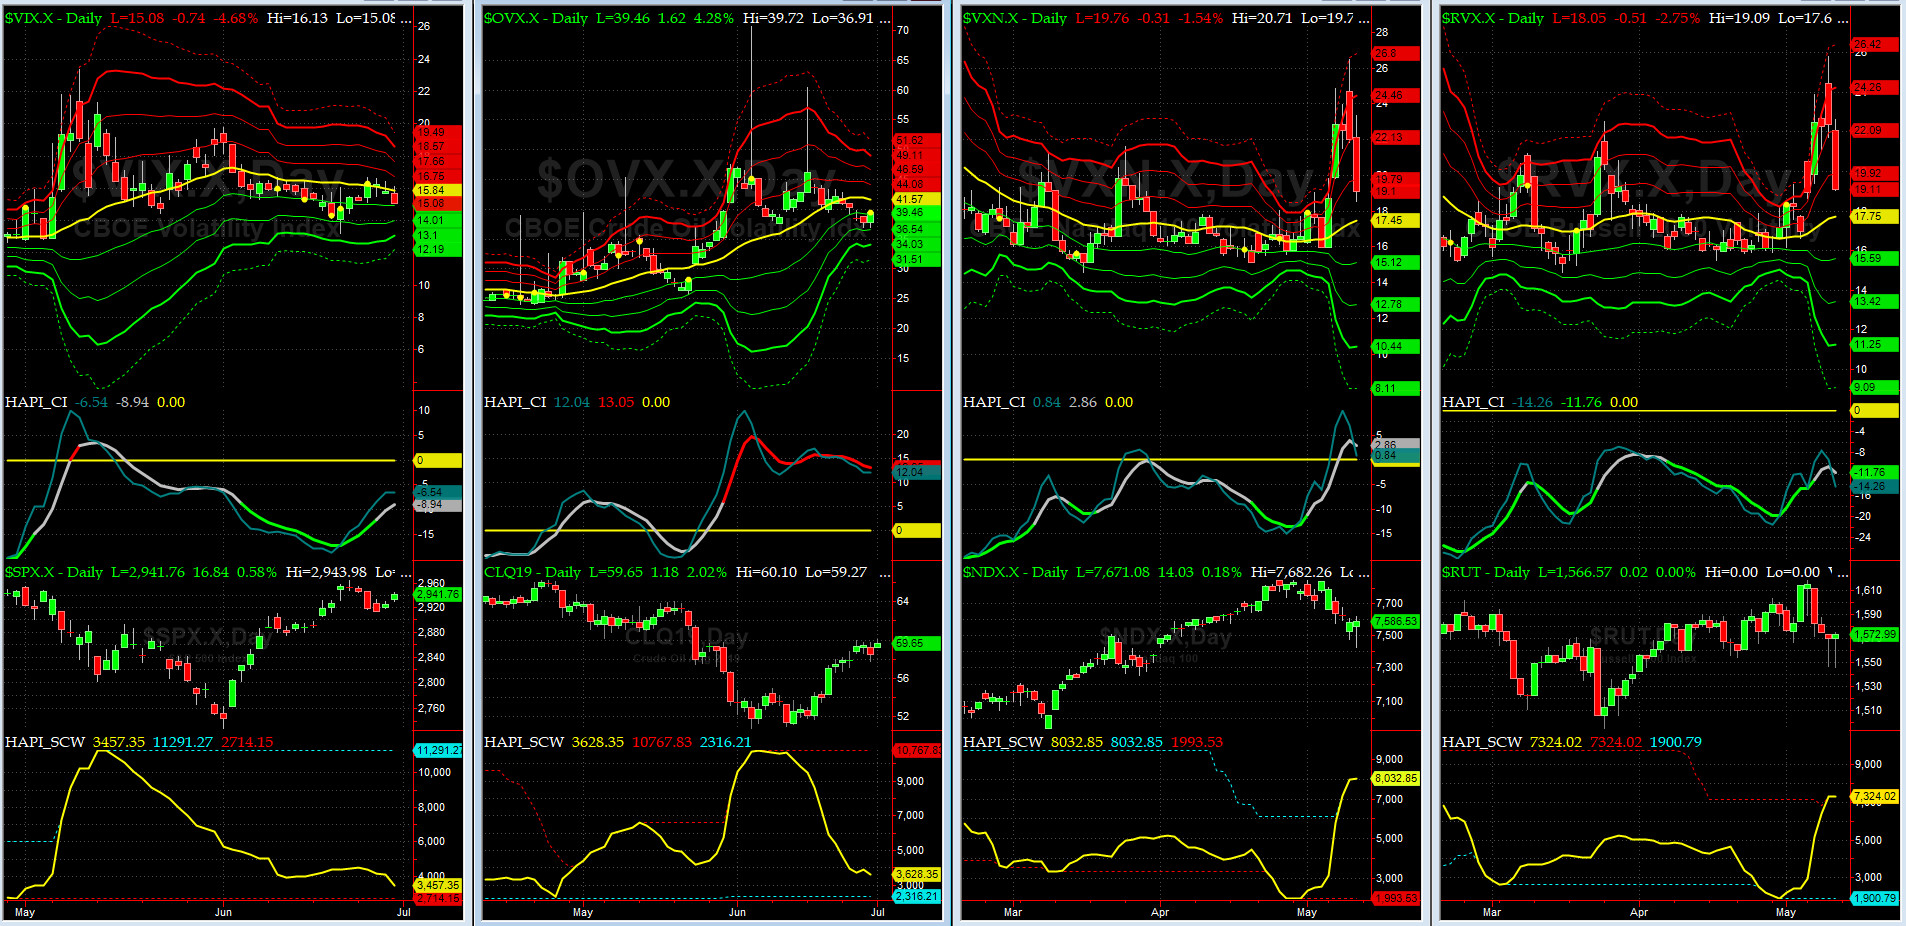
Vol of the Vols Chart
Spot VIX stood at 15.08 Friday night, at about its -1 sigma (remember it's the VIX volatility pattern aka "its sigma channels" that matters, and not the level of VIX itself (this is per Dr. Robert Whaley, a great mentor and inventor of original VIX, now called VXO). VIX usually peaks around a test of its +4 sigma).
Vols of the Vols were flat last week. Summer days are here again.
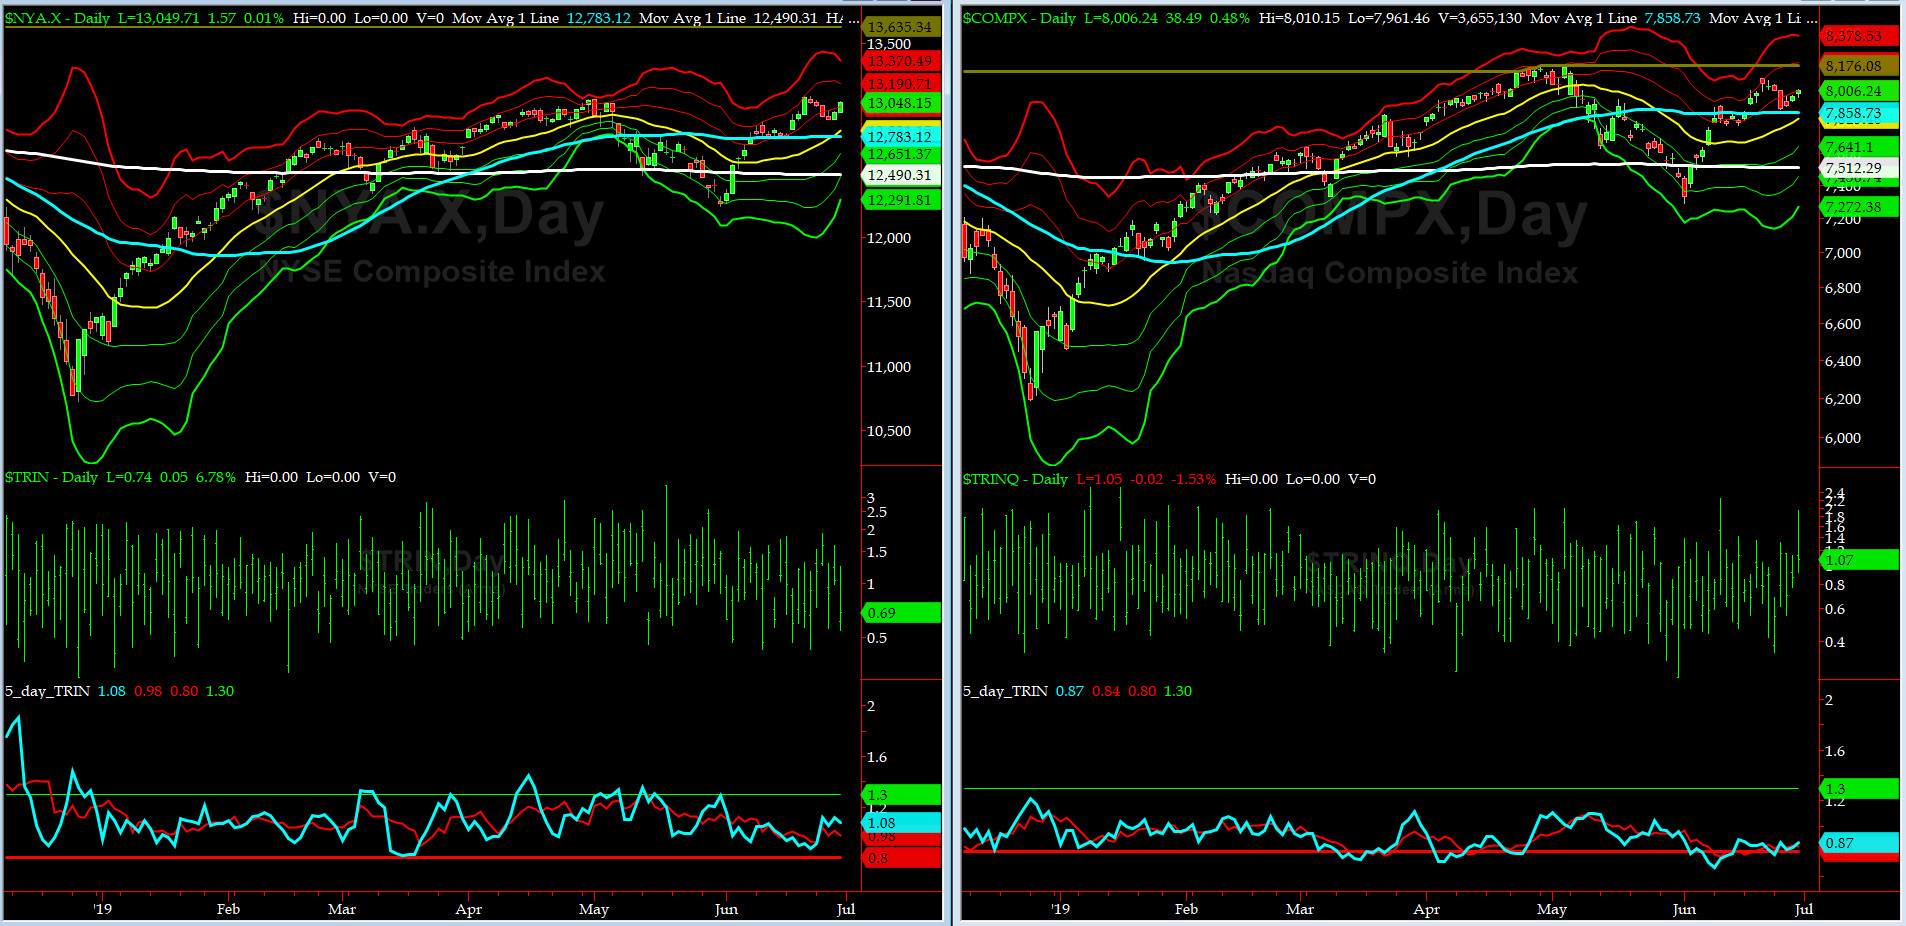
5-day TRIN & TRINQ Charts
NYSE 5-day TRIN in NEUTRAL mode while NASDAQ 5-day TRINQ is still hanging around SELL zone.
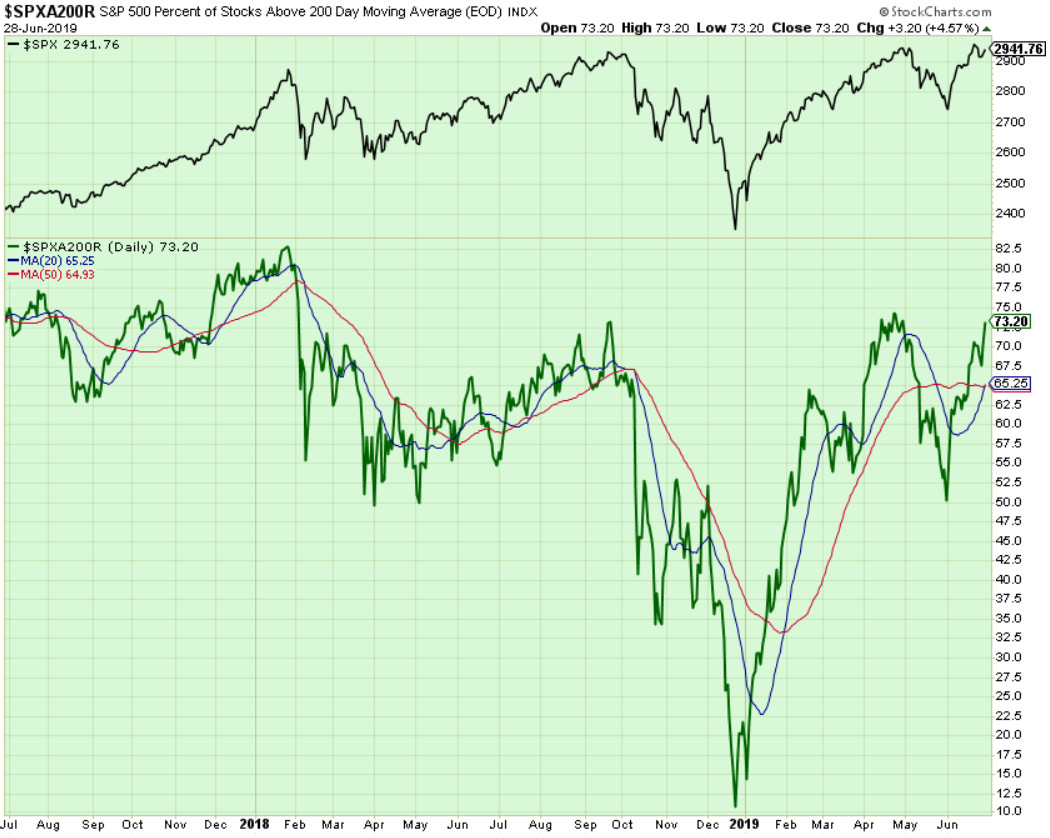
Components of SPX above their respective 200-day MA Chart
This scoring indicator rallied hard to 73% by Friday. The next levels to watch for are 75% and then 80%.
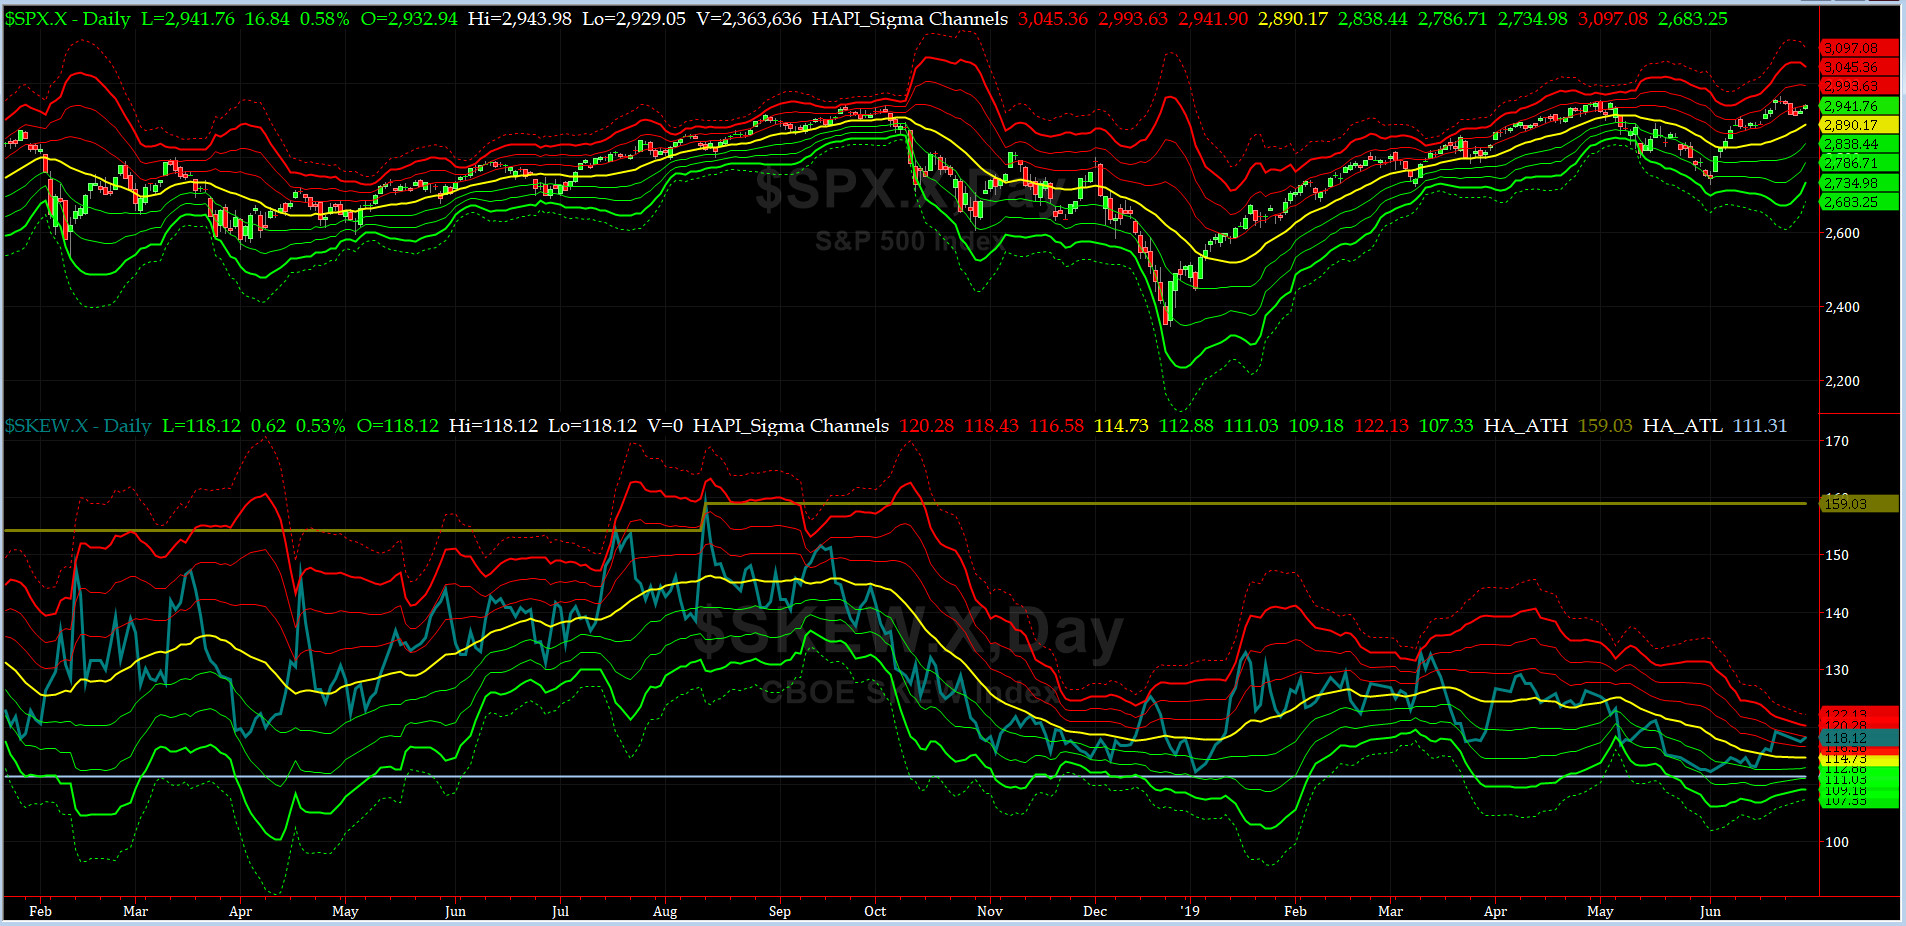
SPX SKEW (Tail Risk) Chart
On Friday, SPX SKEW (Tail Risk) closed near 118.1, now about its +2 sigma (normal = 115, range 100-150).
All quiet on the Eastern & Mid-Western Fronts? YES, INDEED....says our beloved HRH Capt Tiko, KCPE.
How to interpret the value of SPX SKEW? (from CBOE white paper on SKEW)

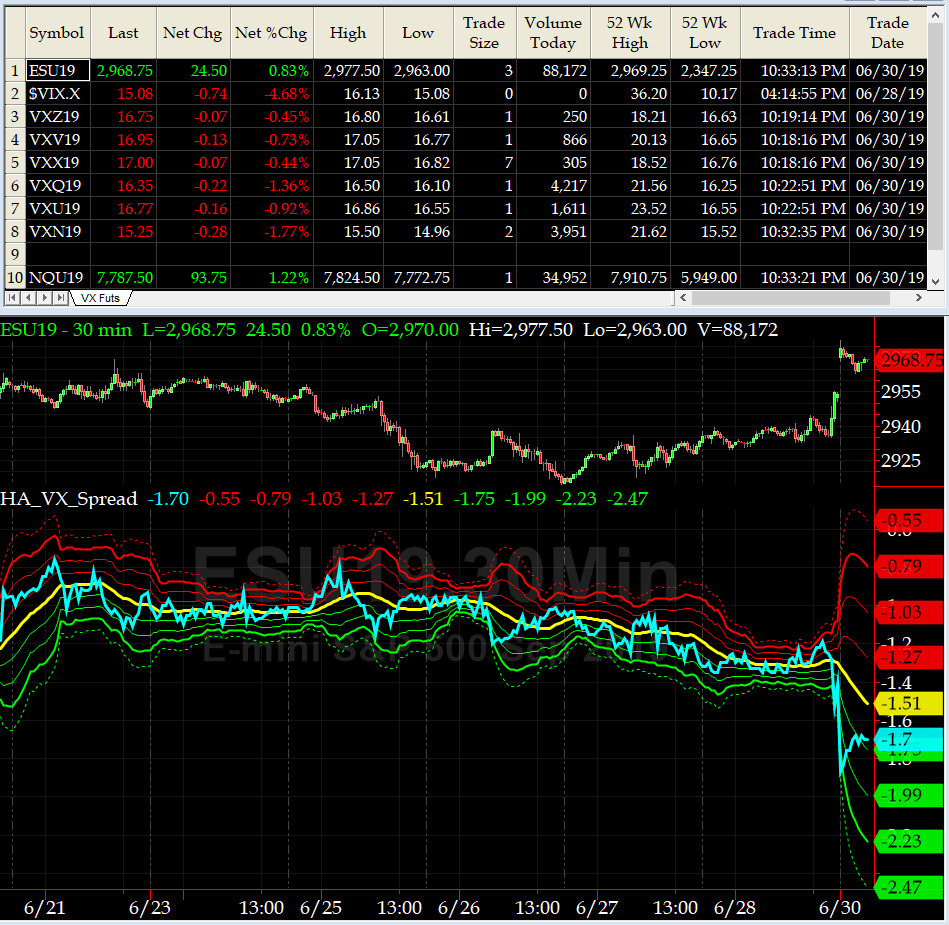
3-month VIX Futures Spread(VX) Chart
This popular timing indicator for identifying tradable bottoms, (now long JUL19, & short OCT19 VIX Futures) hit -1.52 on Friday Close. No signal here.
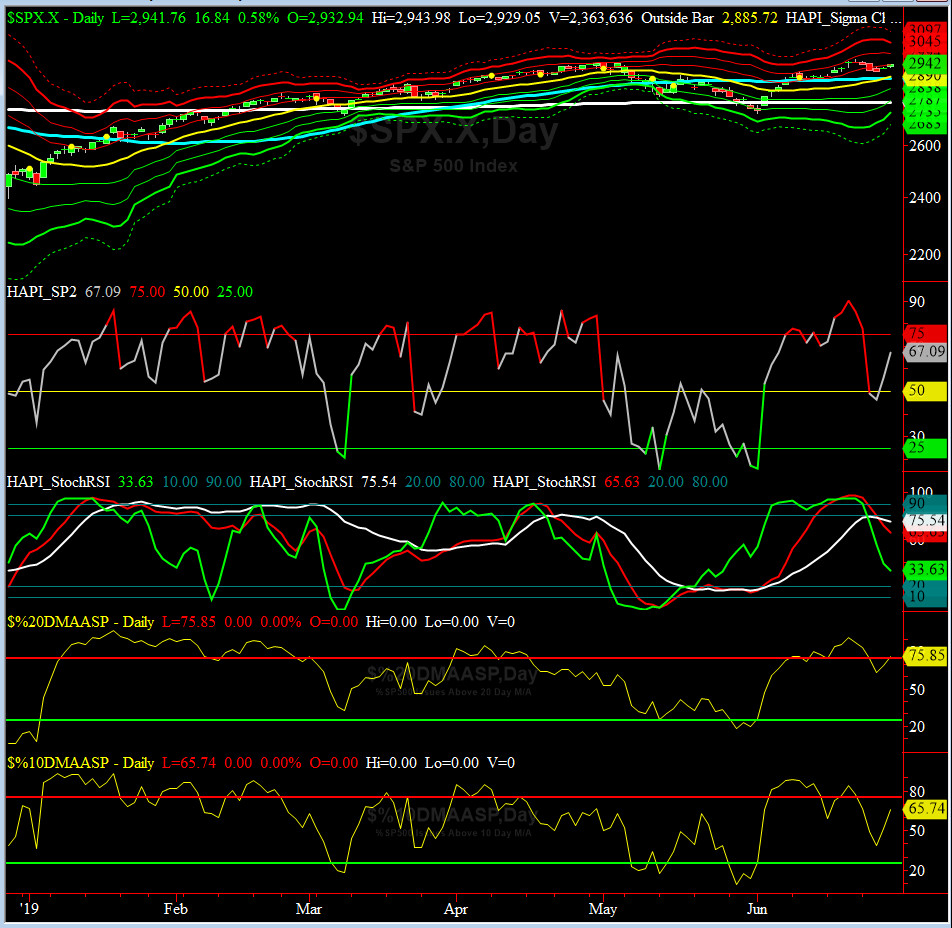
HA_SP2 Chart
HA_SP2 = 67.1 (Buy signal <= 25, Sell Signal >= 75)
Are we still in a topping formation? we think so + make sure you have plenty of iced tea on hand, per HRH @Capt_Tiko.
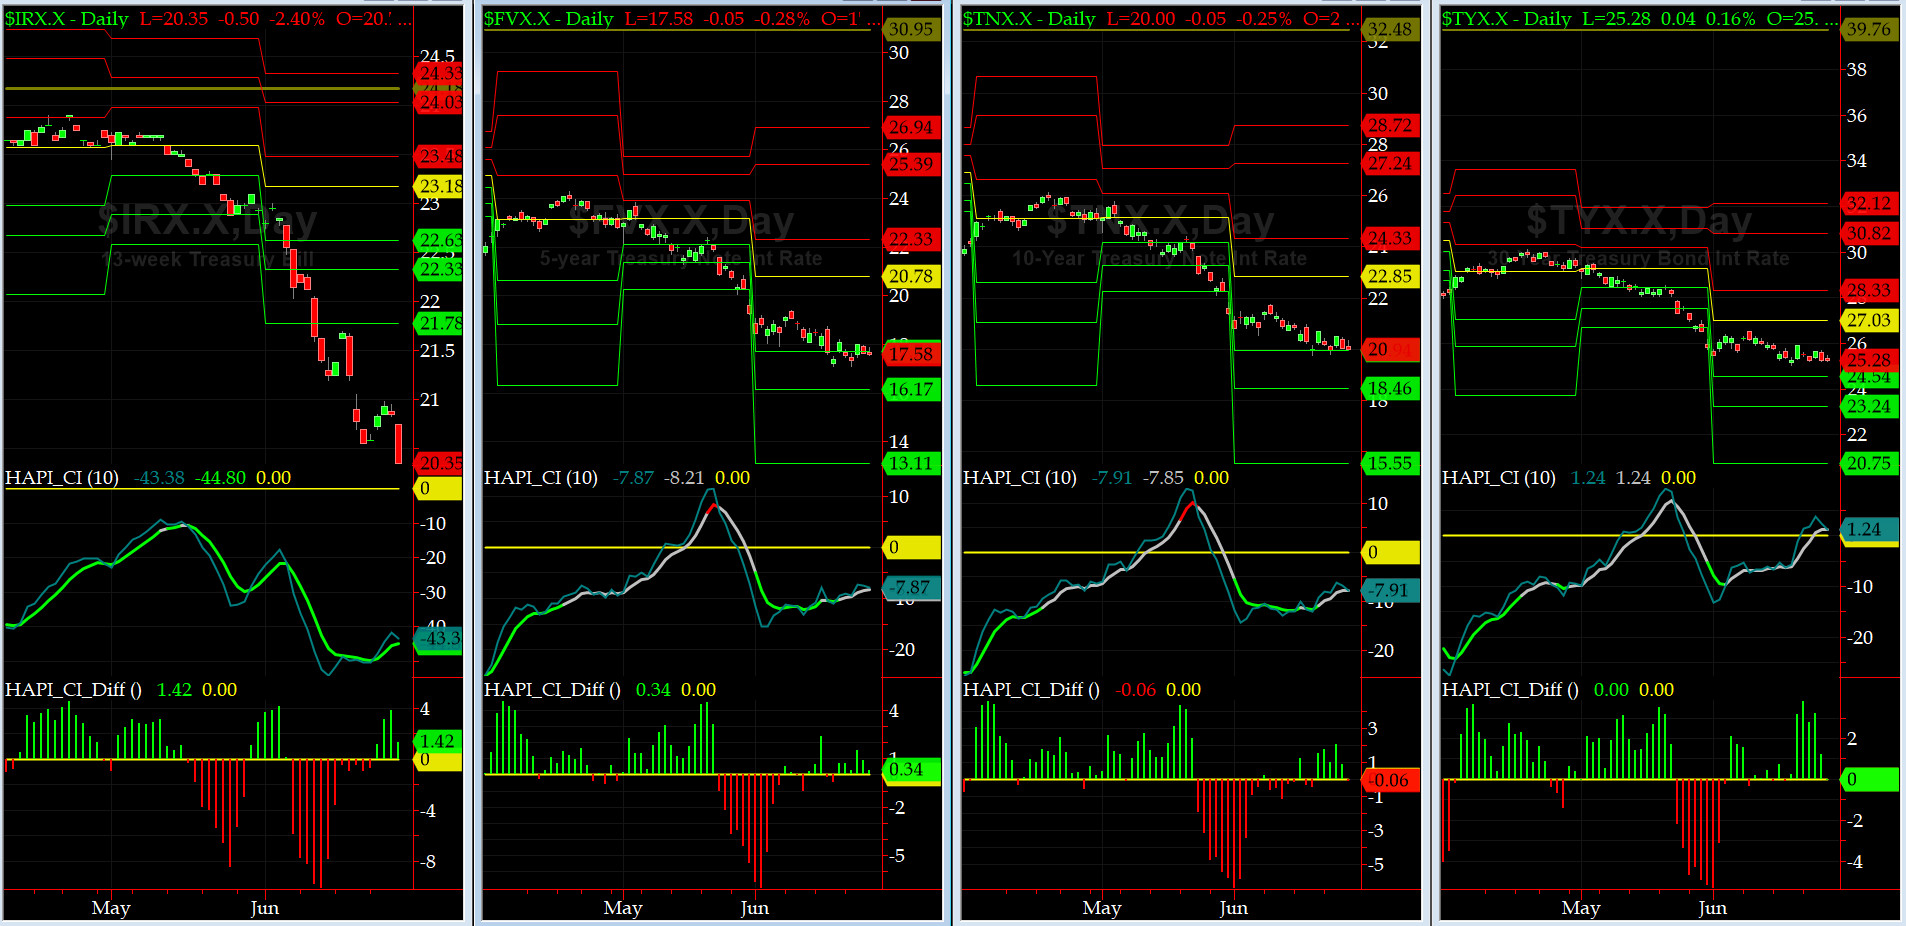
US Treasury T-Notes & T-Bonds Yields Chart
Last week the whole YTM Curve took another massive plunge. The yield curve is getting a tad more inverted...... Maury & Grumpino (plus Trumpkins) are still, in eternal words of Pink Floyd: Comfortably Numb.
Fari Hamzei
|


 Proactive Market Timing