
|
 |
 |
 |
 |
 |
 |
 |
 |
 Proactive Market Timing Proactive Market Timing
|
|
|
Most Recent PMT vs SPX Performance Chart

|
|
|
|
Tuesday, July 23, 2019, 1558ET
Notice of Change of Bias with Timer Digest
Dear Jim,
As discussed in my previous communication with our PMT Members, we are going FLAT SPX today at the Close.
Cheers�..
Fari Hamzei
|
|
|
|
|
|
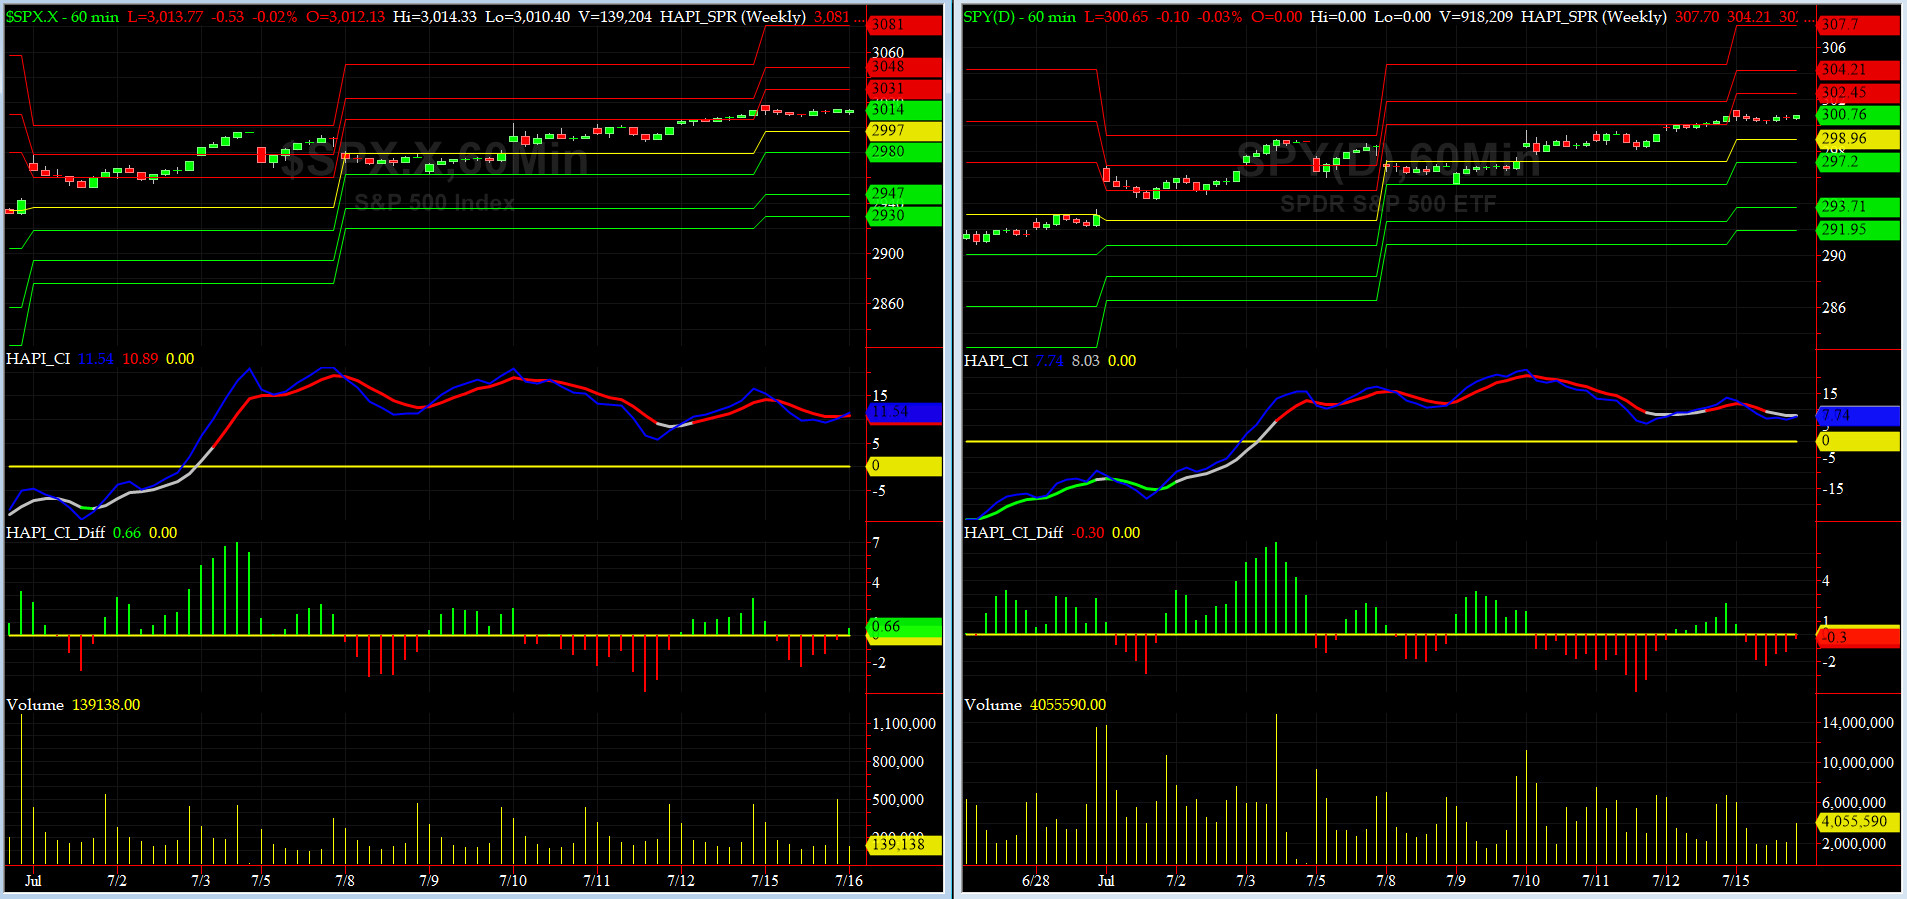
Tuesday, July 16, 2019, 1000ET
Companion Chart for Market Bias Review, Issue #299
|
|
|
|
|
|
Tuesday, July 16, 2018, 0955ET
Market Bias for Issue #299
Our current Market Bias with Timer Digest is LONG SPX as of JUL 15 at 3014
Our previous Market Bias was SHORT SPX as of JUL 8 at 2975
Here are the trade parameters for this week:
SPX Secondary Profit Target for last 20% of our position = 3065
SPX Primary Profit Target for first 80% of our position = 3040
SPX BreakEven Stop (Current Price) for last 20% of our position = 3013
SPX Money Management Stop for 100% of our position = 2995
|
| Action |
Asset |
Expiration |
Strike |
Option |
| BUY |
SPY |
Friday AUG 2 |
300 |
Calls |
| SELL SHORT |
SPY |
Friday AUG 2 |
305 |
Calls |
| You need to execute both legs and hold it as a Call-Spread.
|
Note A:
Once the Primary Profit Target has been reached, traders are advised to close 80% of their position in order to lock in profits. The remaining balance can be carried over with a BreakEven STOP, based on the SPX level at the time of entry, in order to make the trade a zero-risk trade with the final position running to reach the Secondary Profit Target.
Once either Secondary Profit or Money Management (BreakEven STOP after the 80% peel-off) is hit, our Option/ETF trade for that week is over. Go to Cash and wait for the next PMT Issue.
Note B:
When we change our Market Bias with Timer Digest, You need to go FLAT asap. With PMT Pro, that is before the Close that day and with the basic PMT, at the open of the next day. The following trading day, we will issue new SPX targets and a new SPY options trade, as long our new market bias with Timer Digest is NOT flat.
Fari Hamzei
|
|
|
|
|
|
Monday, July 15, 2019, 1550ET
Notice of Change of Bias with Timer Digest
Dear Jim,
Chart Patterns don�t lie�.. we have been looking long & hard and yet can�t find a reason to stay short. Getting LONG SPX tonight at the Close���
Cheers,
Fari Hamzei
|
|
|
|
|
|
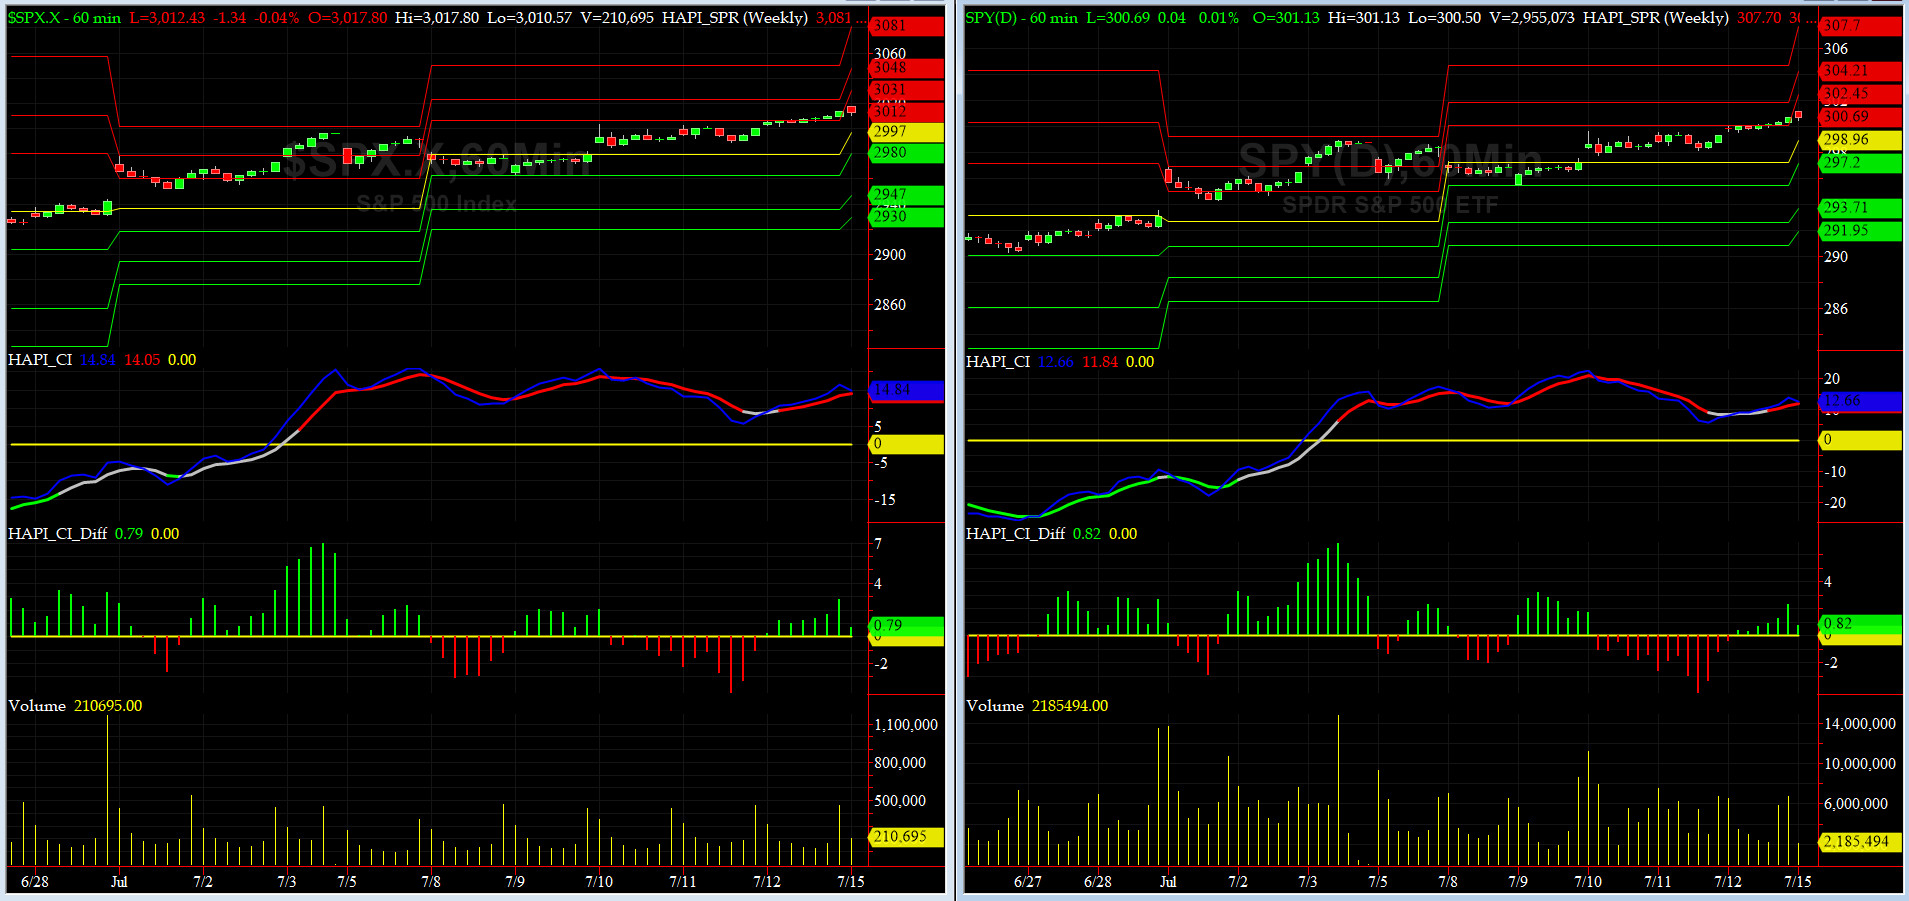
Monday, July 15, 2019, 1005ET
Companion Chart for Market Bias Review, Issue #299
|
|
|
|
|
|
Monday, July 15, 2019, 1000ET
Market Bias for Issue #299
Our current Market Bias with Timer Digest is SHORT SPX as of Jul 8 at 2976
Our previous Market Bias was LONG SPX as of Jun 26 at 2942
Here are the trade parameters for this week:
SPX Money Management Stop for 100% of our position = 3030
SPX BreakEven Stop (Current Price) for last 20% of our position = 3012
SPX Primary Profit Target for first 80% of our position = 2985
SPX Secondary Profit Target for last 20% of our position = 2970
|
| Action |
Asset |
Expiration |
Strike |
Option |
| BUY |
SPY |
Friday AUG 2 |
300 |
Puts |
| SELL SHORT |
SPY |
Friday AUG 2 |
296 |
Puts |
| You need to execute both legs and hold it as a Put-Spread.
|
Note A:
Once the Primary Profit Target has been reached, traders are advised to close 80% of their position in order to lock in profits. The remaining balance can be carried over with a BreakEven STOP, based on the SPX level at the time of entry, in order to make the trade a zero-risk trade with the final position running to reach the Secondary Profit Target.
Once either Secondary Profit or Money Management (BreakEven STOP after the 80% peel-off) is hit, our Option/ETF trade for that week is over. Go to Cash and wait for the next PMT Issue.
Note B:
When we change our Market Bias with Timer Digest, You need to go FLAT asap. With PMT Pro, that is before the Close that day and with the basic PMT, at the open of the next day. The following trading day, we will issue new SPX targets and a new SPY options trade, as long our new market bias with Timer Digest is NOT flat.
Fari Hamzei
|
|
|
|
|
|
Monday, July 15, 2019, 0845ET
Market Timing Charts, Analysis & Commentary for Issue #299
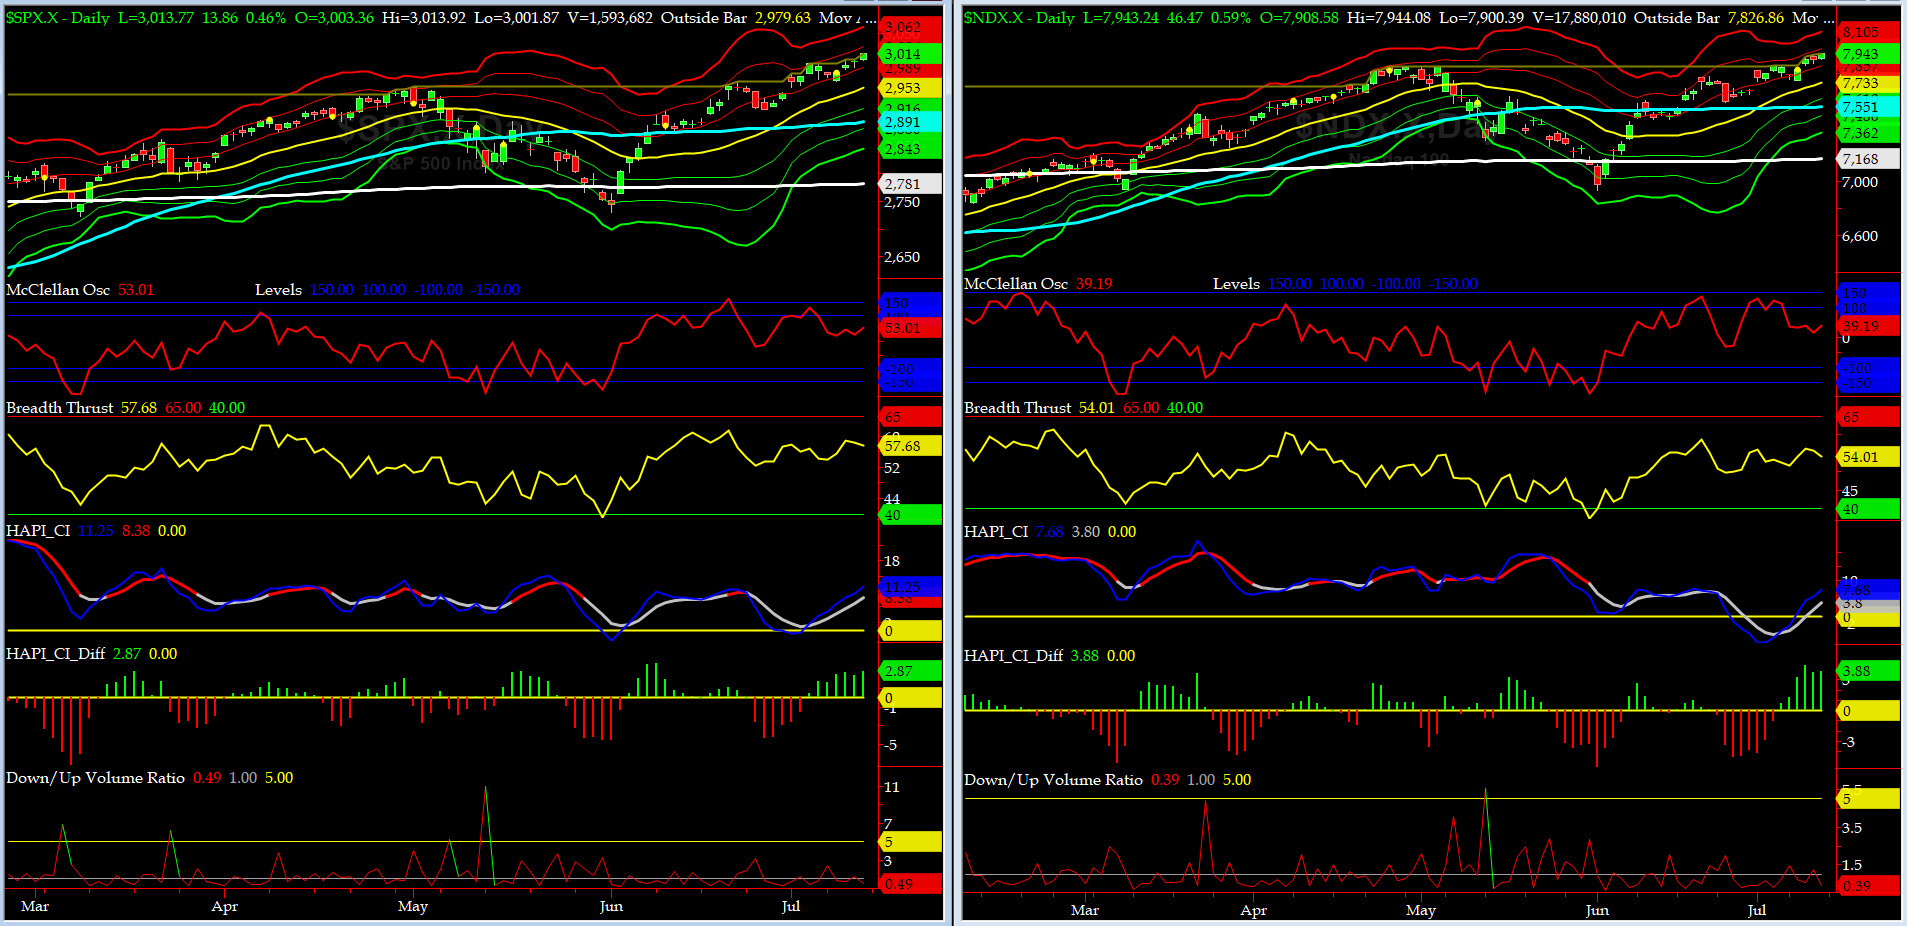
Timer Charts of S&P-500 Cash Index (SPX) + NASDAQ-100 Cash Index (NDX)
Most recent S&P-500 Cash Index (SPX): 3014 up +24 (up +0.8%) for the week ending on Friday, July 12, 2019, which closed near its +1 sigma.
DJIA ALL TIME INTRADAY HIGH = 27332 (reached on Friday, July 12, 2019)
DJT ALL TIME INTRADAY HIGH = 11623 (reached on Friday, September 14, 2018)
SPX ALL TIME INTRADAY HIGH = 3014 (reached on Friday, July 12, 2019)
NDX ALL TIME INTRADAY HIGH = 7943 (reached on Friday, July 12, 2019)
RUT ALL TIME INTRADAY HIGH = 1742 (reached on Friday, August 31, 2018)
Current DAILY +2 Sigma SPX = 3026 with WEEKLY +2 Sigma = 3023
Current DAILY 0 Sigma SPX = 2953 with WEEKLY 0 Sigma = 2879
Current DAILY -2 Sigma SPX = 2880 with WEEKLY -2 Sigma = 2734
NYSE McClellan Oscillator = +53 (-150 is start of the O/S area; around -275 to -300 area or lower, we go into the �launch-pad� mode; over +150, we are in O/B area)
NYSE Breadth Thrust = 57.7 (40 is considered as oversold and 65 as overbought)
Another great week for the longs with SPX, NDX DJIA making new ATHs. Q2 Earnings Season is upon us.
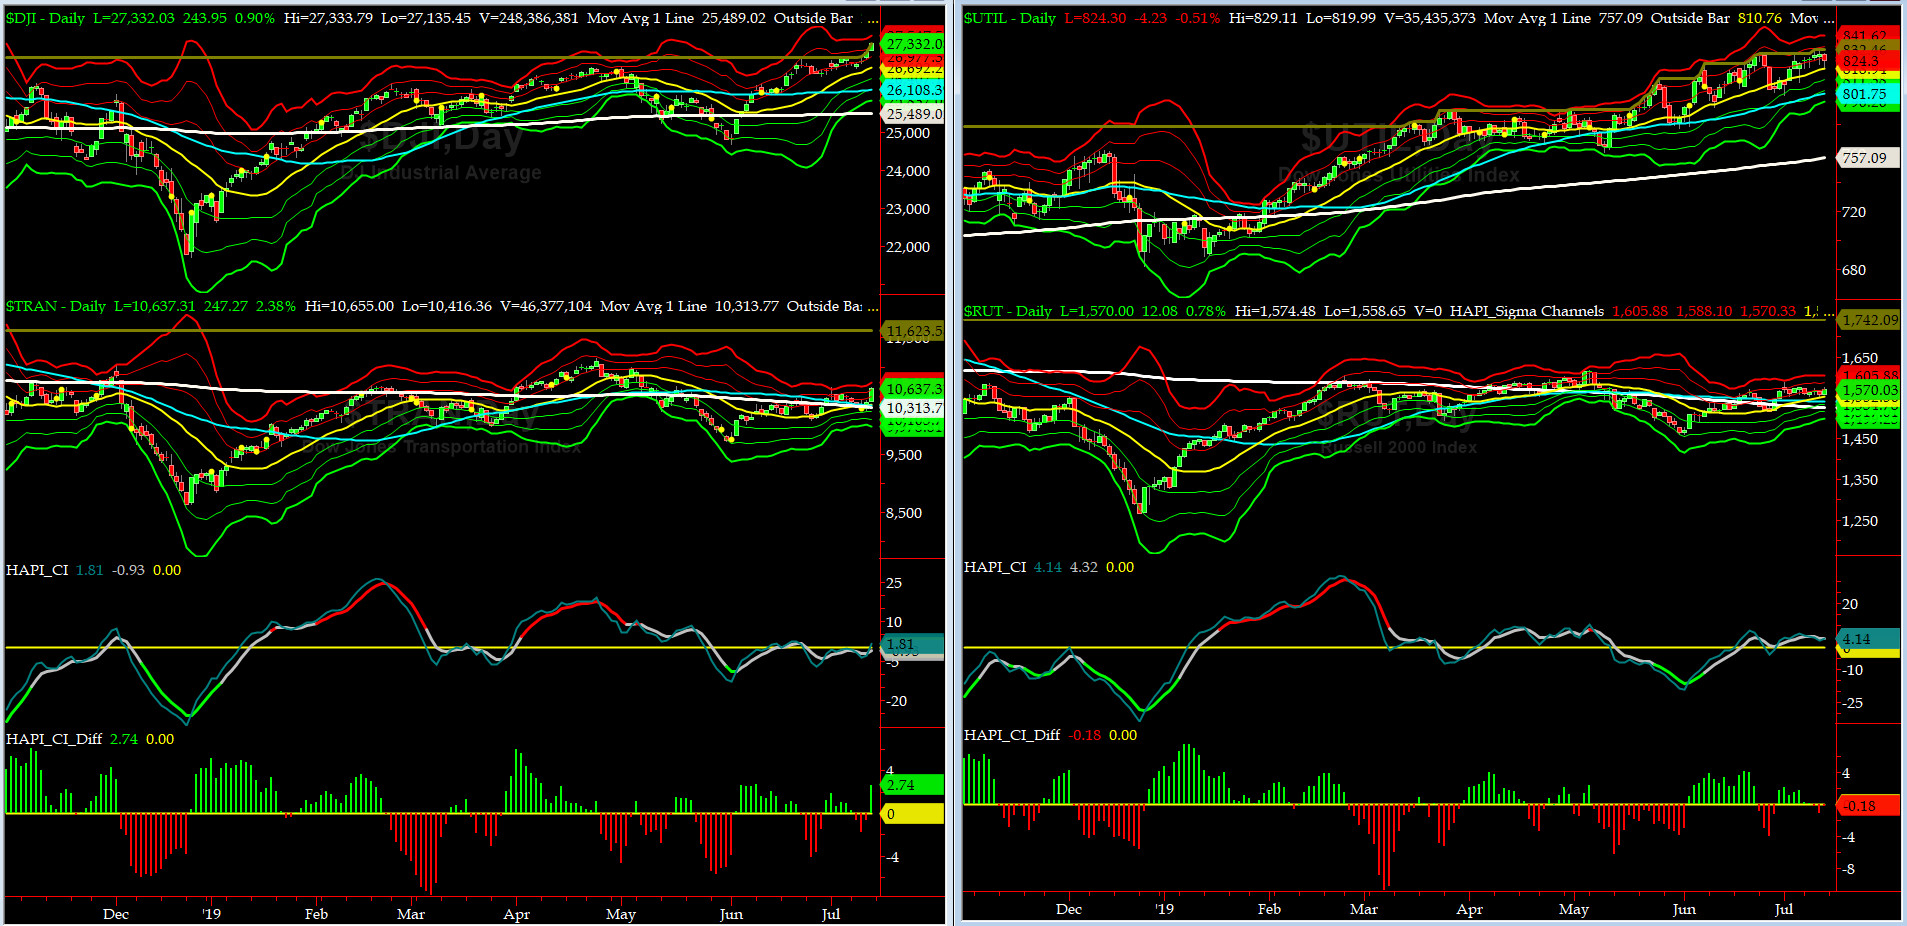
Canaries [in the Coal Mine] Chart for DJ TRAN & RUT Indices
200-Day MA DJ TRAN = 10,313 or 3.1% BELOW DJ TRAN (max observed in last 7 yrs = 20.2%, min = -20.3%)
200-Day MA RUT = 1526 or 2.9% BELOW RUT (max observed in last 7 yrs = 21.3%, min = -22.6%)
DJ Transportation Index (proxy for economic conditions 6 to 9 months hence) made a HUGE move on Friday. That's constructive for the longs, ioho.
Russell 2000 Small Caps Index (proxy for Risk ON/OFF) did not fair as well and but went nowhere fast. RISK ON is not there yet.
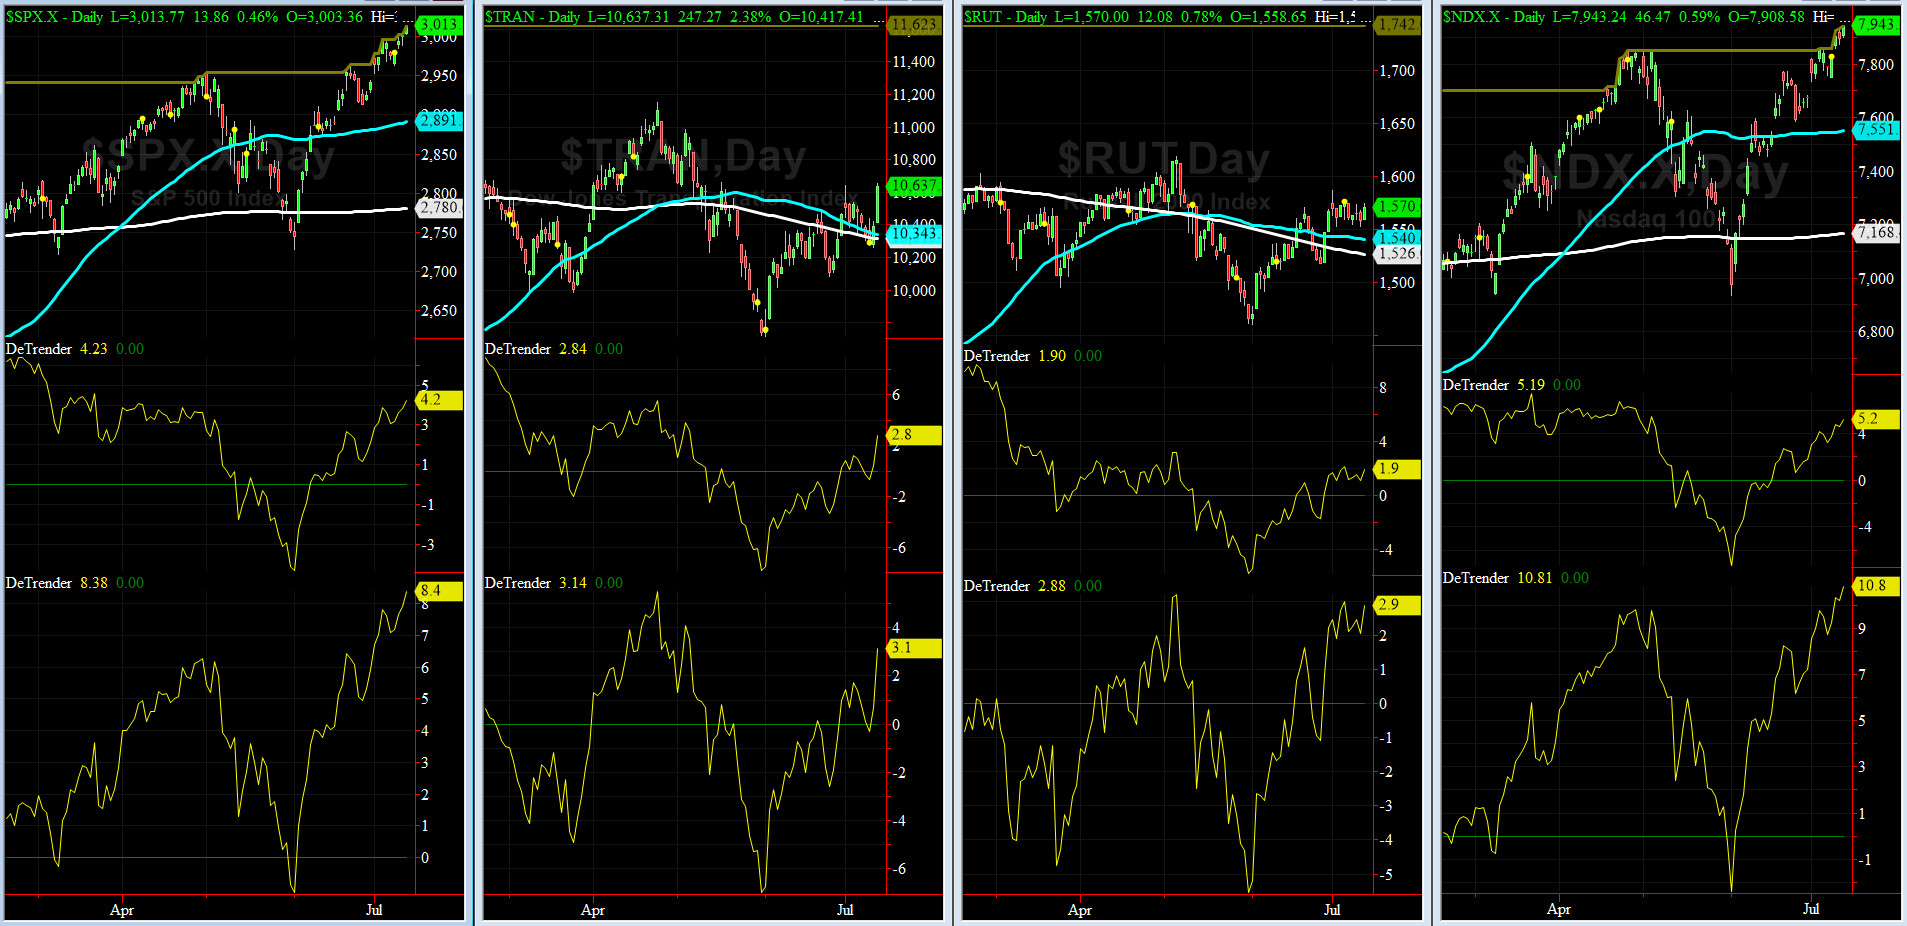
DeTrenders Charts for SPX, NDX, TRAN & RUT Indices
50-Day MA SPX = 2891 or 4.2% BELOW SPX (max observed in last 7 yrs = +8.6%, min = -9.3%)
200-Day MA SPX = 2780 or 8.4% BELOW SPX (max observed in last 7 yrs = 15.2%, min = -14%)
ALL of our EIGHT DeTrenders are in the POSITIVE territory. The DeTrenders for DJ Tran & RUT will continue to be harbingers of future price behavior in broad indices.
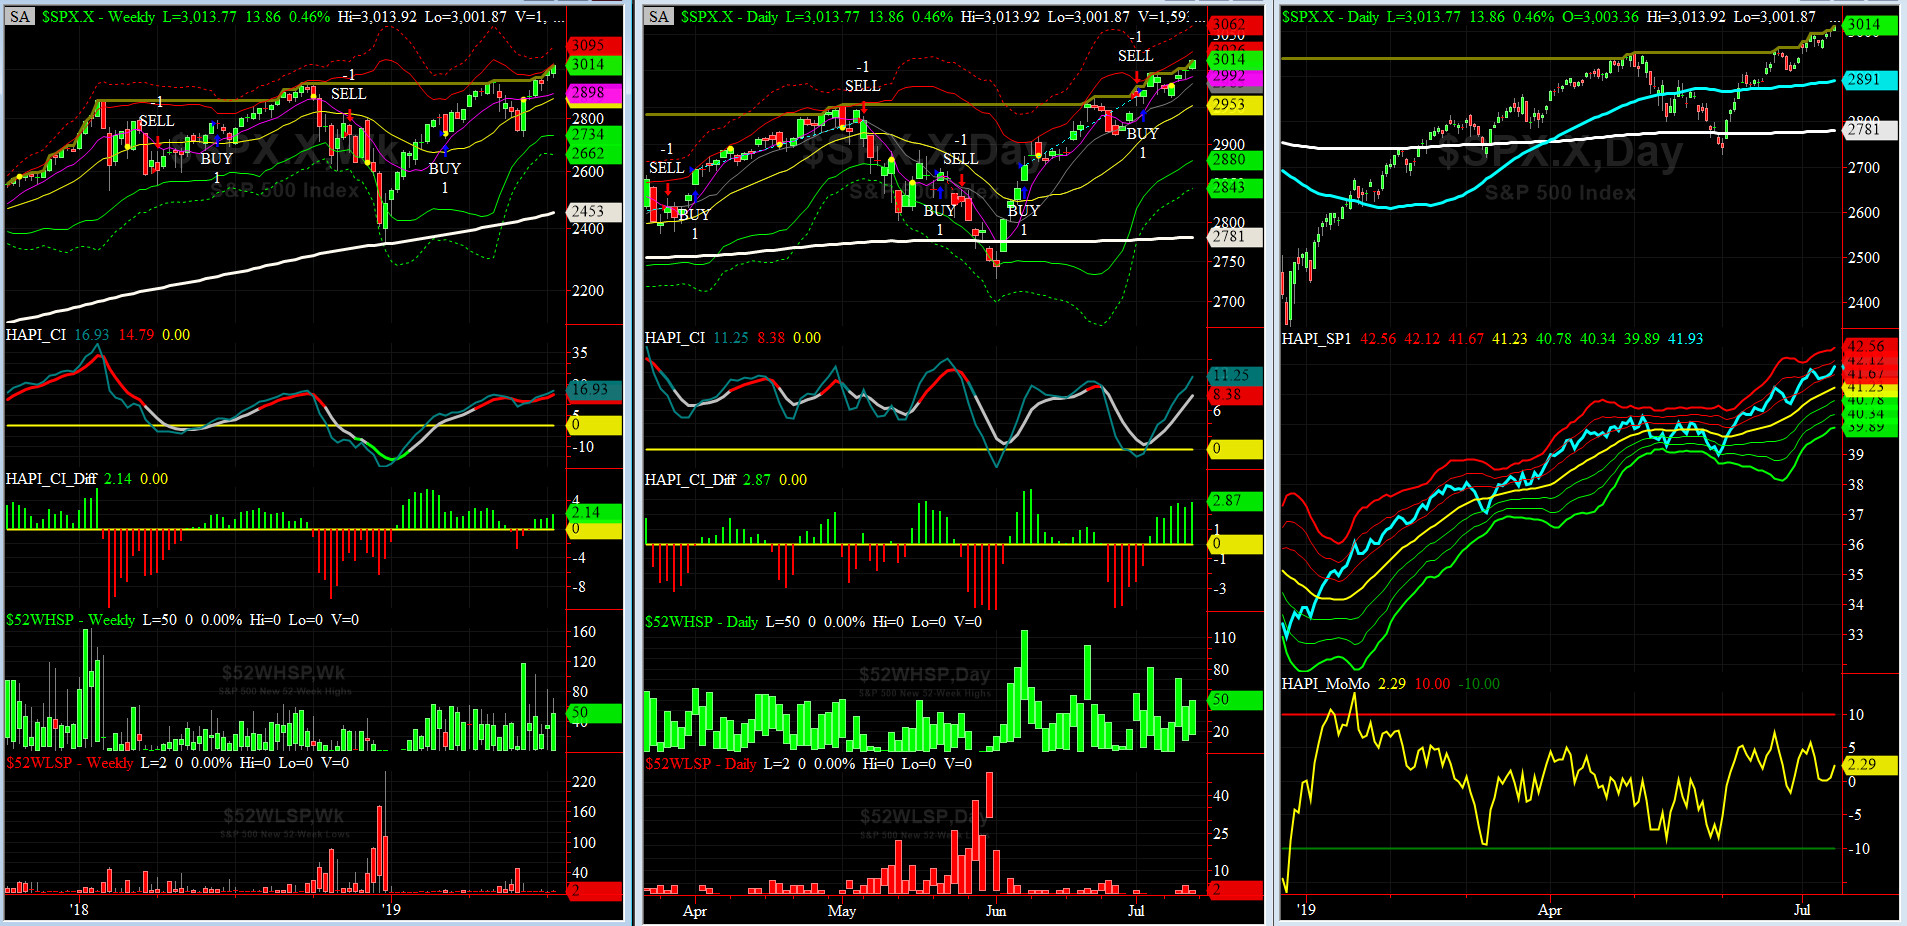
HA_SP1_Momo Chart
WEEKLY Timing Model = on a BUY Signal since Friday, March 8, 2019 CLOSE at 2743
DAILY Timing Model = on a BUY Signal since Tuesday, July 2, 2019 CLOSE at 2873
Max SPX 52wk-highs reading last week = 71 (over 120-140, the local maxima is in)
Max SPX 52wk-Lows reading last week = 4 (over 40-60, the local minima is in)
HA_SP1 closed near its +1.5 sigma channels
HA_Momo = +2.3 (reversals most likely occur above +10 or below -10)
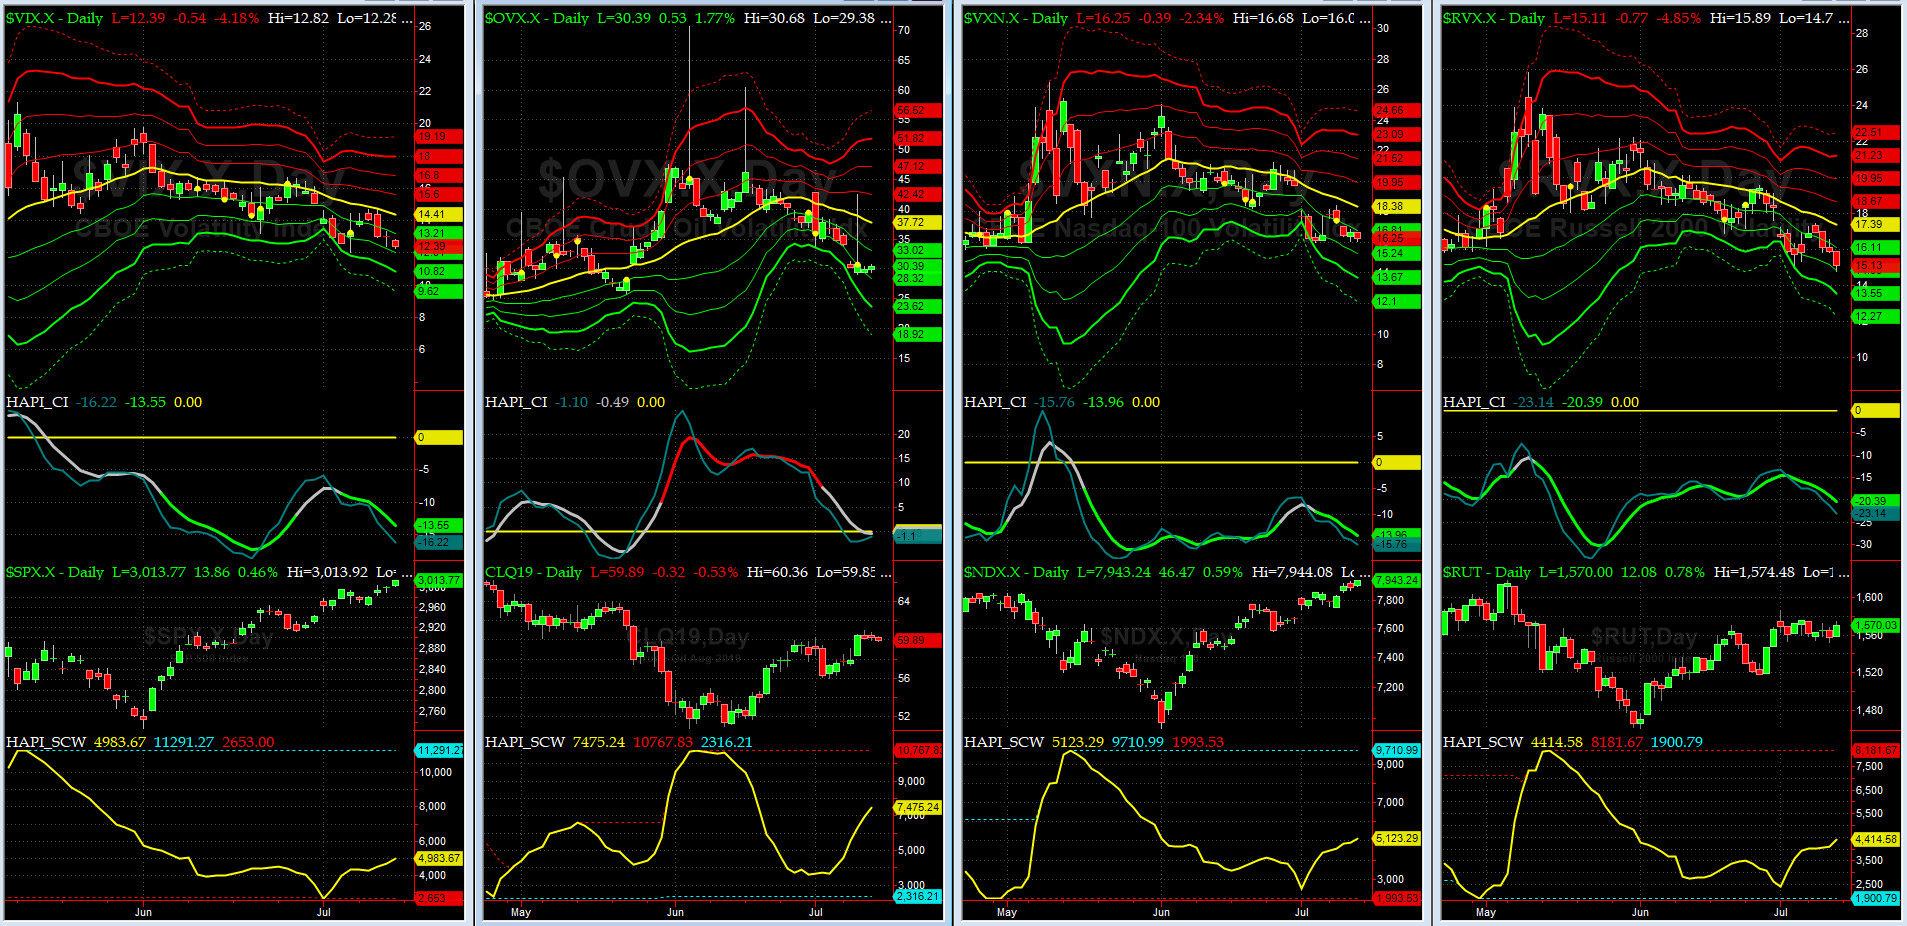
Vol of the Vols Chart
Spot VIX stood at 12.39 Friday night, at about its -1.5 sigma (remember it's the VIX volatility pattern aka "its sigma channels" that matters, and not the level of VIX itself (this is per Dr. Robert Whaley, a great mentor and inventor of original VIX, now called VXO). VIX usually peaks around a test of its +4 sigma).
Vols have drifted down fairly slowly here. Summer trading days are here again.
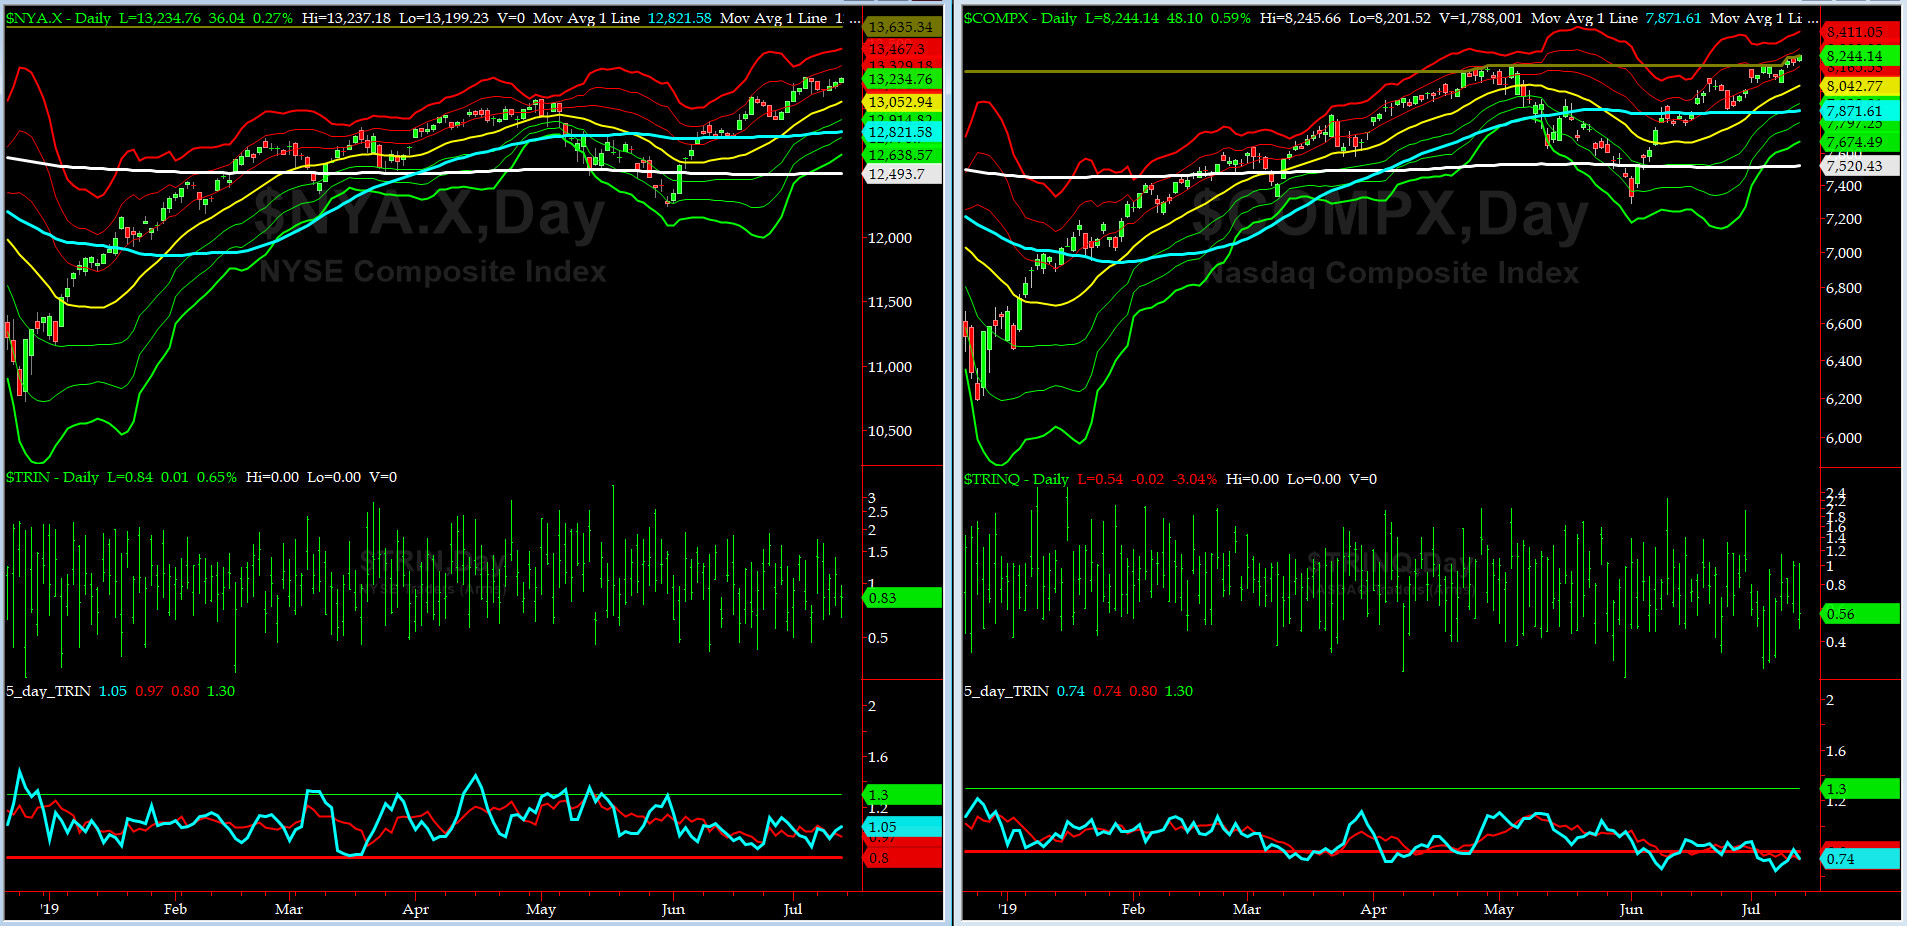
5-day TRIN & TRINQ Charts
NYSE 5-day TRIN is in NEUTRAL while NASDAQ 5-day TRINQ is in SELL zone.
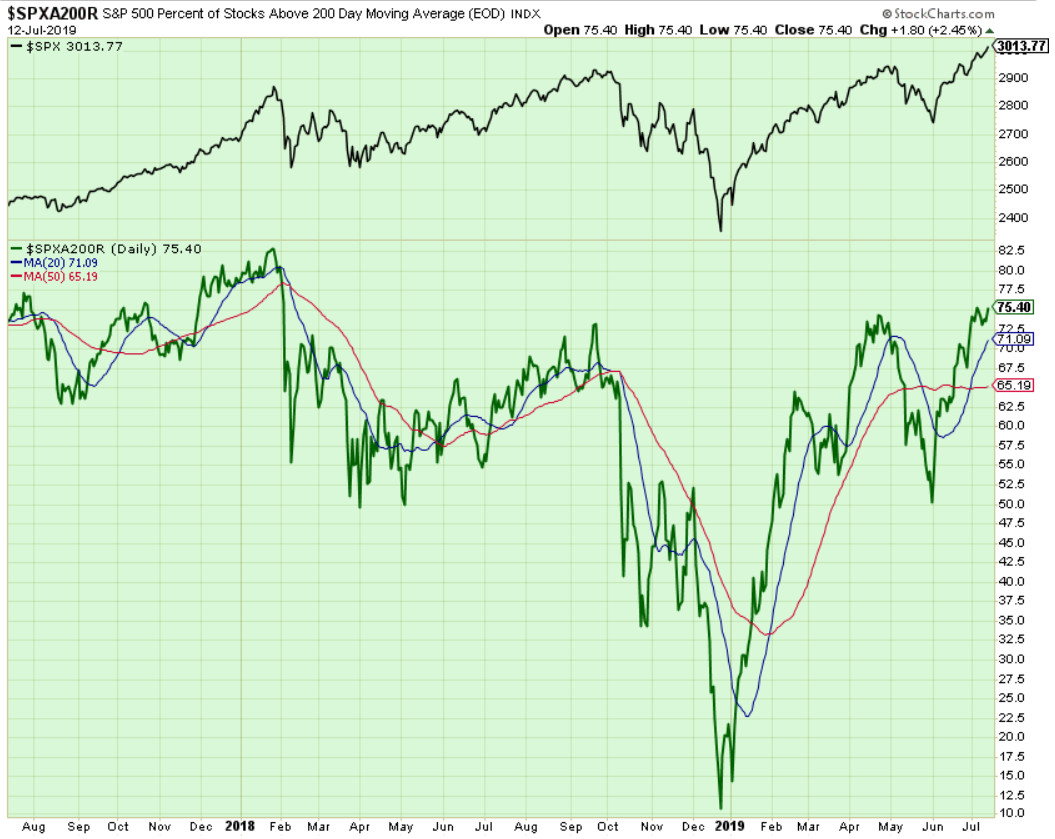
Components of SPX above their respective 200-day MA Chart
This scoring indicator stayed at 75%. Our next target is 80-82%.
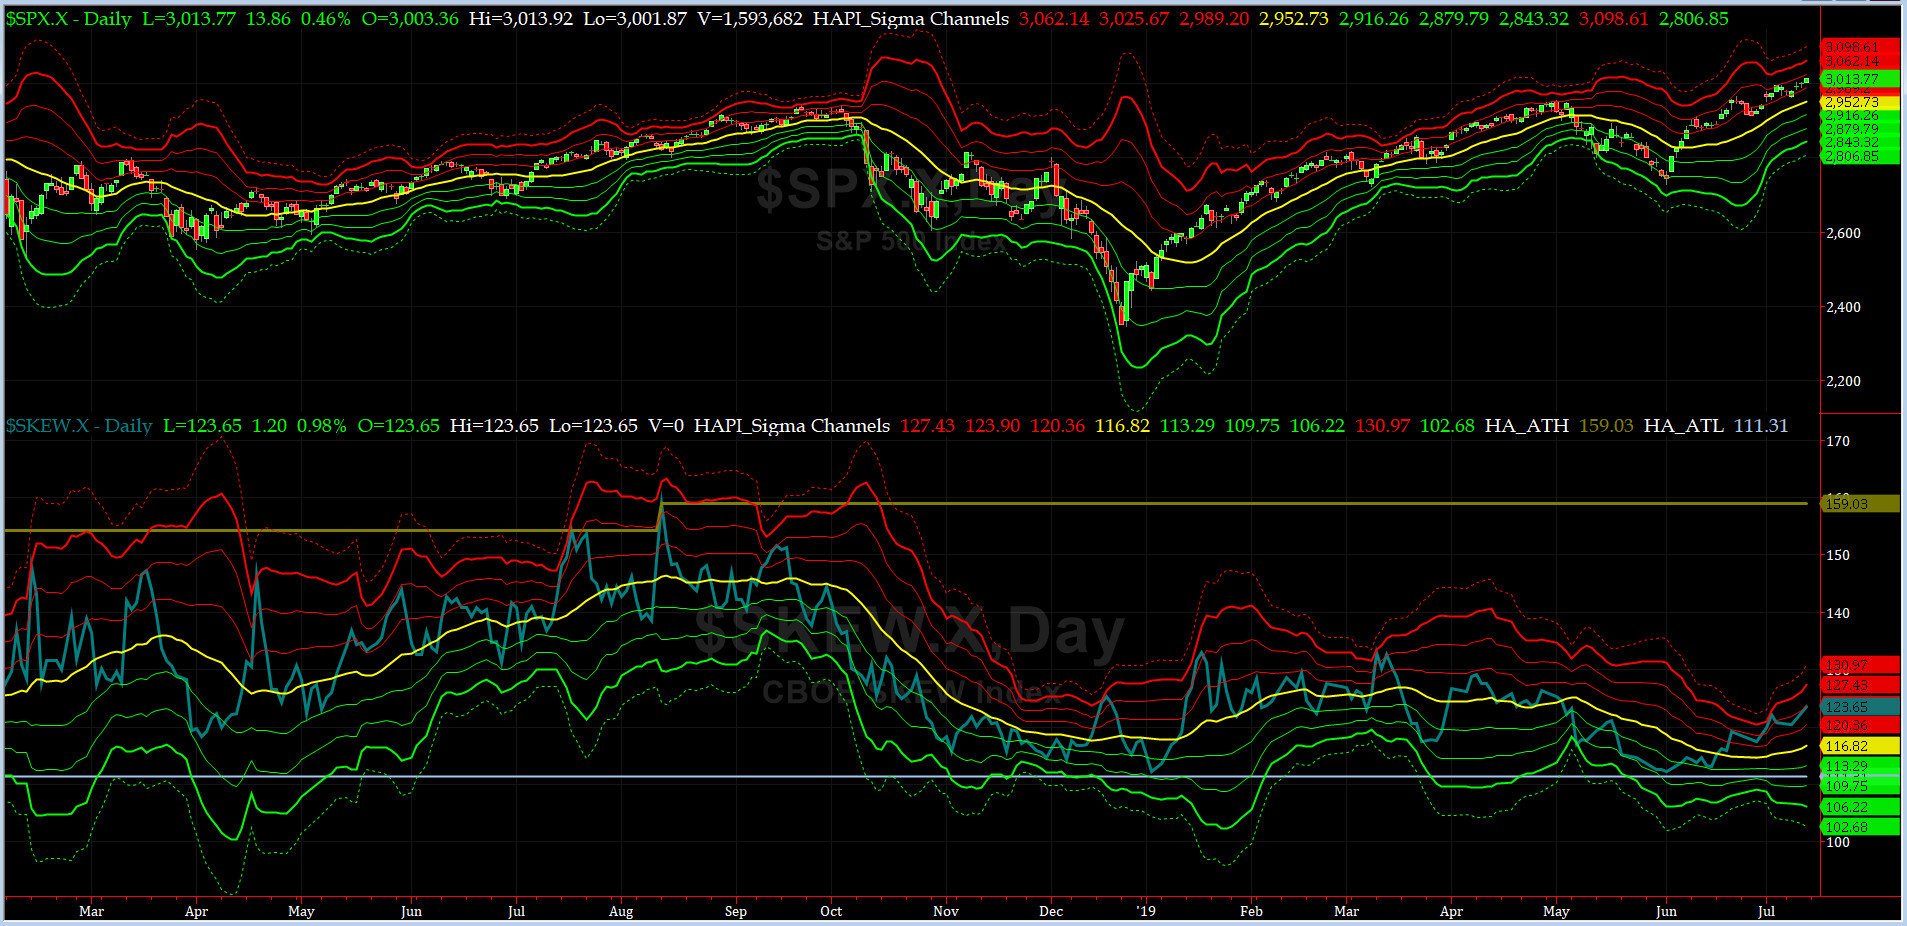
SPX SKEW (Tail Risk) Chart
On Friday, SPX SKEW (Tail Risk) rose pretty sharply to 123.6, now about its +2 sigma (normal = 115, range 100-150).
All quiet on the Eastern & Mid-Western Fronts? well, our beloved HRH Capt. Tiko, KCPE, still expects some rock 'n roll ahead.
How to interpret the value of SPX SKEW? (from CBOE white paper on SKEW)

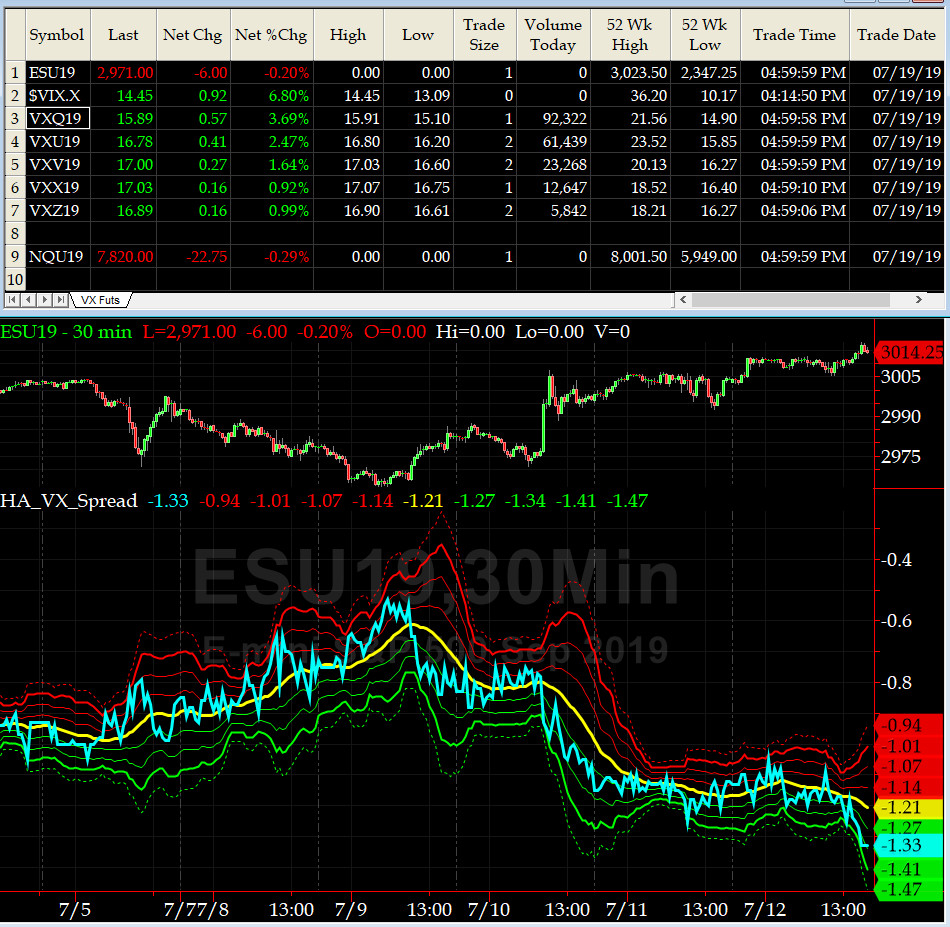
3-month VIX Futures Spread(VX) Chart
This popular timing indicator for identifying tradable bottoms, (now long AUG19, & short NOV19 VIX Futures) hit -1.33 on Friday Close. That is a NEUTRAL signal.
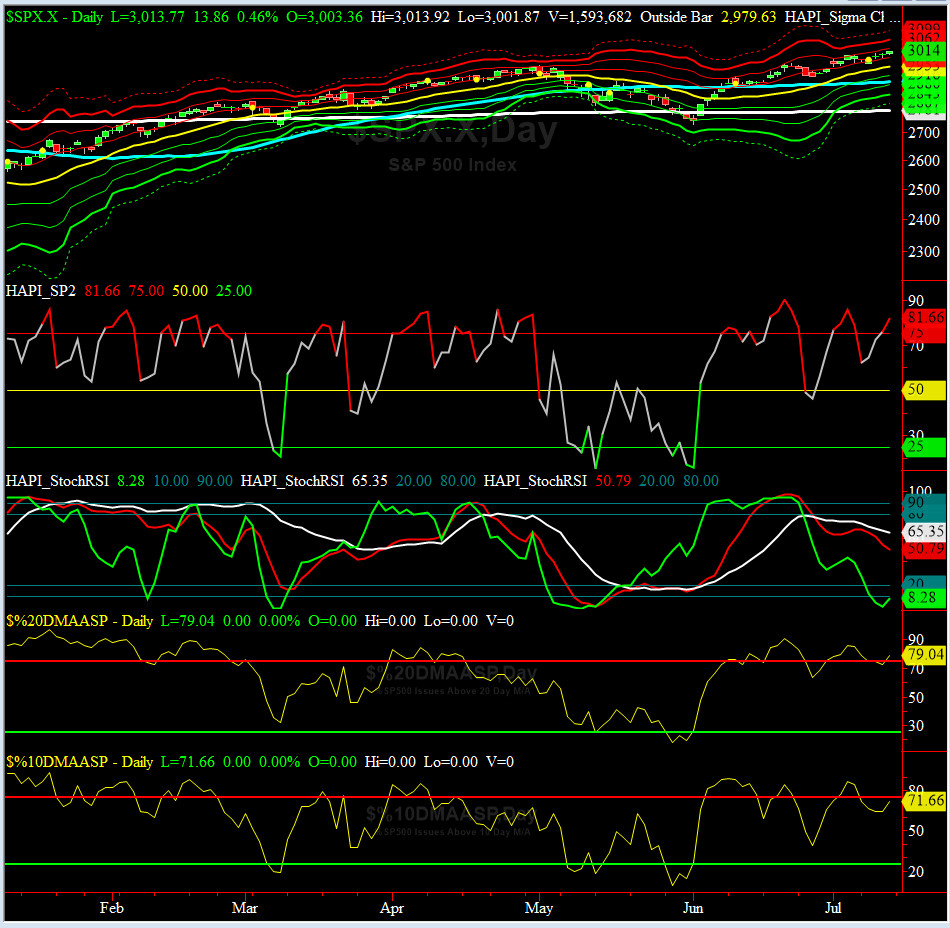
HA_SP2 Chart
HA_SP2 = 81.6 (Buy signal <= 25, Sell Signal >= 75)
Are we still in a topping formation? we think so + make sure you have plenty of iced tea on hand, per HRH @Capt_Tiko, KCPE.
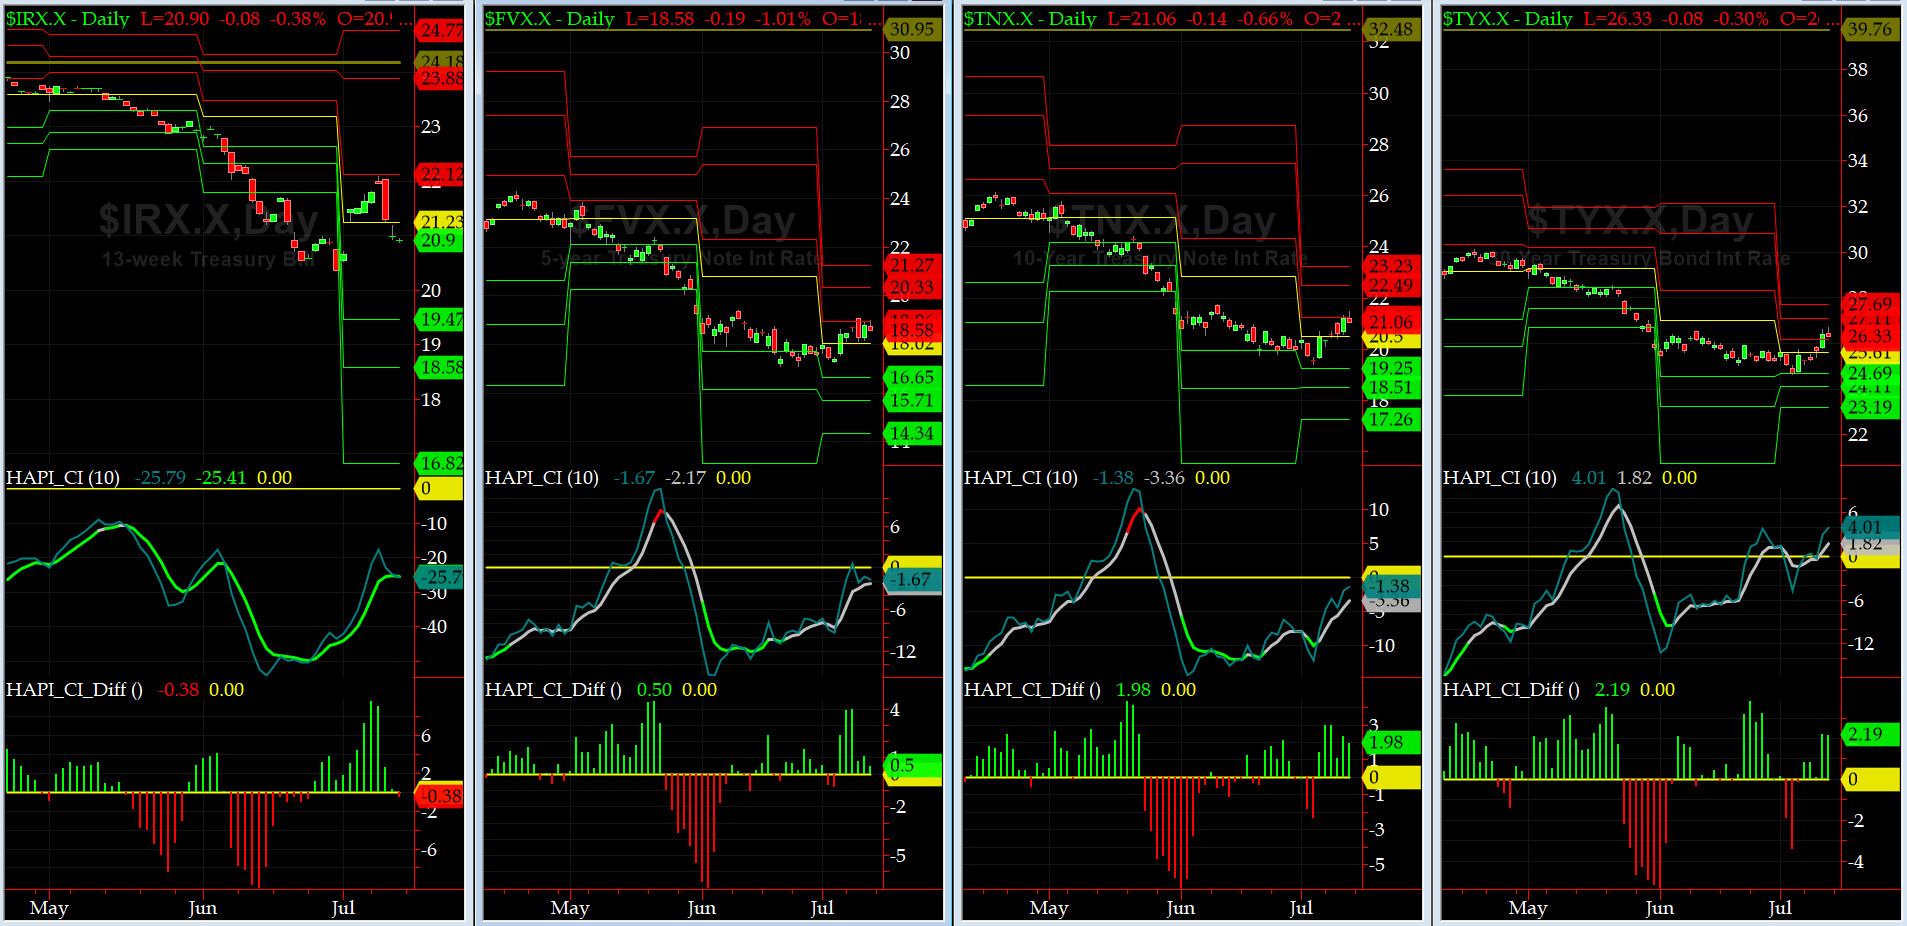
US Treasury T-Notes & T-Bonds Yields Chart
We saw a huge drop in the front end of the yield curve, with a slight rise at its long-end, thanks to Fed Chair Jay Powell.
Fari Hamzei
|
|
|
|
|
|
Customer Care:
|
|
|
|
|
|
|
 |
 |
|
 |
|
 |
 |
 |
HA YouTube Channel ::: HA Blog ::: Testimonials ::: Tutorials & FAQs ::: Privacy Policy
|
Trading Derivatives (Options & Futures) contains substantial risk and is not for every investor. An investor could potentially lose all or more than his/her initial investment.
Only risk capital should be used for trading and only those with sufficient risk capital should consider trading derivatives. Past performance is not
necessarily indicative of future results. Testimonials appearing on this website may not be representative of other clients or customers
and are not a guarantee of future performance or success.
|
| (c) 1998-2025, Hamzei Analytics, LLC.® All Rights Reserved. |
|
|