|
Tuesday, July 30, 2019, 2300ET
Market Timing Charts, Analysis & Commentary for Issue #300
Timer Charts of S&P-500 Cash Index (SPX) + NASDAQ-100 Cash Index (NDX)
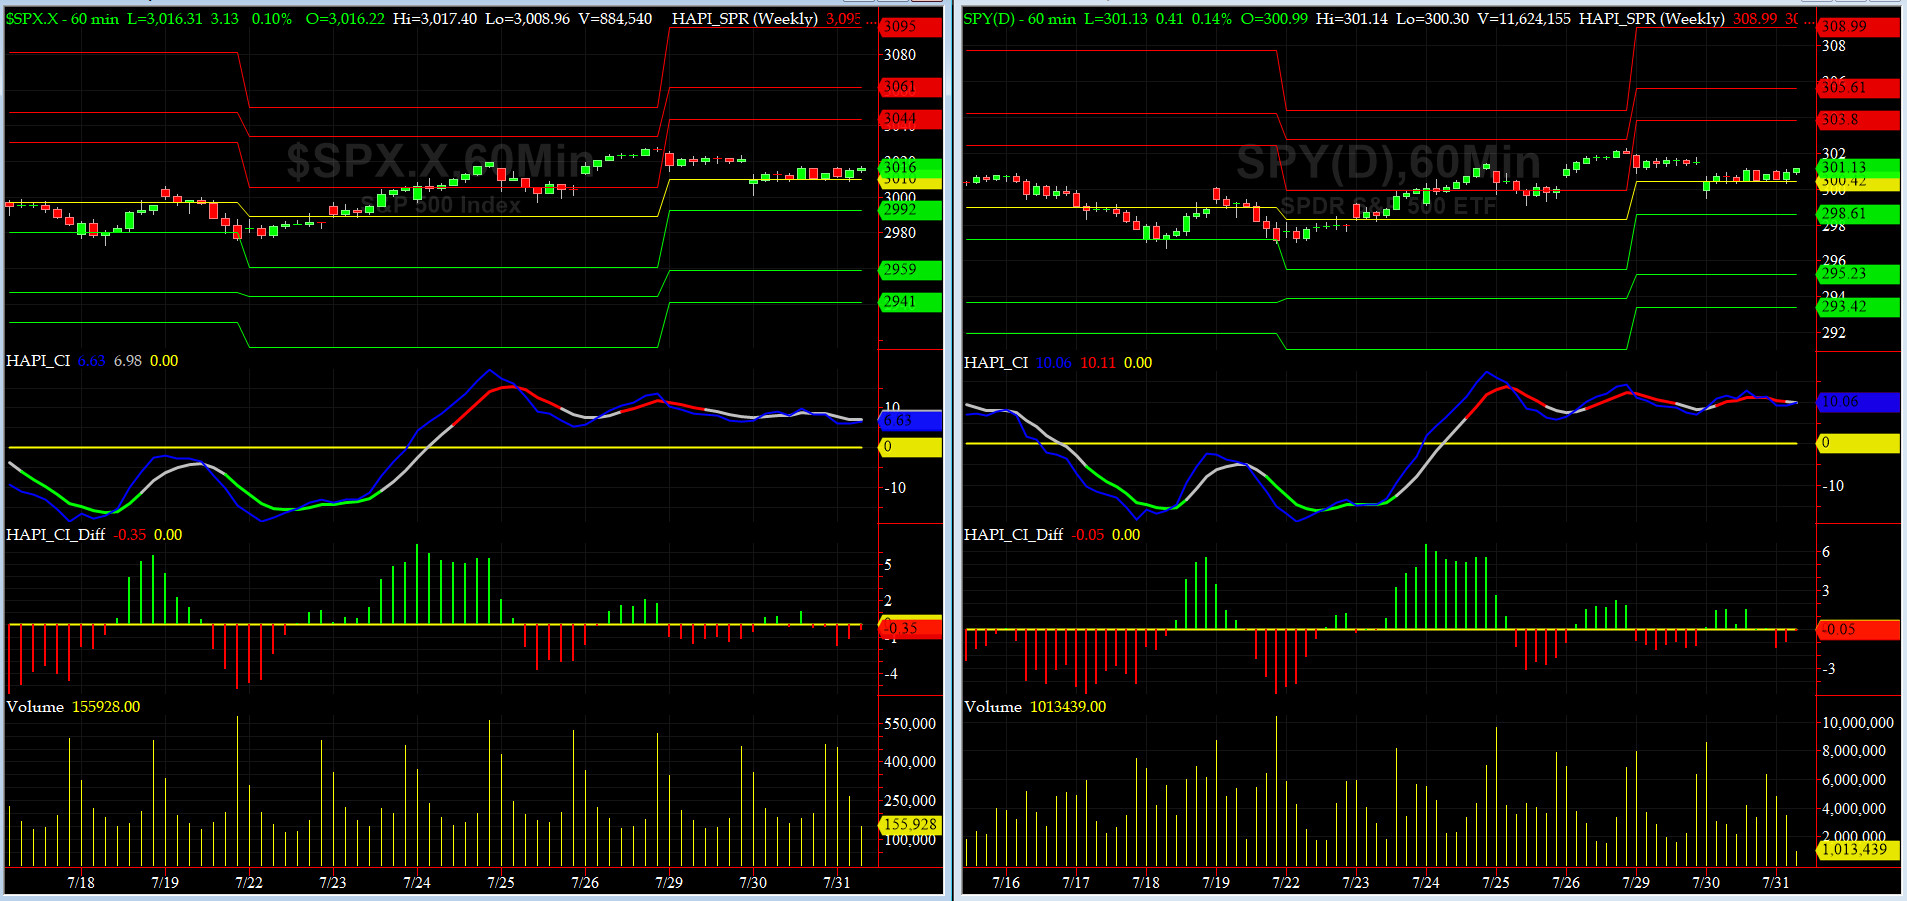
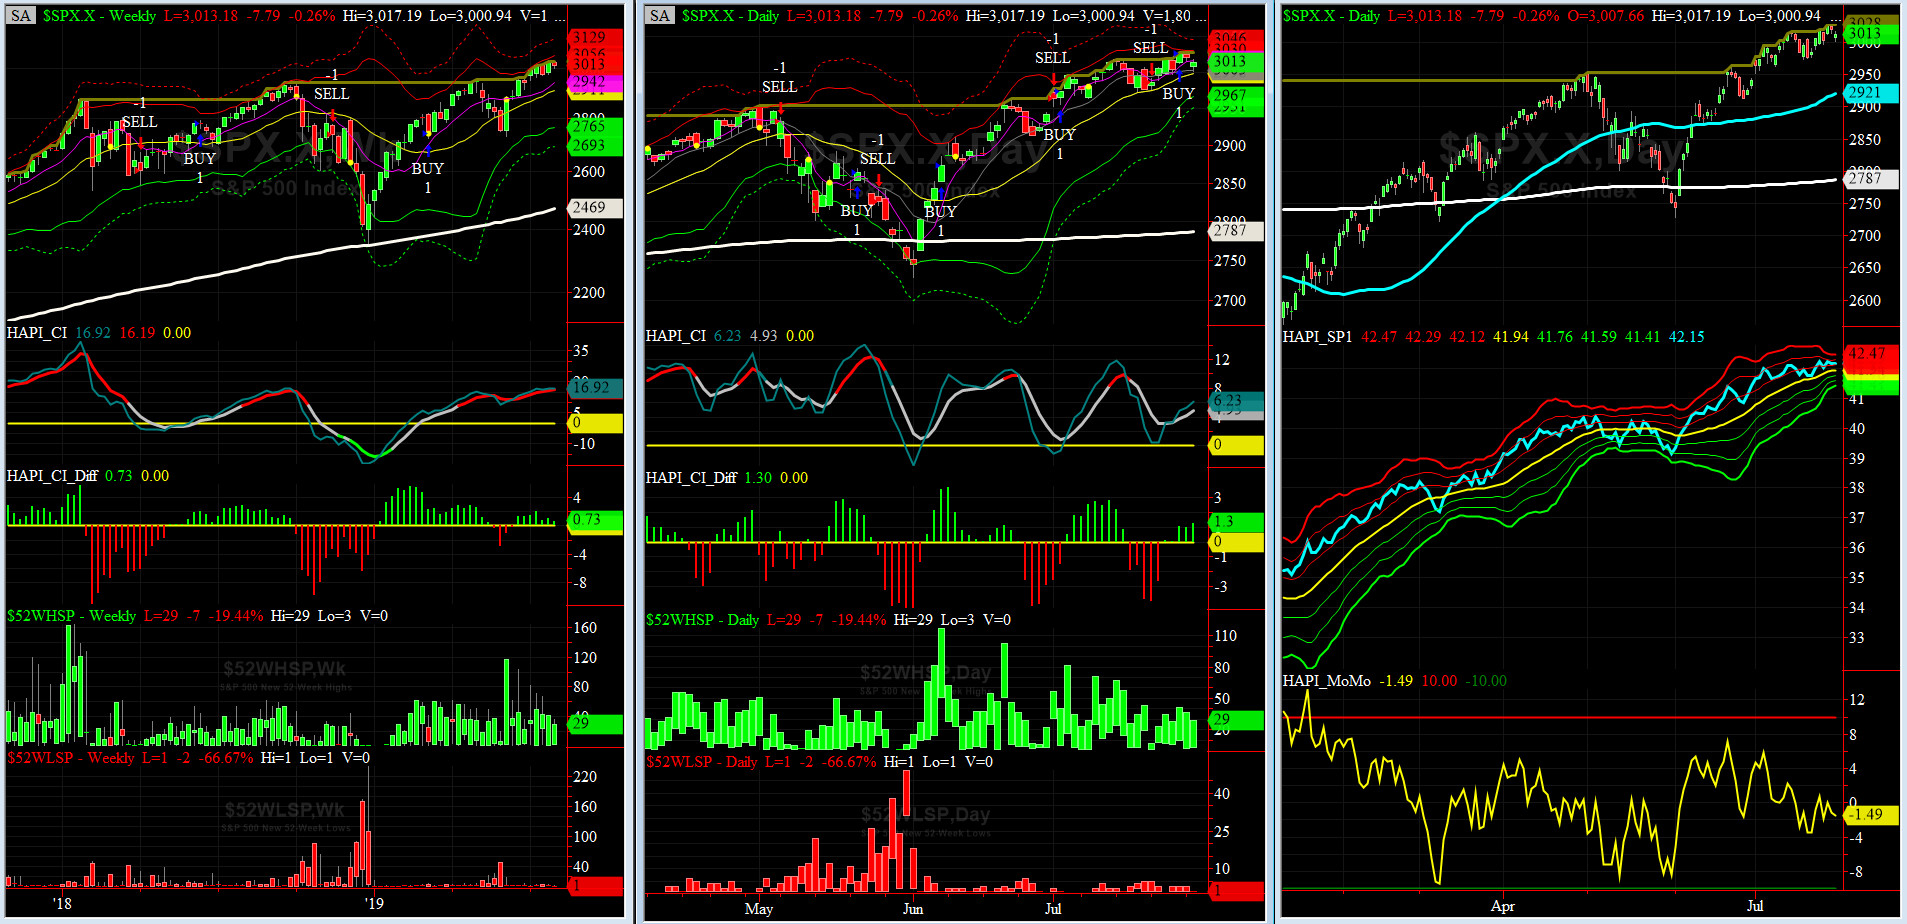
Most recent S&P-500 Cash Index (SPX) Close: 3013 down -1 (down -0%) for the two weeks and two days ending on Tuesday, July 30, 2019, which closed near its +1 sigma.
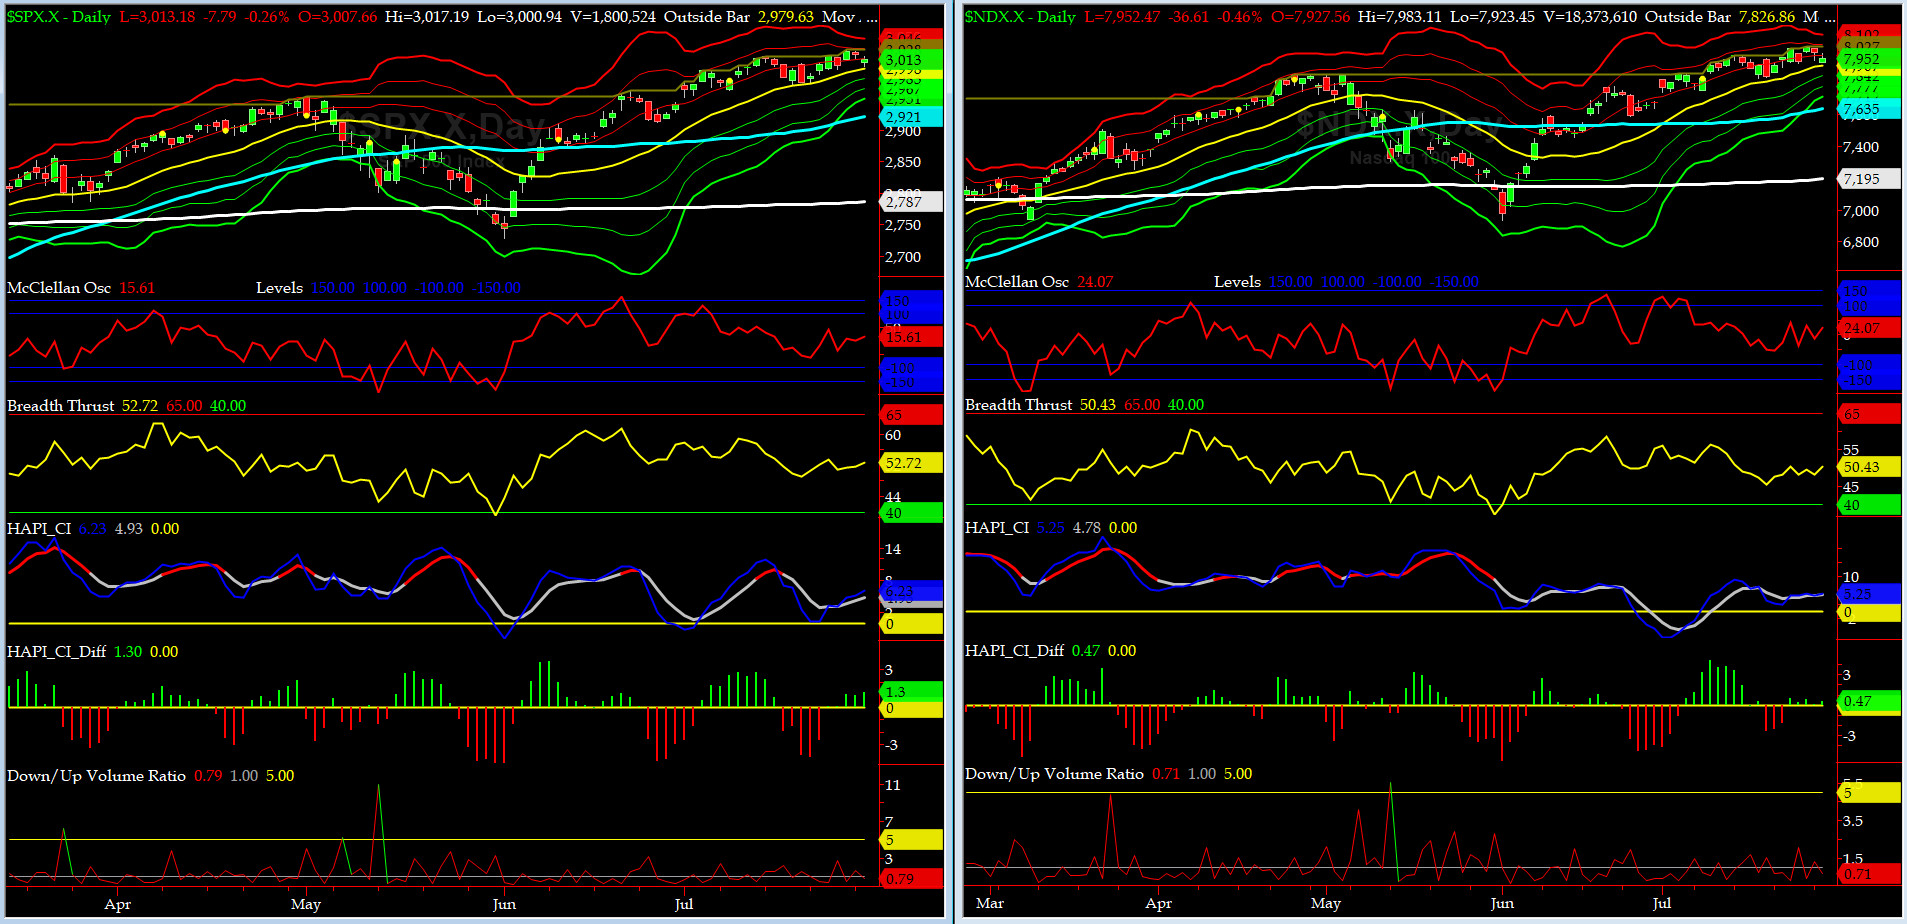
DJIA ALL TIME INTRADAY HIGH = 27398 (reached on Tuesday, July 16, 2019)
DJT ALL TIME INTRADAY HIGH = 11623 (reached on Friday, September 14, 2018)
SPX ALL TIME INTRADAY HIGH = 3028 (reached on Friday, July 26, 2019)
NDX ALL TIME INTRADAY HIGH = 8027 (reached on Friday, July 26, 2019)
RUT ALL TIME INTRADAY HIGH = 1742 (reached on Friday, August 31, 2018)
Current DAILY +2 Sigma SPX = 3030 with WEEKLY +2 Sigma = 3056
Current DAILY 0 Sigma SPX = 2998 with WEEKLY 0 Sigma = 2911
Current DAILY -2 Sigma SPX = 2967 with WEEKLY -2 Sigma = 2765
NYSE McClellan Oscillator = +15 (-150 is start of the O/S area; around -275 to -300 area or lower, we go into the �launch-pad� mode; over +150, we are in O/B area)
NYSE Breadth Thrust = 52.7 (40 is considered as oversold and 65 as overbought)
Busy Earnings Season brought market participants plenty of joy as US Markets rallied to new ATHs. Now we have a FOMC Meeting tomorrow and July NFP on Friday.
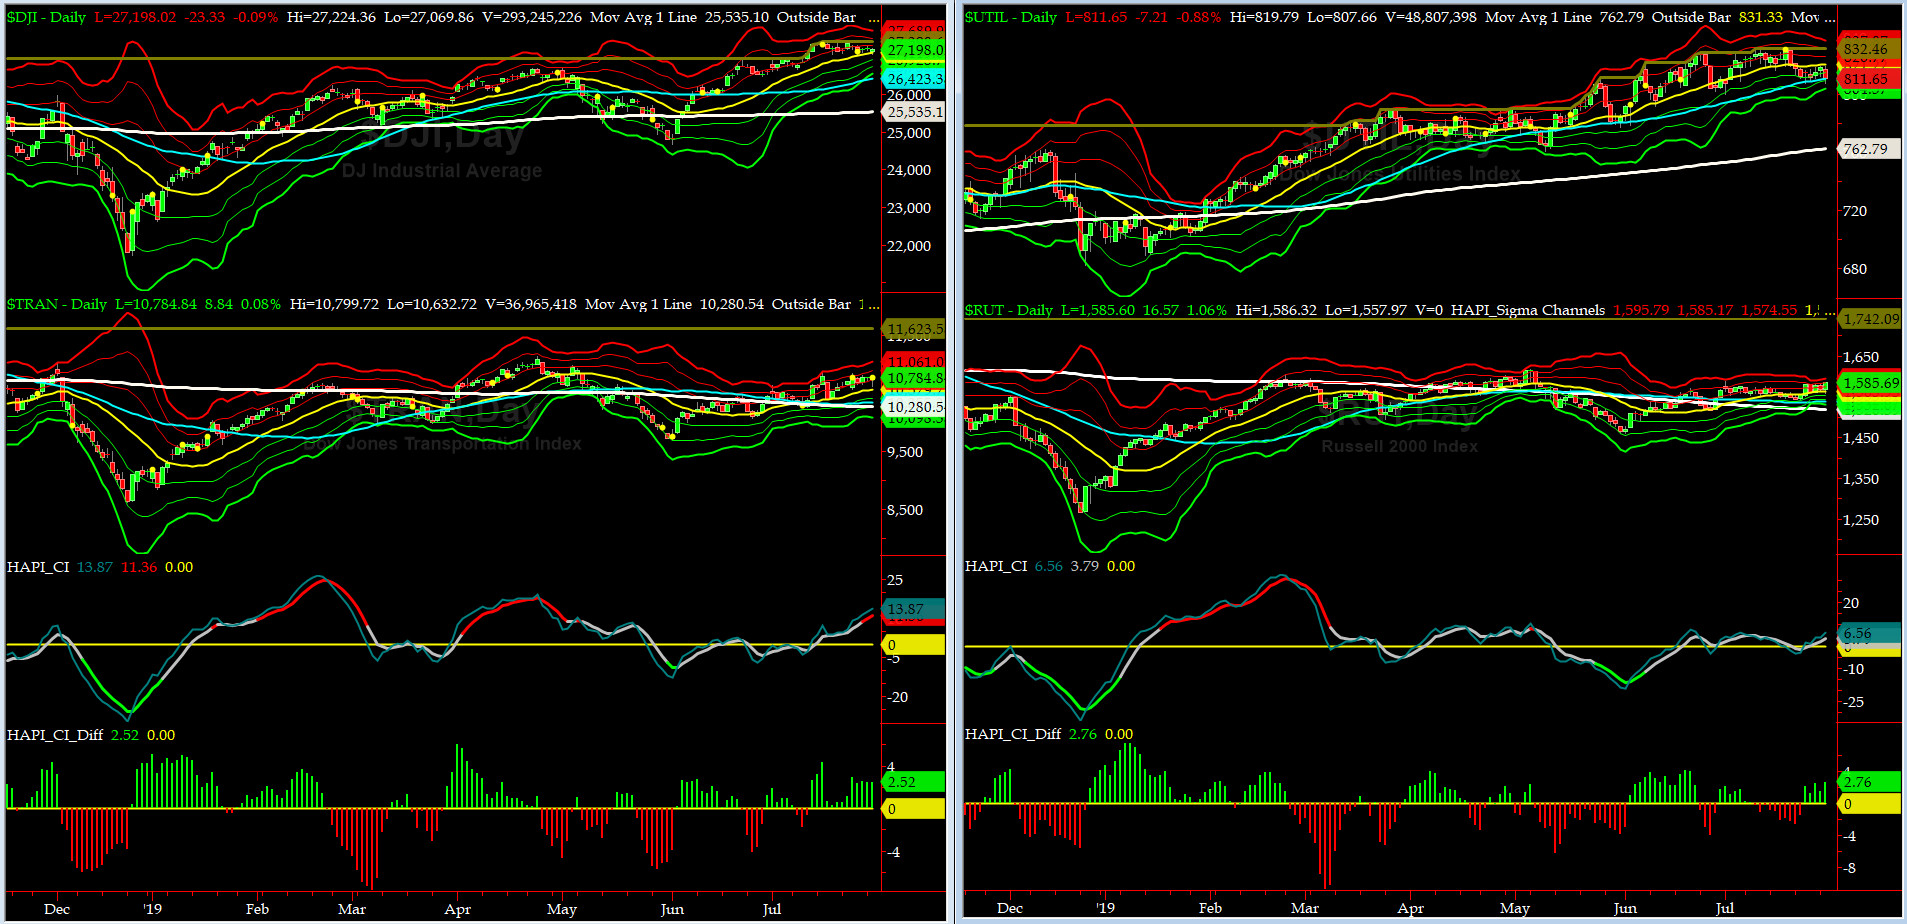
Canaries [in the Coal Mine] Chart for DJ TRAN & RUT Indices
200-Day MA DJ TRAN = 10,280 or 4.9% BELOW DJ TRAN (max observed in last 7 yrs = 20.2%, min = -20.3%)
200-Day MA RUT = 1520 or 4.3% BELOW RUT (max observed in last 7 yrs = 21.3%, min = -22.6%)
DJ Transportation Index (proxy for economic conditions 6 to 9 months hence) has made great strides to deliver us a channel breakout. We are close but not there yet.
Russell 2000 Small Caps Index (proxy for Risk ON/OFF) did a tad better and we are about to witness a channel breakout. RISK ON is still not there yet.
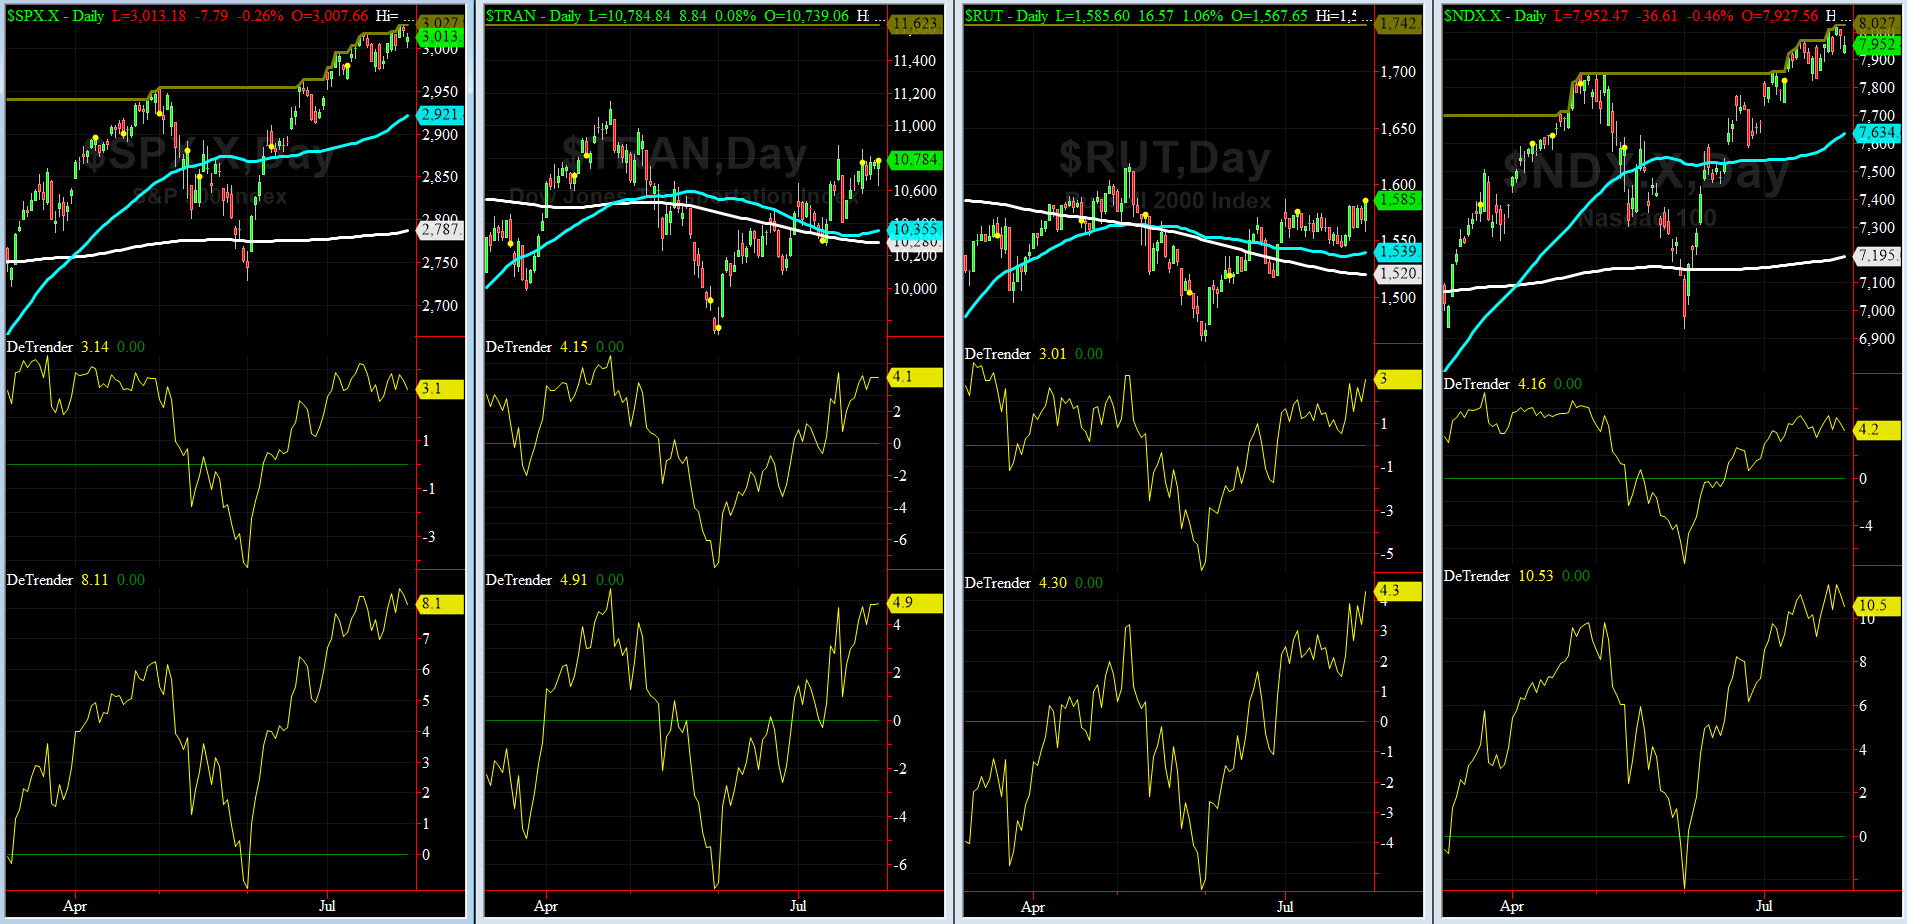
DeTrenders Charts for SPX, NDX, TRAN & RUT Indices
50-Day MA SPX = 2921 or 3.1% BELOW SPX (max observed in last 7 yrs = +8.6%, min = -9.3%)
200-Day MA SPX = 2787 or 8.1% BELOW SPX (max observed in last 7 yrs = 15.2%, min = -14%)
ALL of our EIGHT DeTrenders are in the POSITIVE territory. The DeTrenders for DJ Tran & RUT will continue to be harbingers of future price behavior in broad indices.
HA_SP1_Momo Chart
WEEKLY Timing Model = on a BUY Signal since Friday, March 8, 2019 CLOSE at 2743
DAILY Timing Model = on a BUY Signal since Friday, July 26, 2019 CLOSE at 3026
Max SPX 52wk-highs reading last week = 36 (over 120-140, the local maxima is in)
Max SPX 52wk-Lows reading last week = 3 (over 40-60, the local minima is in)
HA_SP1 closed near its +1 sigma channels
HA_Momo = -1.5 (reversals most likely occur above +10 or below -10)
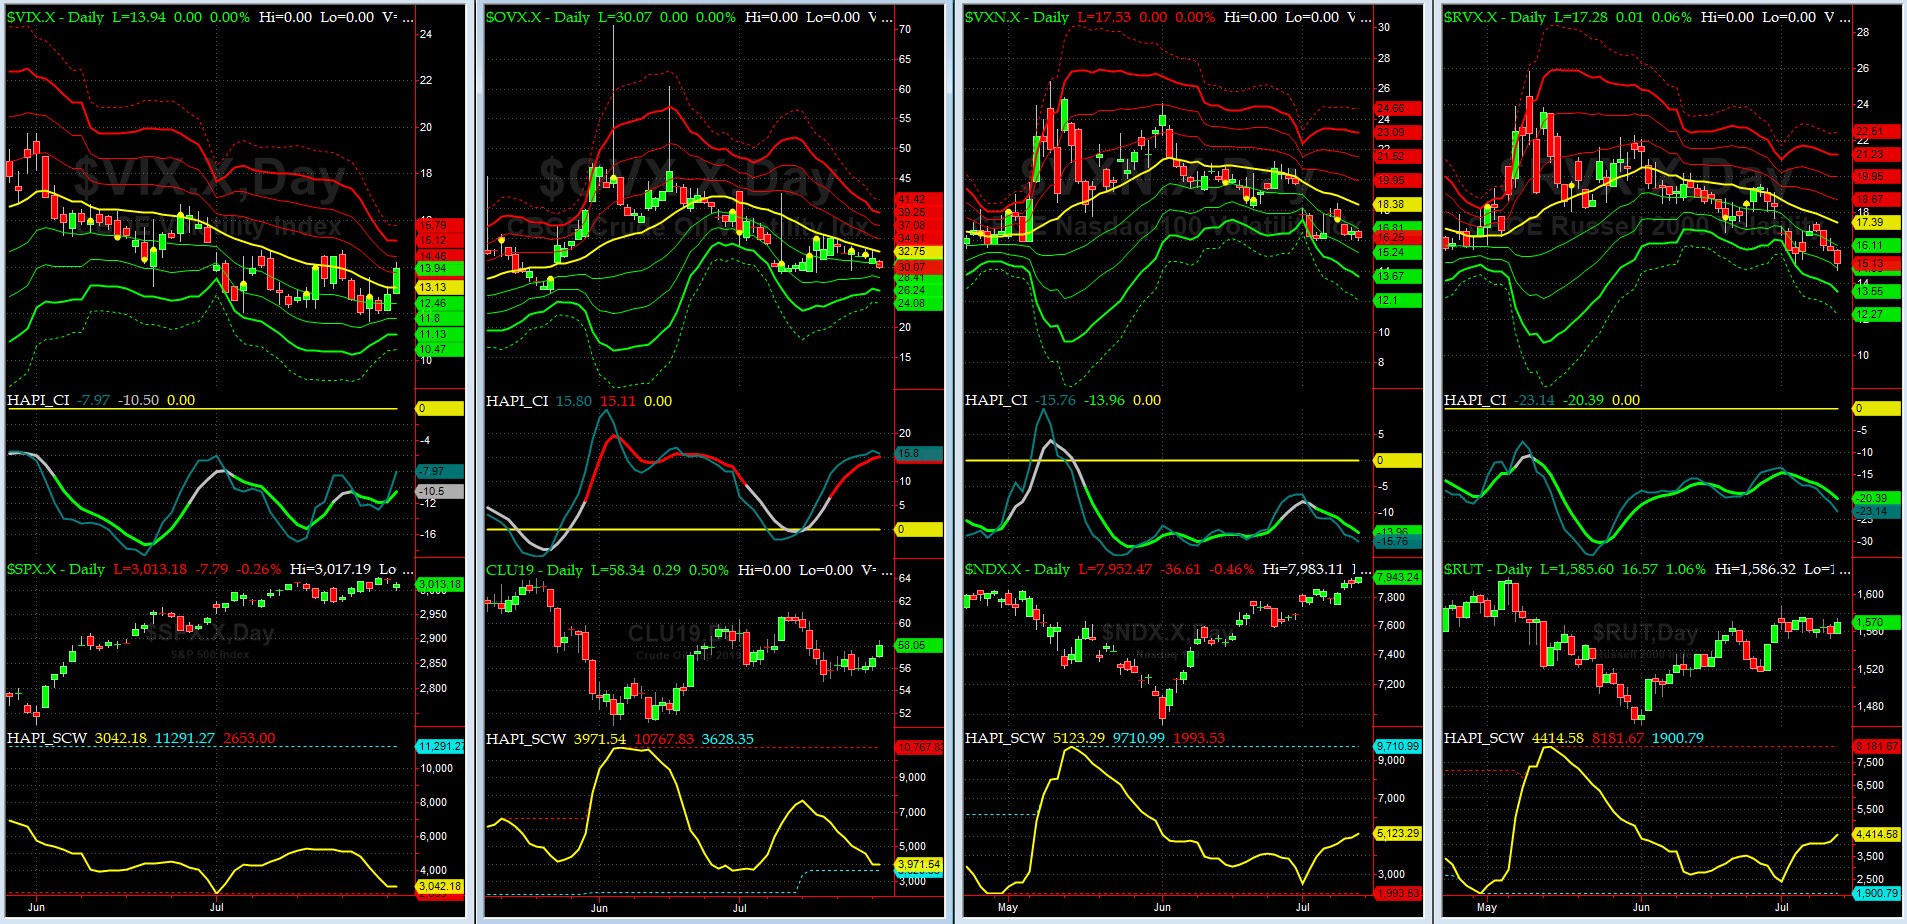
Vol of the Vols Chart
Spot VIX stood at 13.94 Friday night, at about its +1 sigma (remember it's the VIX volatility pattern aka "its sigma channels" that matters, and not the level of VIX itself (this is per Dr. Robert Whaley, a great mentor and inventor of original VIX, now called VXO). VIX usually peaks around a test of its +4 sigma).
Vols have been drifting down but it popped today over its center line (zero sigma). Is this a beginning of another shockwave? Our beloved @Capt_Tiko does not think so.
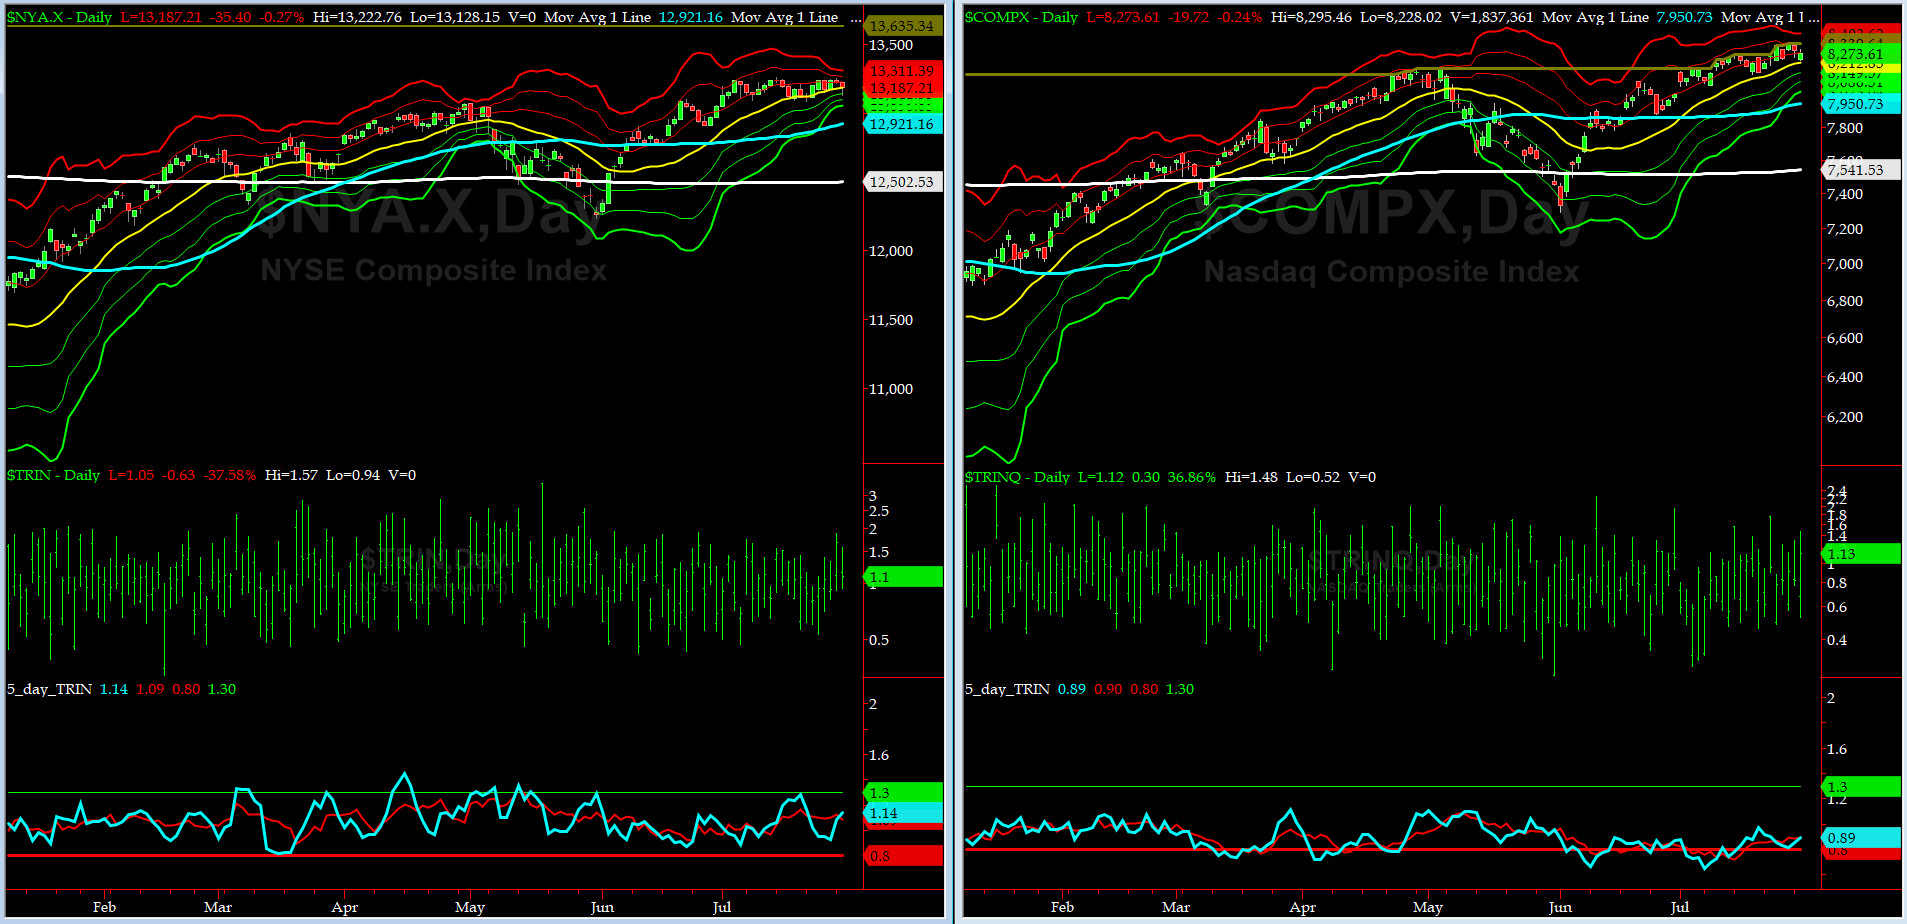
5-day TRIN & TRINQ Charts
Both NYSE 5-day TRIN & NASDAQ 5-day TRINQ are in NEUTRAL zone.
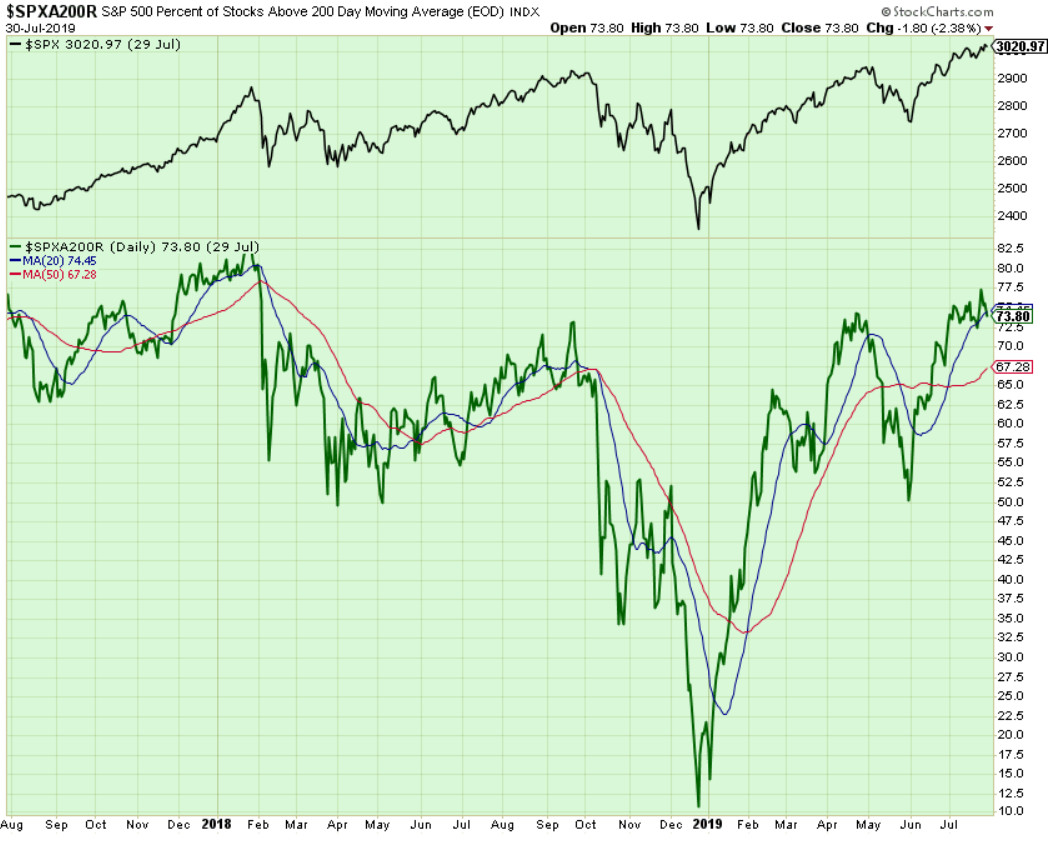
Components of SPX above their respective 200-day MA Chart
This scoring indicator stayed at about 74%, not confirming most recent highs (which is normally the case with this indicator).
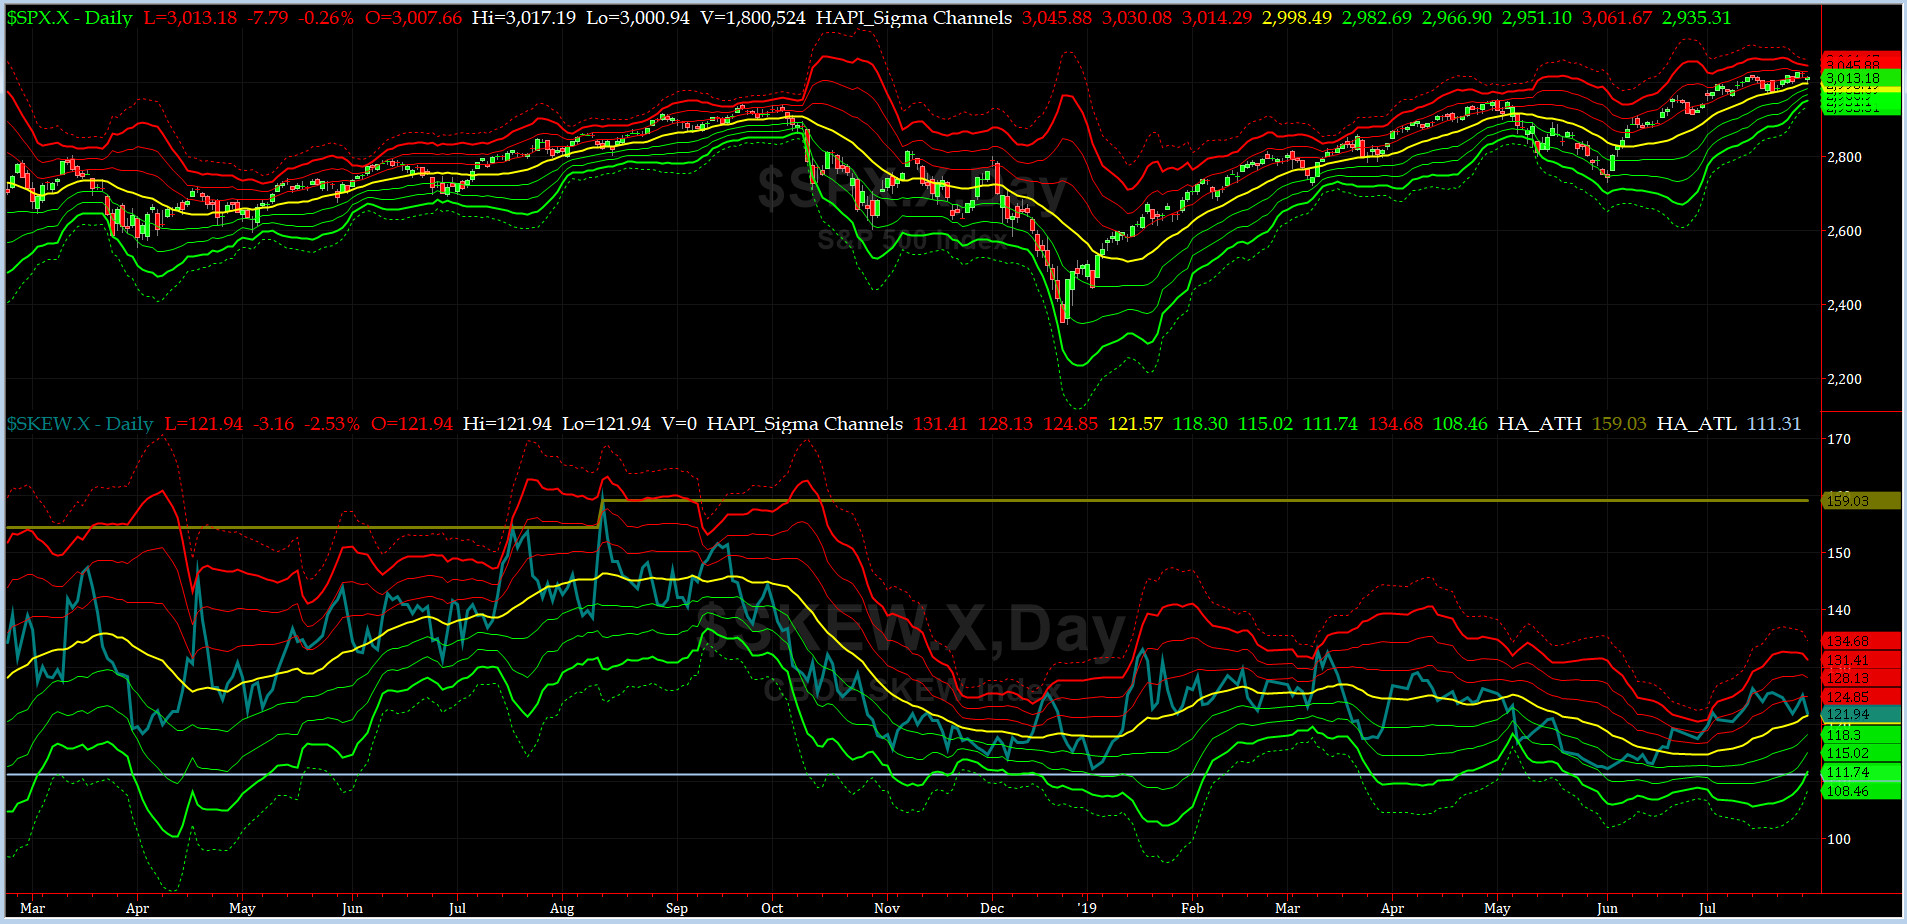
SPX SKEW (Tail Risk) Chart
On Friday, SPX SKEW (Tail Risk) rose pretty sharply to 121.9, now about its zero sigma (normal = 115, range 100-150).
All quiet on the Eastern & Mid-Western Fronts? HRH Capt. Tiko, KCPE, expects some rock 'n roll in late summer.
How to interpret the value of SPX SKEW? (from CBOE white paper on SKEW)

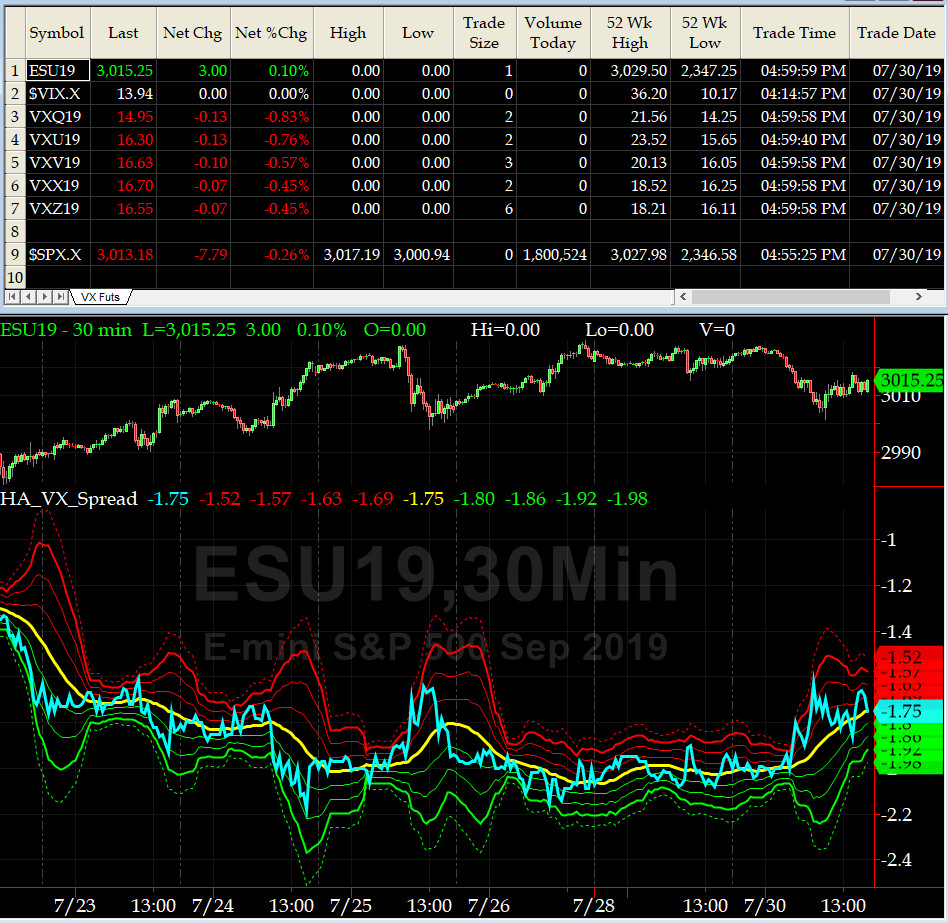
3-month VIX Futures Spread(VX) Chart
This popular timing indicator for identifying tradable bottoms, (now long AUG19, & short NOV19 VIX Futures) hit -1.75 on Tuesday Close. That is a NEUTRAL signal.
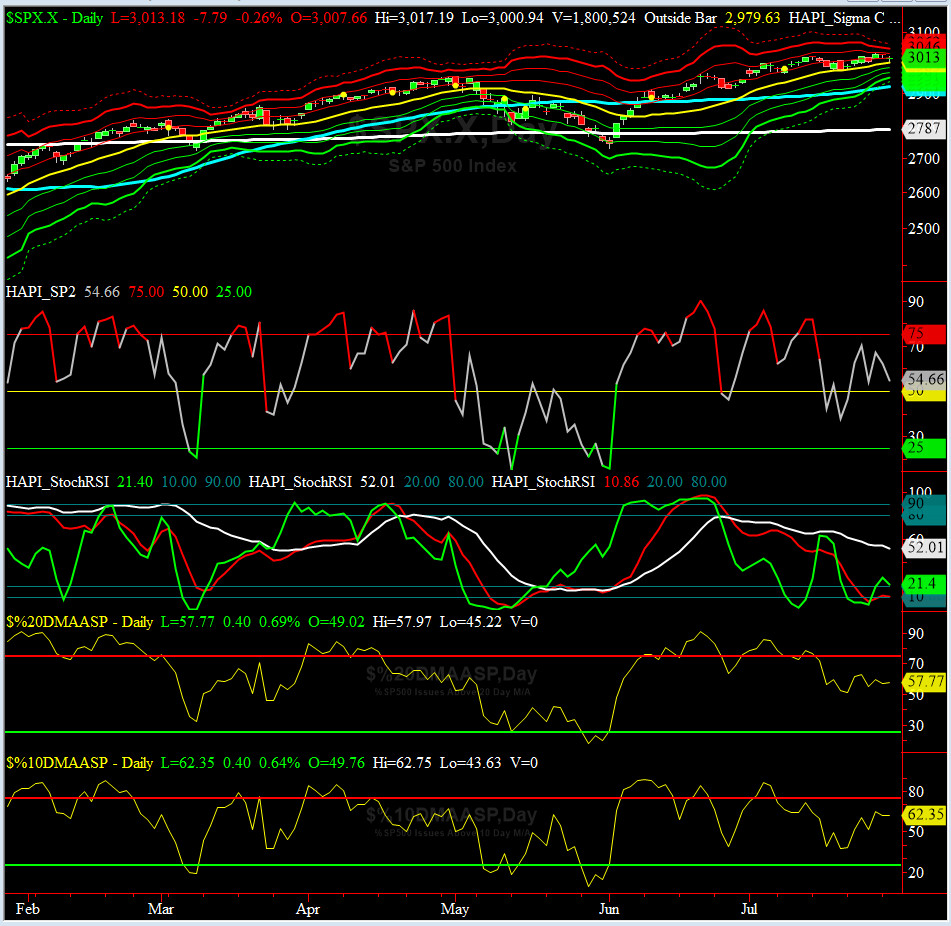
HA_SP2 Chart
HA_SP2 = 54.6 (Buy signal <= 25, Sell Signal >= 75)
We should see this indicator retest 75 area soon, per HRH @Capt_Tiko, KCPE.
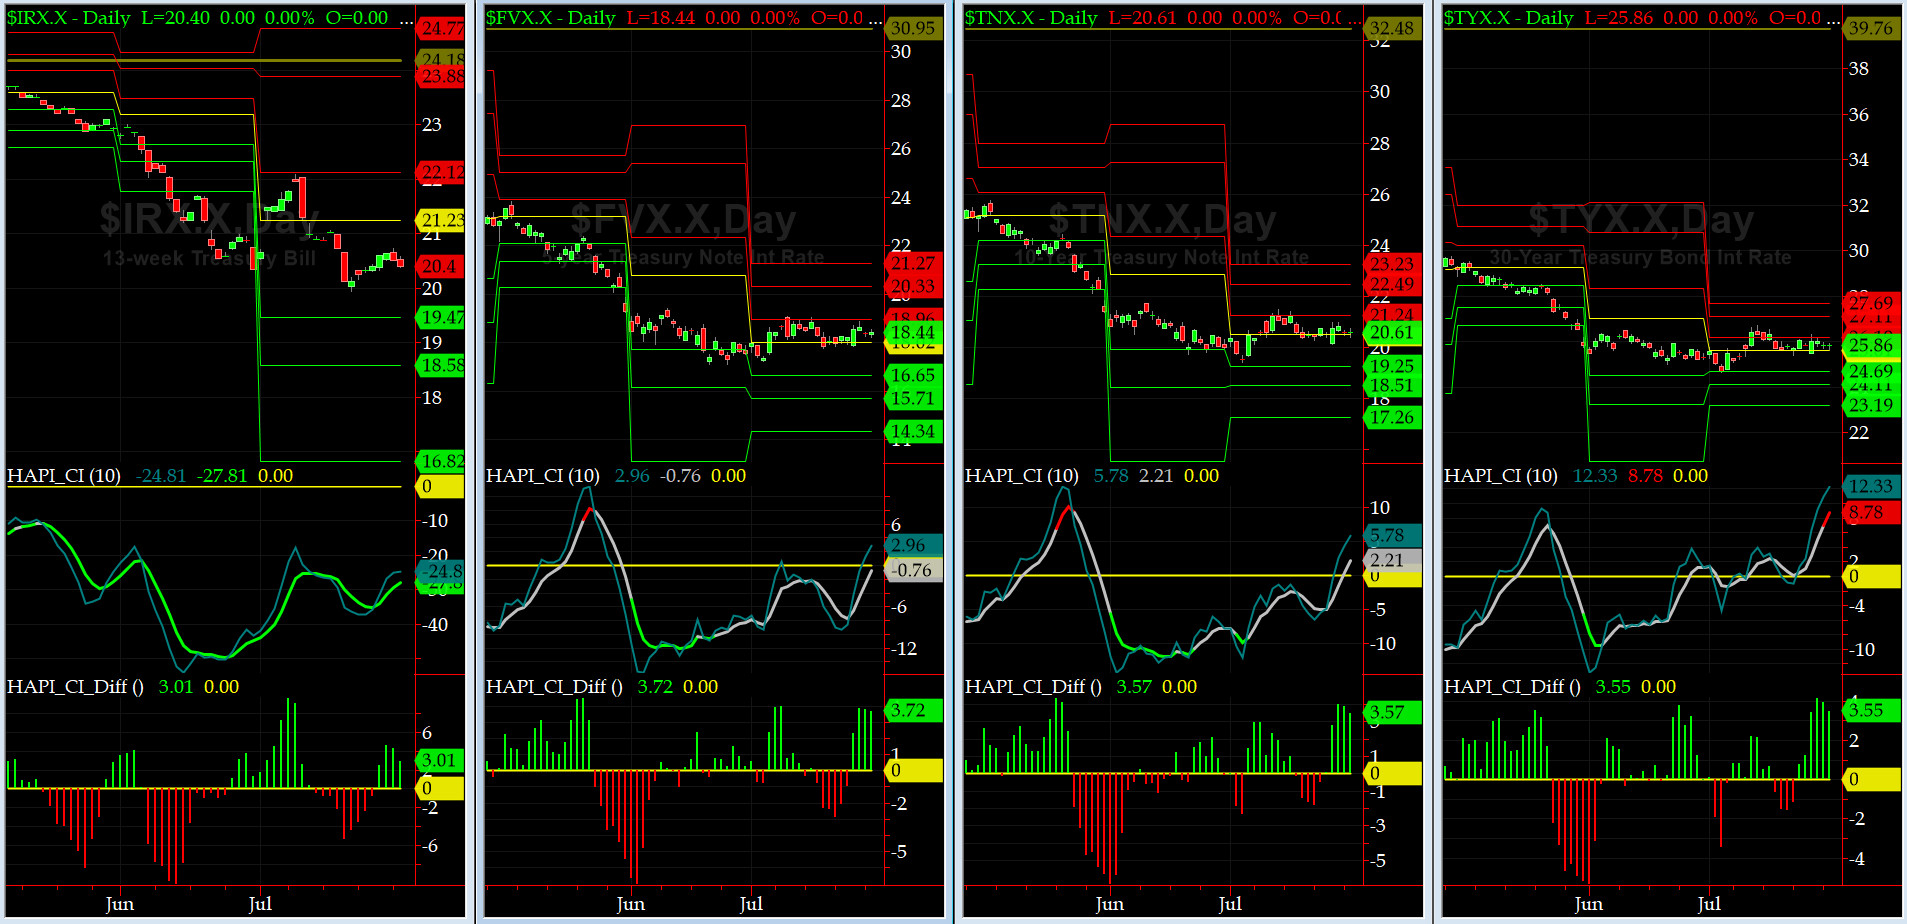
US Treasury T-Notes & T-Bonds Yields Chart
Last two weeks we saw sideways action throughout the Yield Curve ahead of July FOMC Meeting which ends tomorrow at 1400ET.
Fari Hamzei
|


 Proactive Market Timing