|
Wednesday, September 17, 2019, 0830ET
Market Timing Charts, Analysis & Commentary for Issue #306
Timer Charts of S&P-500 Cash Index (SPX) + NASDAQ-100 Cash Index (NDX)
Most recent S&P-500 Cash Index (SPX) Close: 2978 up +131 (up +4.6%) for the 7 trading days ending on Teusday, September 17, 2019, which closed at its +1 sigma.
DJIA ALL TIME INTRADAY HIGH = 27398 (reached on Tuesday, July 16, 2019)
DJT ALL TIME INTRADAY HIGH = 11623 (reached on Friday, September 14, 2018)
SPX ALL TIME INTRADAY HIGH = 3028 (reached on Friday, July 26, 2019)
NDX ALL TIME INTRADAY HIGH = 8027 (reached on Friday, July 26, 2019)
RUT ALL TIME INTRADAY HIGH = 1742 (reached on Friday, August 31, 2018)
Current DAILY +2 Sigma SPX = 3043 with WEEKLY +2 Sigma = 3065
Current DAILY 0 Sigma SPX = 2943 with WEEKLY 0 Sigma = 2924
Current DAILY -2 Sigma SPX = 2843 with WEEKLY -2 Sigma = 2783
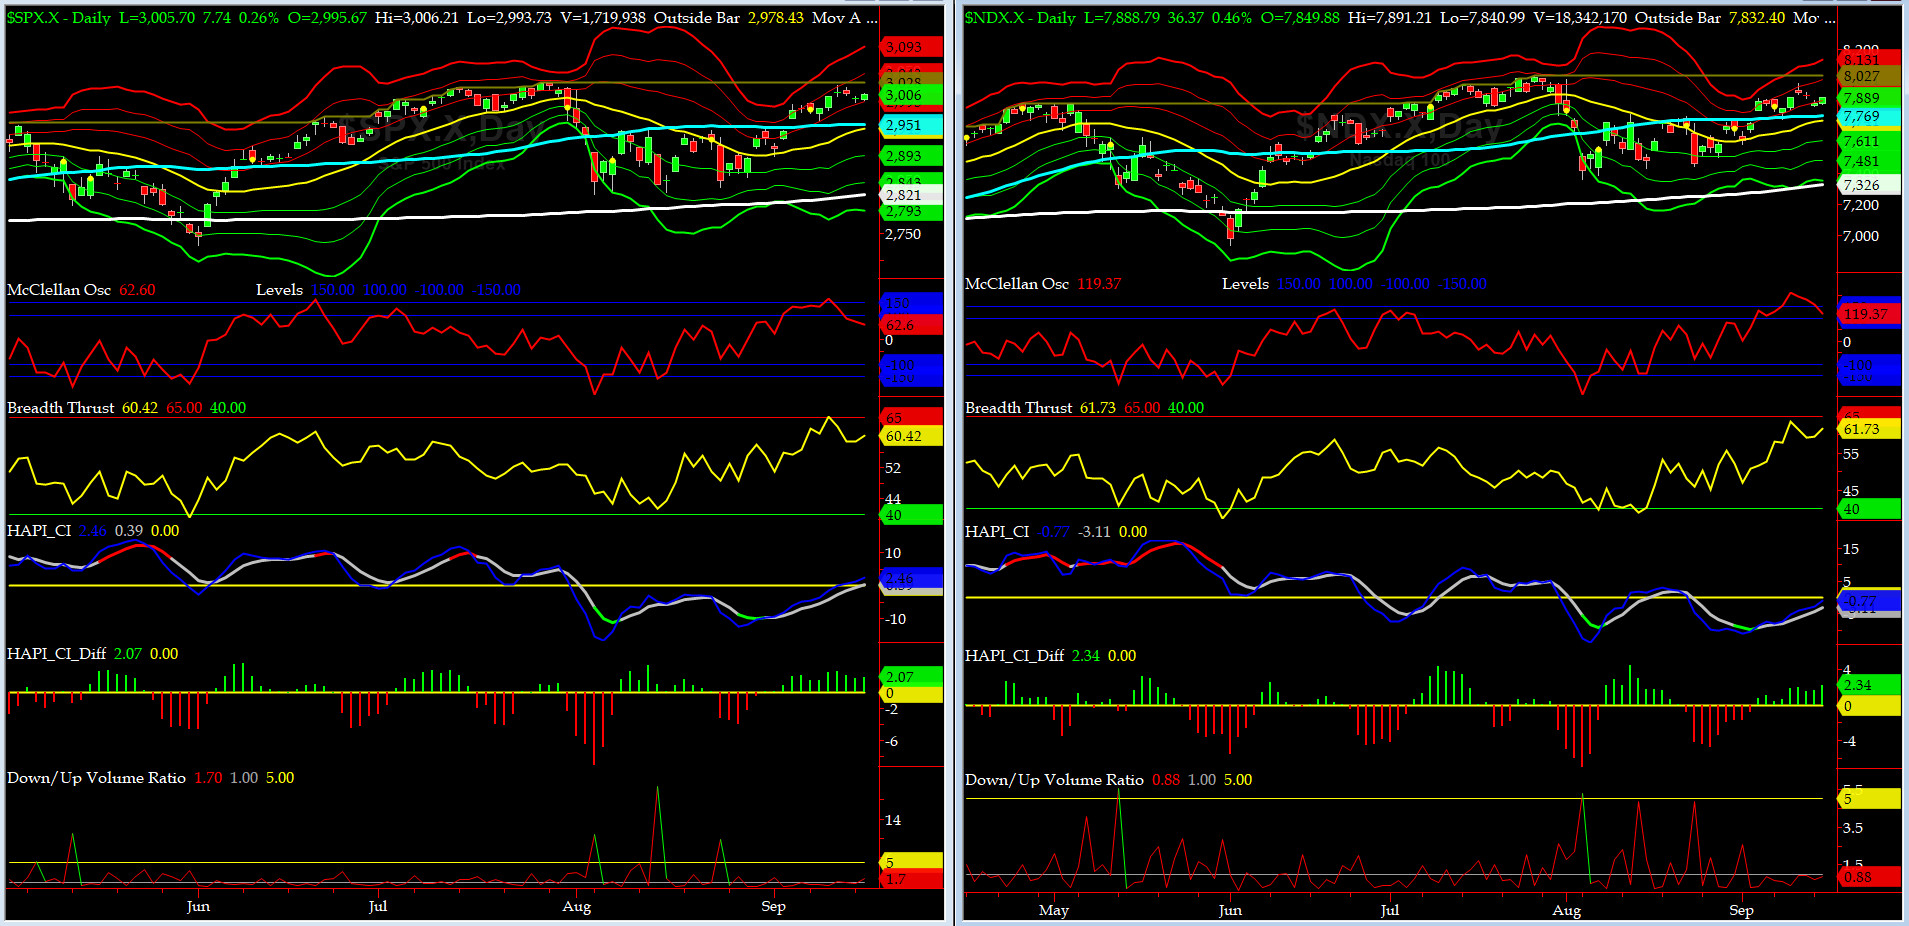
NYSE McClellan Oscillator = +62.5 (-150 is start of the O/S area; around -275 to -300 area or lower, we go into the �launch-pad� mode; over +150, we are in O/B area)
NYSE Breadth Thrust = 60.4 (40 is considered as oversold and 65 as overbought)
Oil markets stabilized after Saudi's ARAMCO managed to ease fears of their potential down time following over the weekend precision and concurrent attacks. Most blame Iran. Overnight, we are hearing that PM Bibi may have orchestrated that right before the general elections over there. But that's just another unsubstantiated rumor.
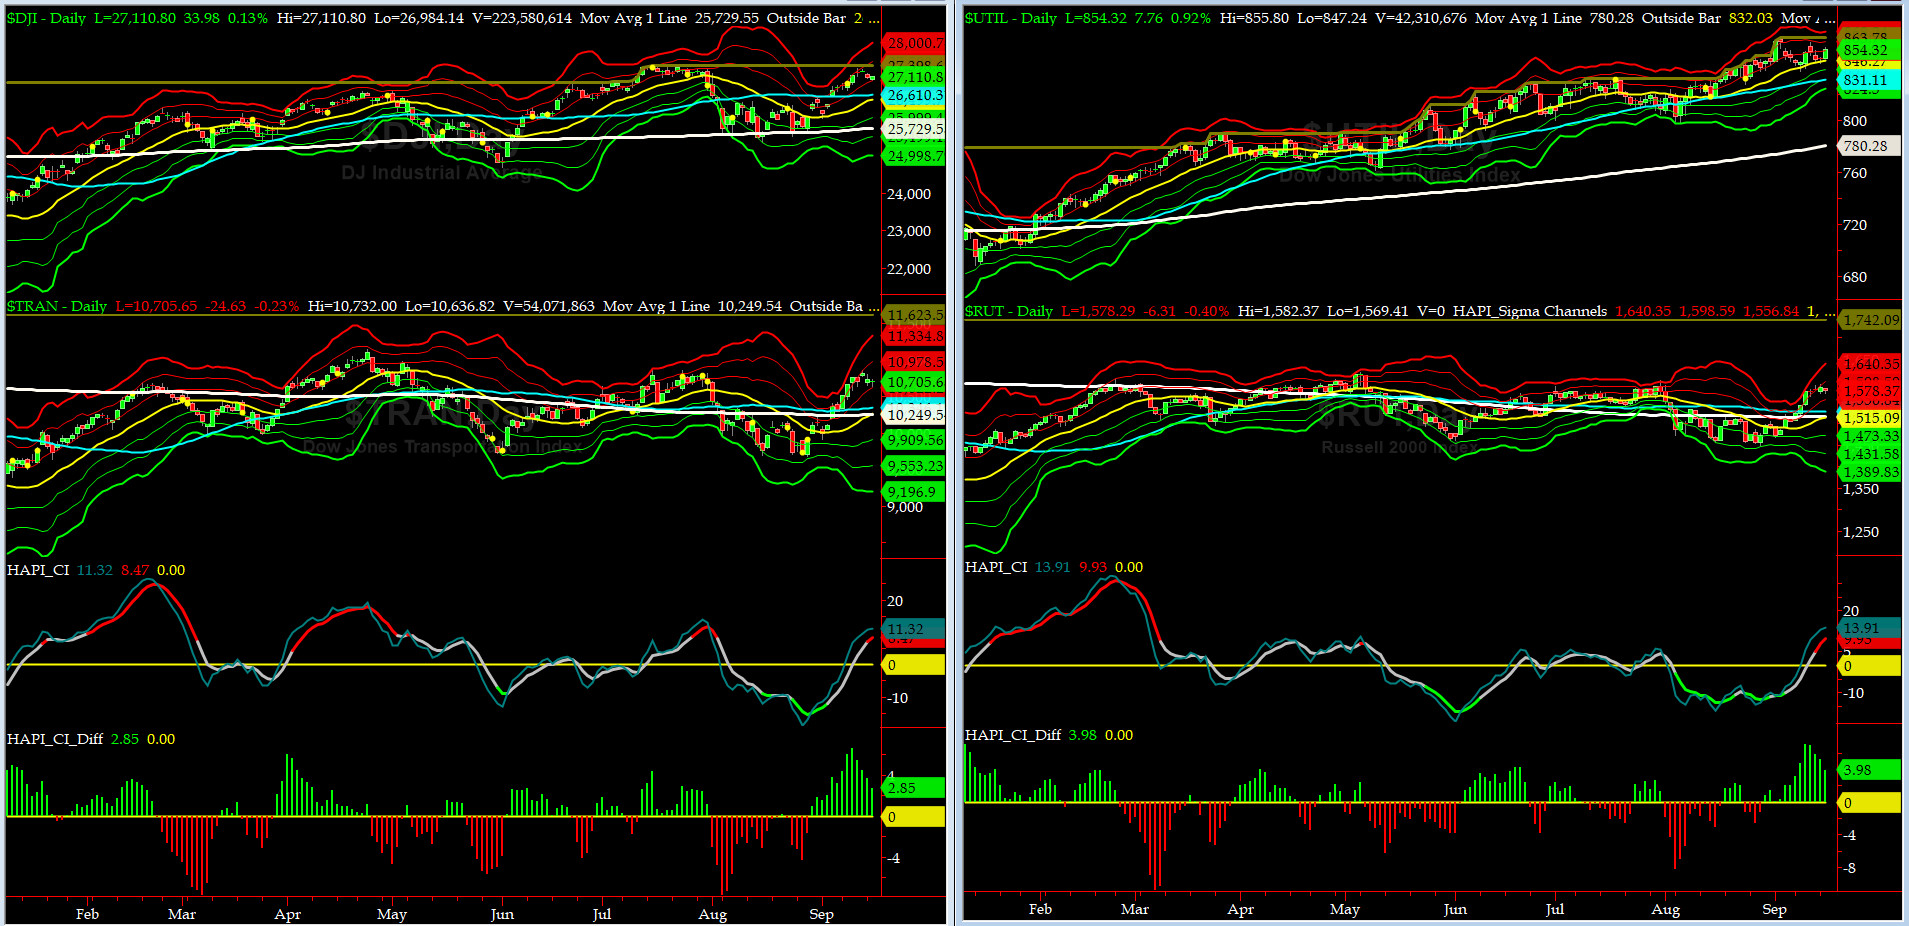
Canaries [in the Coal Mine] Chart for DJ TRAN & RUT Indices
200-Day MA DJ TRAN = 10,249 or 4.5% BELOW DJ TRAN (max observed in last 7 yrs = 20.2%, min = -20.3%)
200-Day MA RUT = 1517 or 4% BELOW RUT (max observed in last 7 yrs = 21.3%, min = -22.6%)
DJ Transportation Index (proxy for economic conditions 6 to 9 months hence) had a great week but pulled back after the Saudi Oil fields were attacked.
Russell 2000 Small Caps Index (proxy for Risk ON/OFF) ditto here and RISK is slowing coming back in.
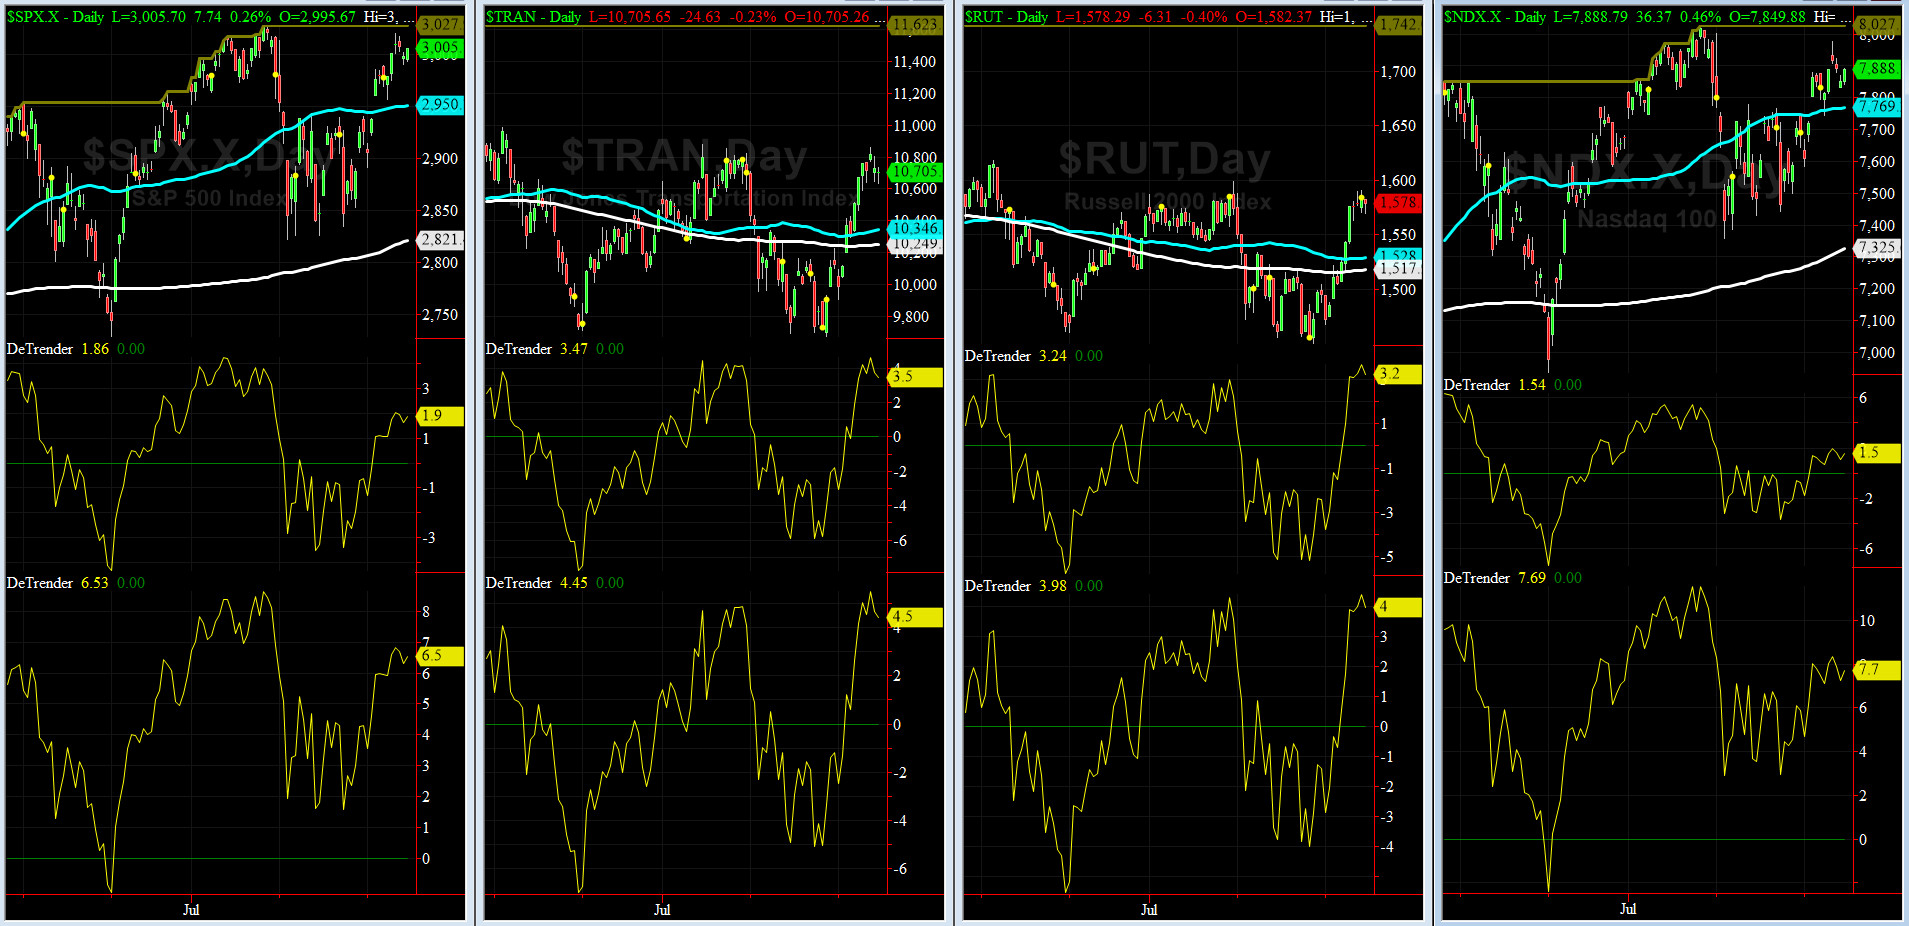
DeTrenders Charts for SPX, NDX, TRAN & RUT Indices
50-Day MA SPX = 2950 or 1.9% BELOW SPX (max observed in last 7 yrs = +8.6%, min = -9.3%)
200-Day MA SPX = 2821 or 6.5% BELOW SPX (max observed in last 7 yrs = 15.2%, min = -14%)
ALL of our EIGHT DeTrenders are in the POSITIVE territory. The DeTrenders for DJ Tran & RUT will continue to be harbingers of future price behavior in broad indices.
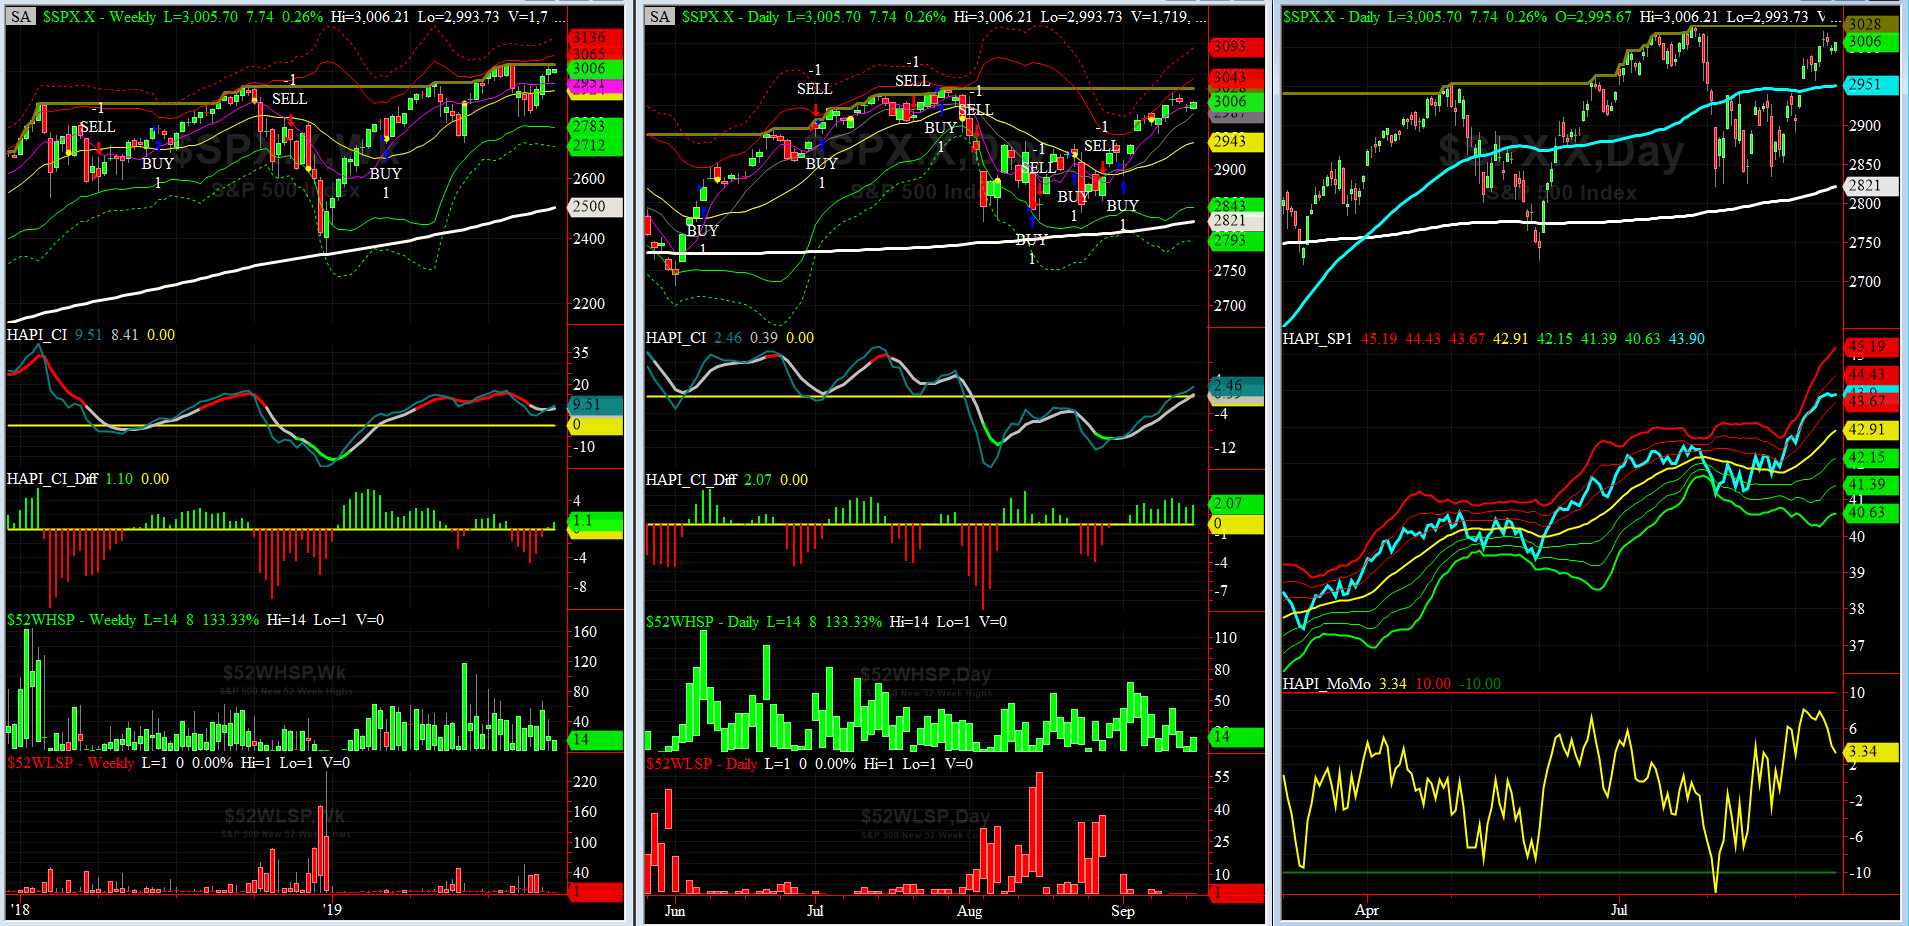
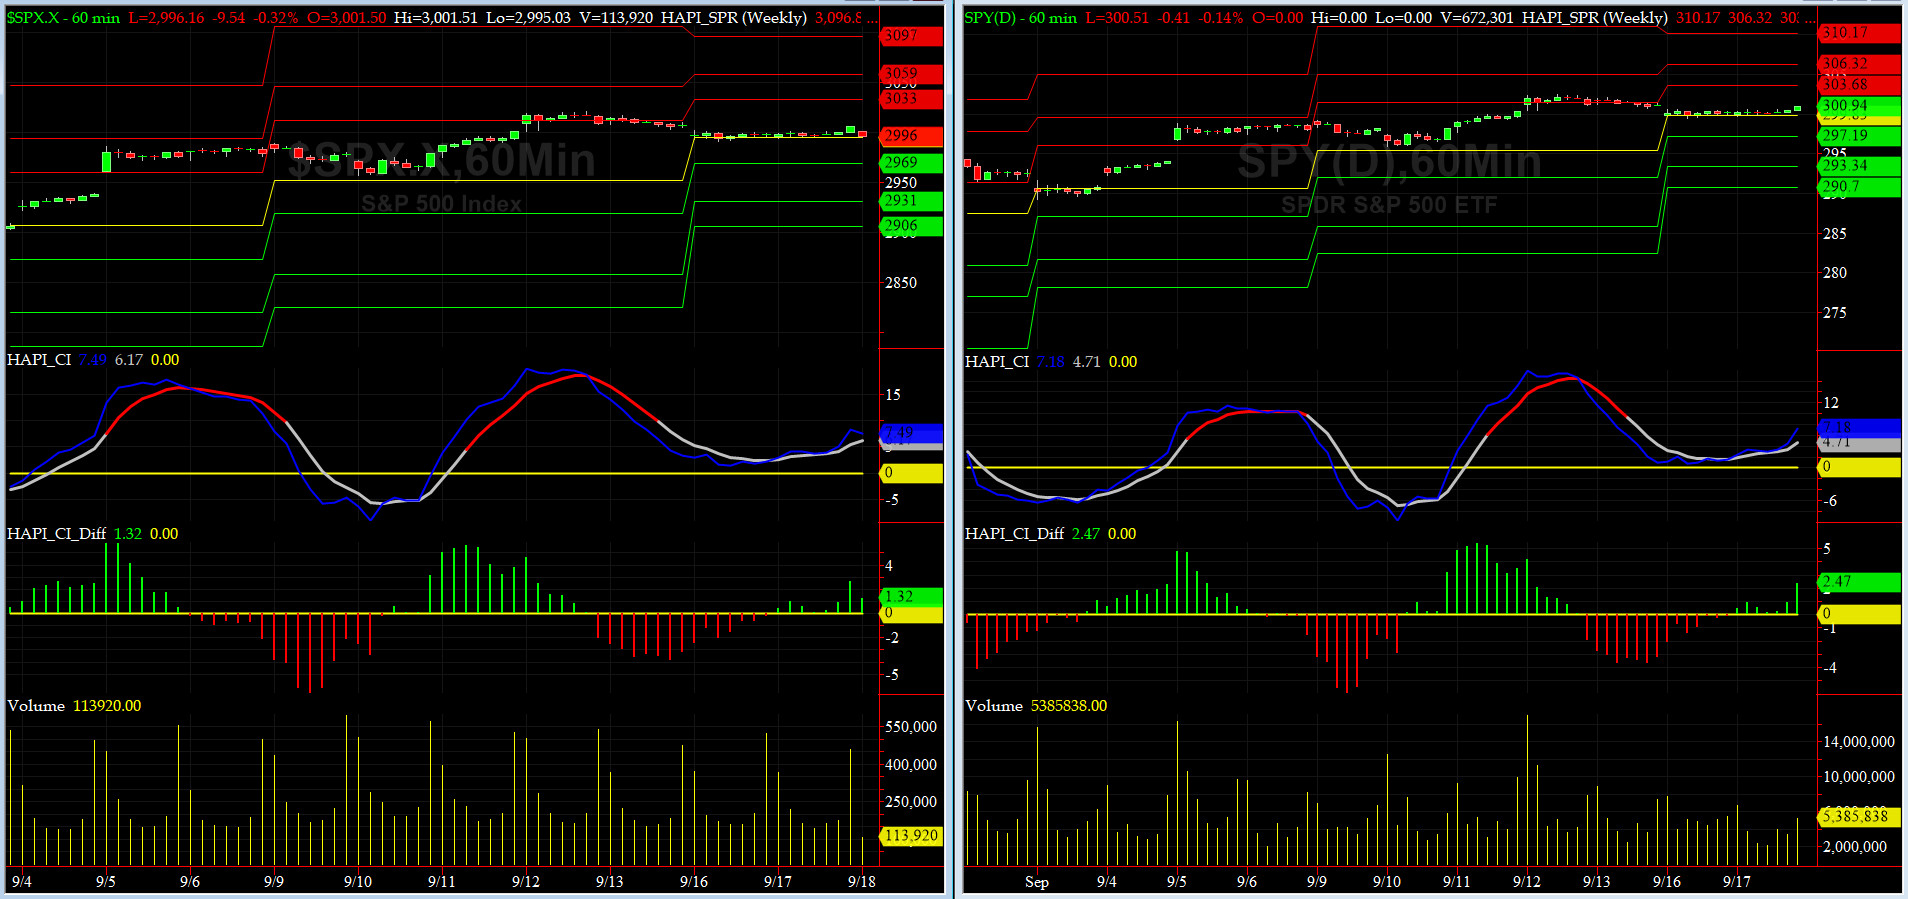
HA_SP1_Momo Chart
WEEKLY Timing Model = on a BUY Signal since Friday, March 8, 2019 CLOSE at 2743
DAILY Timing Model = on a BUY Signal since Tuesday, September 3, 2019 CLOSE at 2906
Max SPX 52wk-highs reading last week = 42 (over 120-140, the local maxima is in)
Max SPX 52wk-Lows reading last week = 10 (over 40-60, the local minima is in)
HA_SP1 closed near its +1.5 sigma channels
HA_Momo = +3.3 (reversals most likely occur above +10 or below -10)
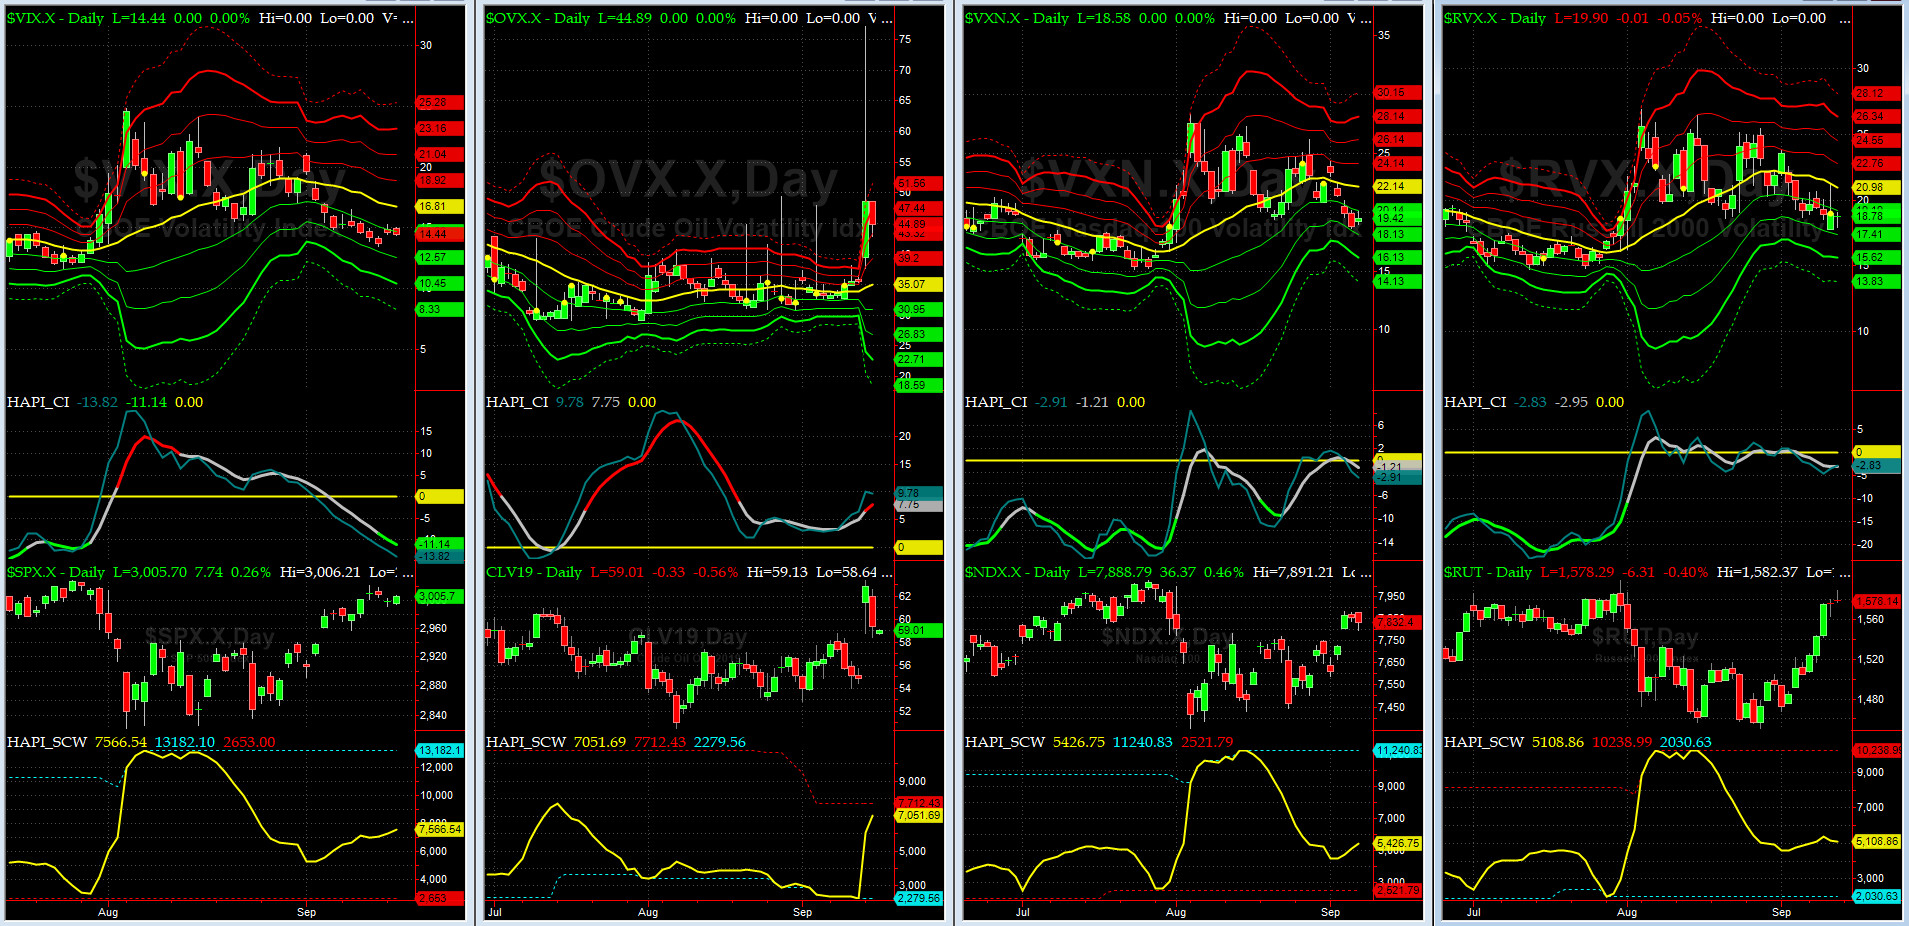
Vol of the Vols Chart
Spot VIX stood at 14.7 on Tuesday night, a tad below its -1 sigma (remember it's the VIX volatility pattern aka "its sigma channels" that matters, and not the level of VIX itself (this is per Dr. Robert Whaley, a great mentor and inventor of original VIX, now called VXO). VIX usually peaks around a test of its +4 sigma).
Massive pull back in VIX following the 150 handle SPX rally.
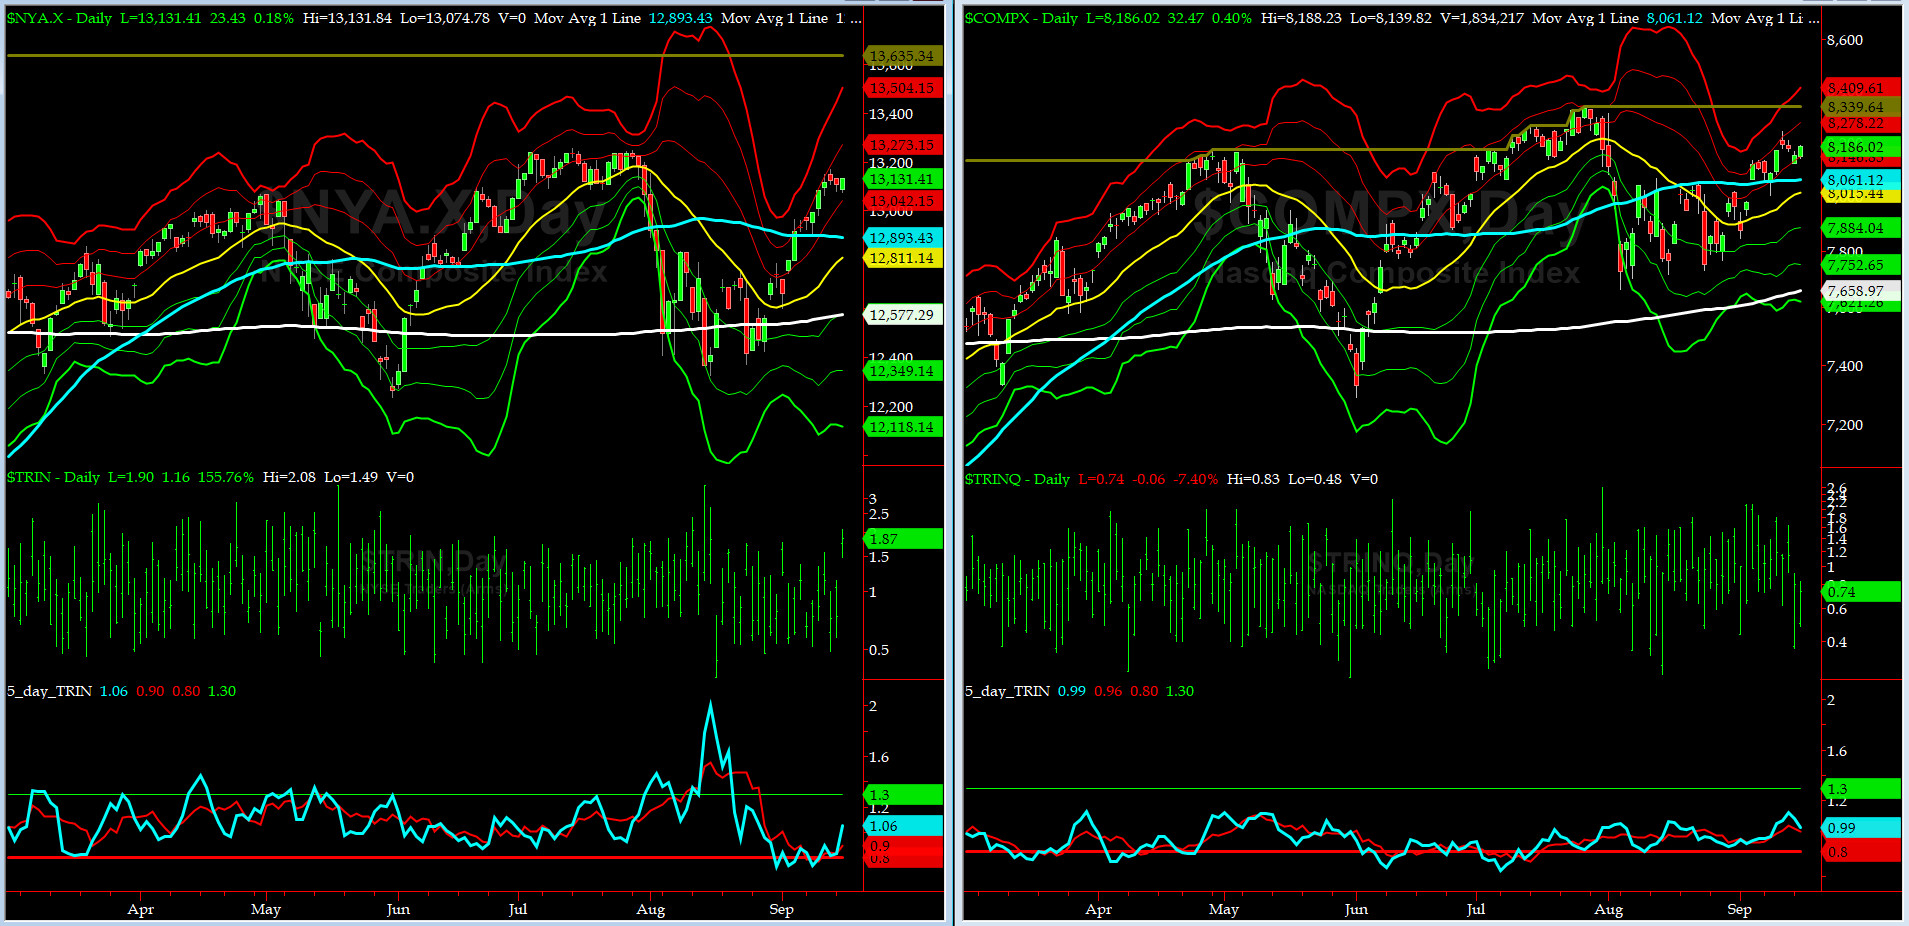
5-day TRIN & TRINQ Charts
NYSE 5-day TRIN is still near a SELL signal while NASDAQ 5-day TRINQ is still in the NEUTRAL zone.
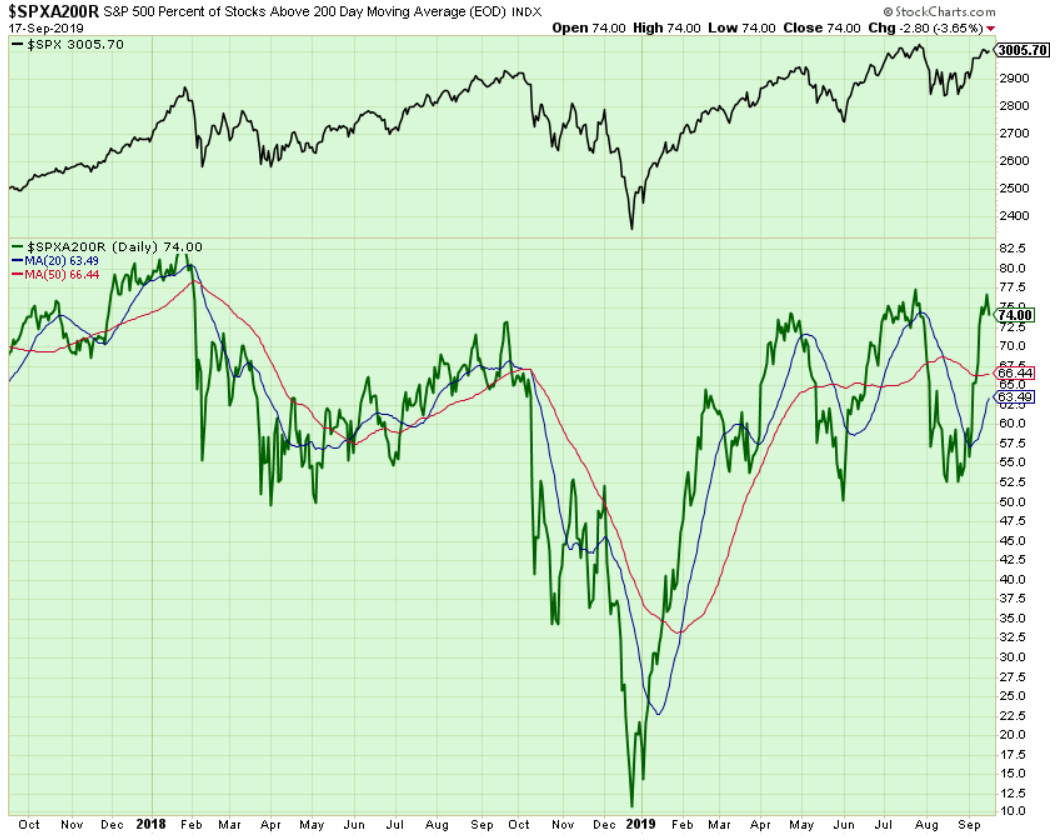
Components of SPX above their respective 200-day MA Chart
This scoring indicator closed on Tuesday at 74% creating a triple-top or some prefer to call it a head-and-shoulder pattern. Will we see 65% or 85% first? Who knows....

SPX SKEW (Downside Tail Risk) Chart
On Friday, SPX SKEW (Downside Tail Risk) rose pretty sharply then eased off to 117.9, now about its +0.5 sigma (normal = 115, range 100-150).
All quiet on the Eastern & Mid-Western Fronts? our beloved HRH Capt. Tiko, KCPE, says YES...
How to interpret the value of SPX SKEW? (from CBOE white paper on SKEW)

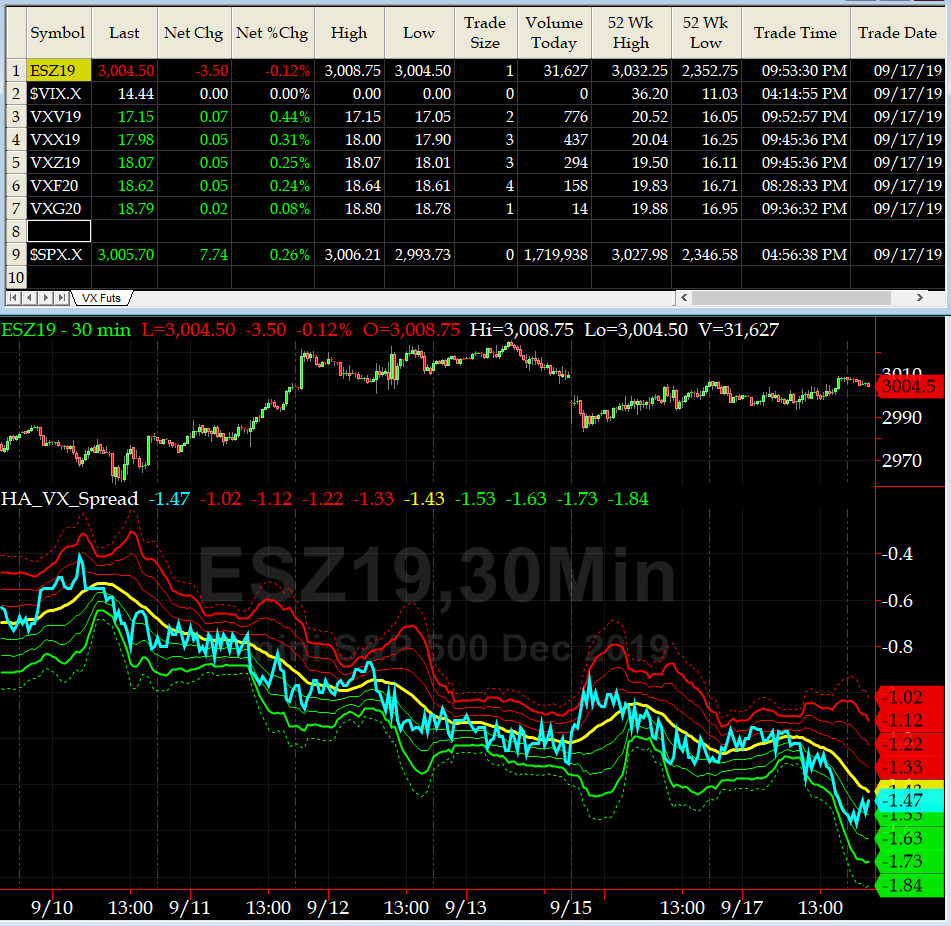
3-month VIX Futures Spread(VX) Chart
This popular timing indicator for identifying tradable bottoms, (now long SEP19, & short DEEZ19 VIX Futures) hit -1.47 on Friday Close. That is a NEUTRAL signal. But remember, with continued Grumpino's erratic behavior, you never know.
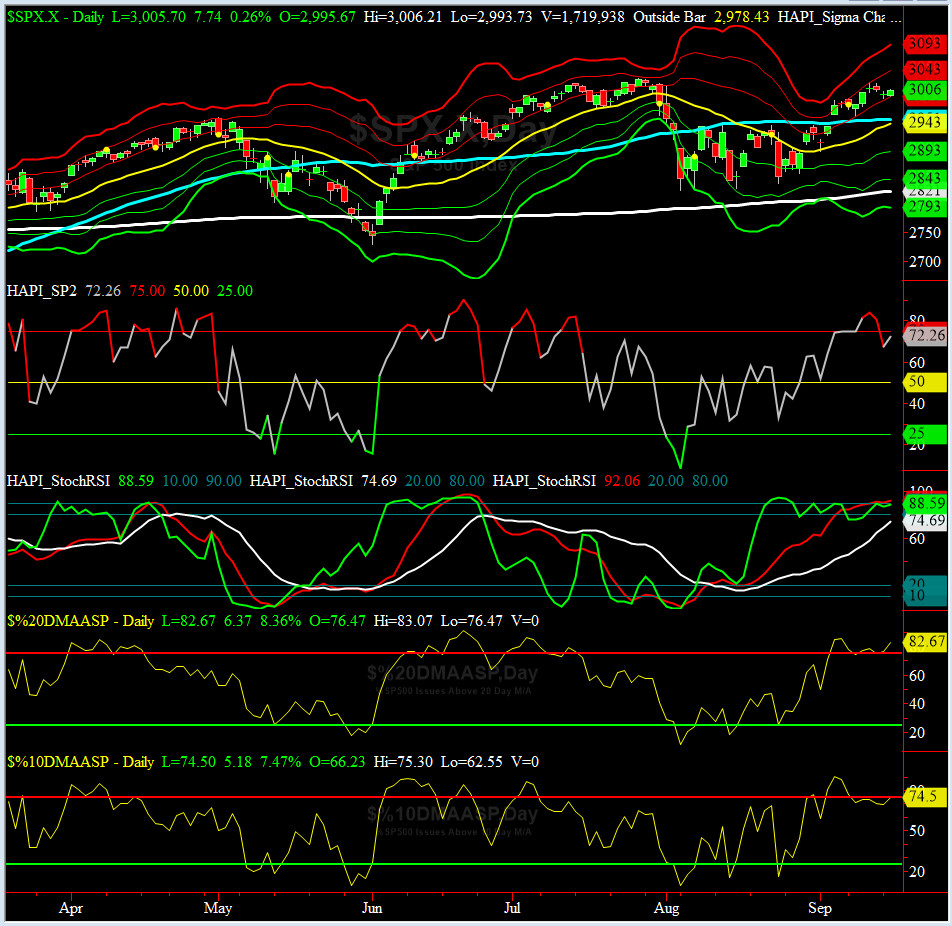
HA_SP2 Chart
HA_SP2 = 72.3 (Buy signal <= 25, Sell Signal >= 75)
Again, we are border-line OverBought reading here.
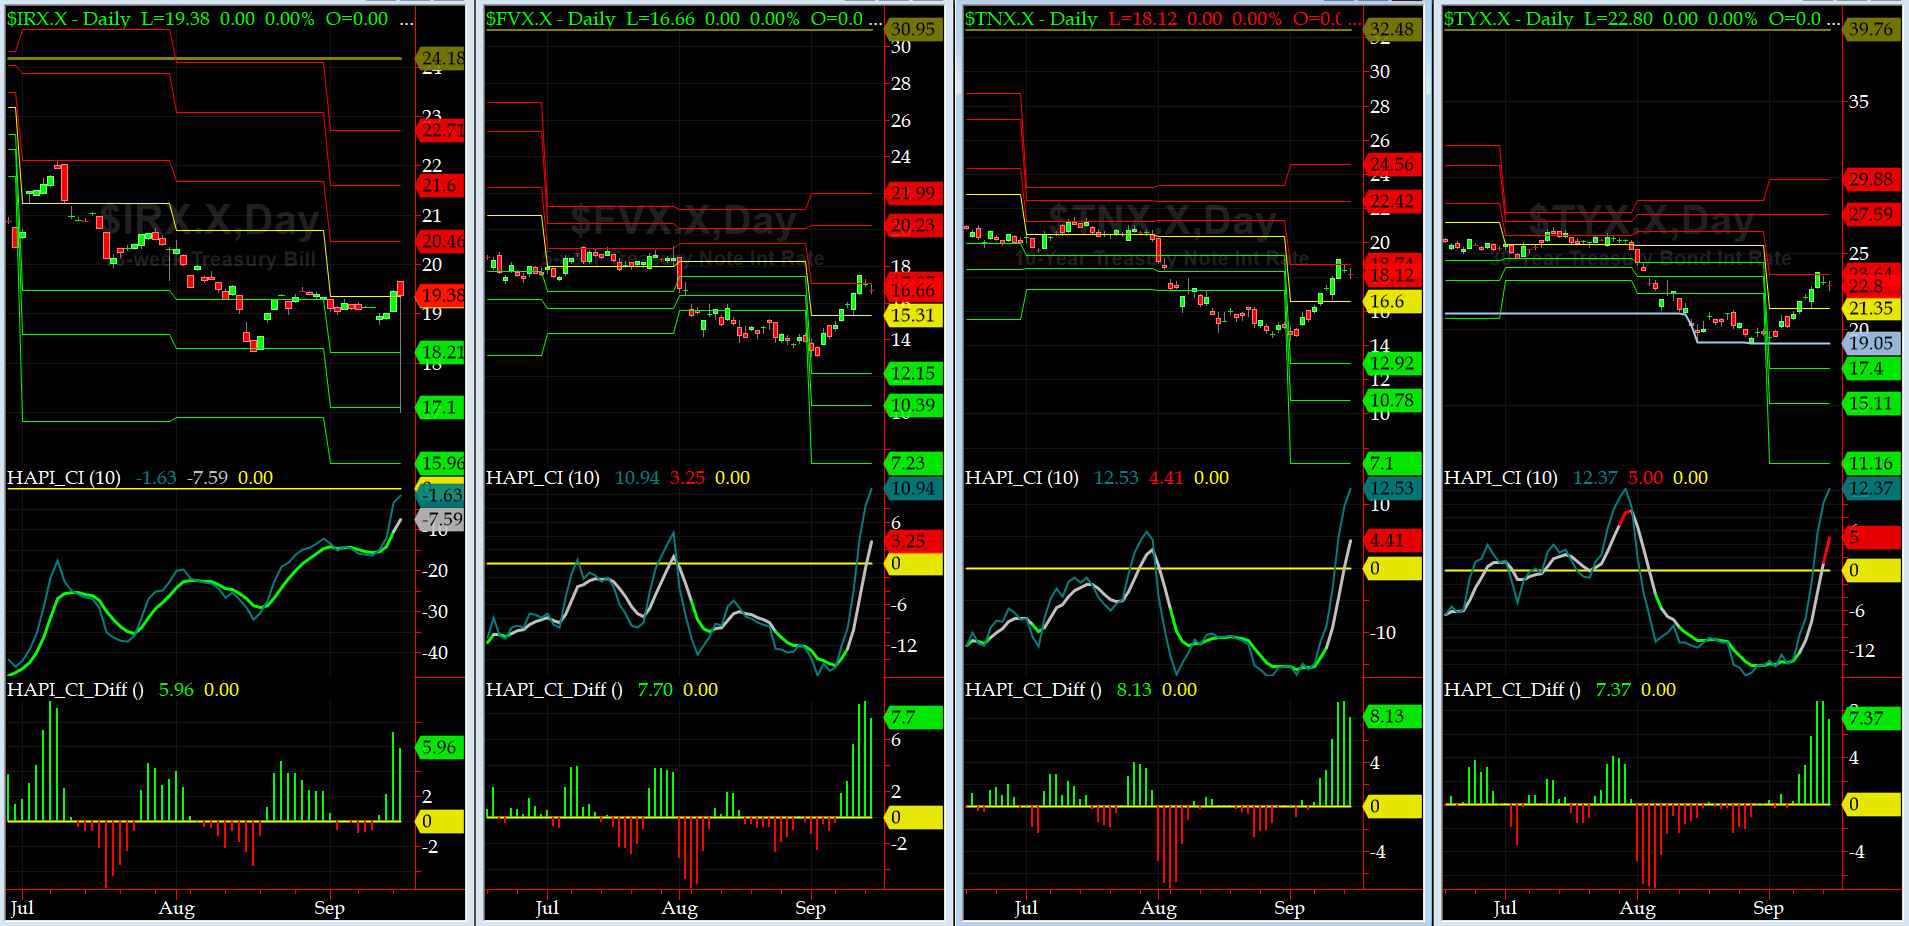
US Treasury T-Notes & T-Bonds Yields Chart
The Yield Curve (both front and back end) have rallied hard since first of the month. Today we will see what Powell & Co decide in their September FOMC Meeting.
Fari Hamzei
|


 Proactive Market Timing