|
Sunday, October 13, 2019, 2130ET
Market Timing Charts, Analysis & Commentary for Issue #310
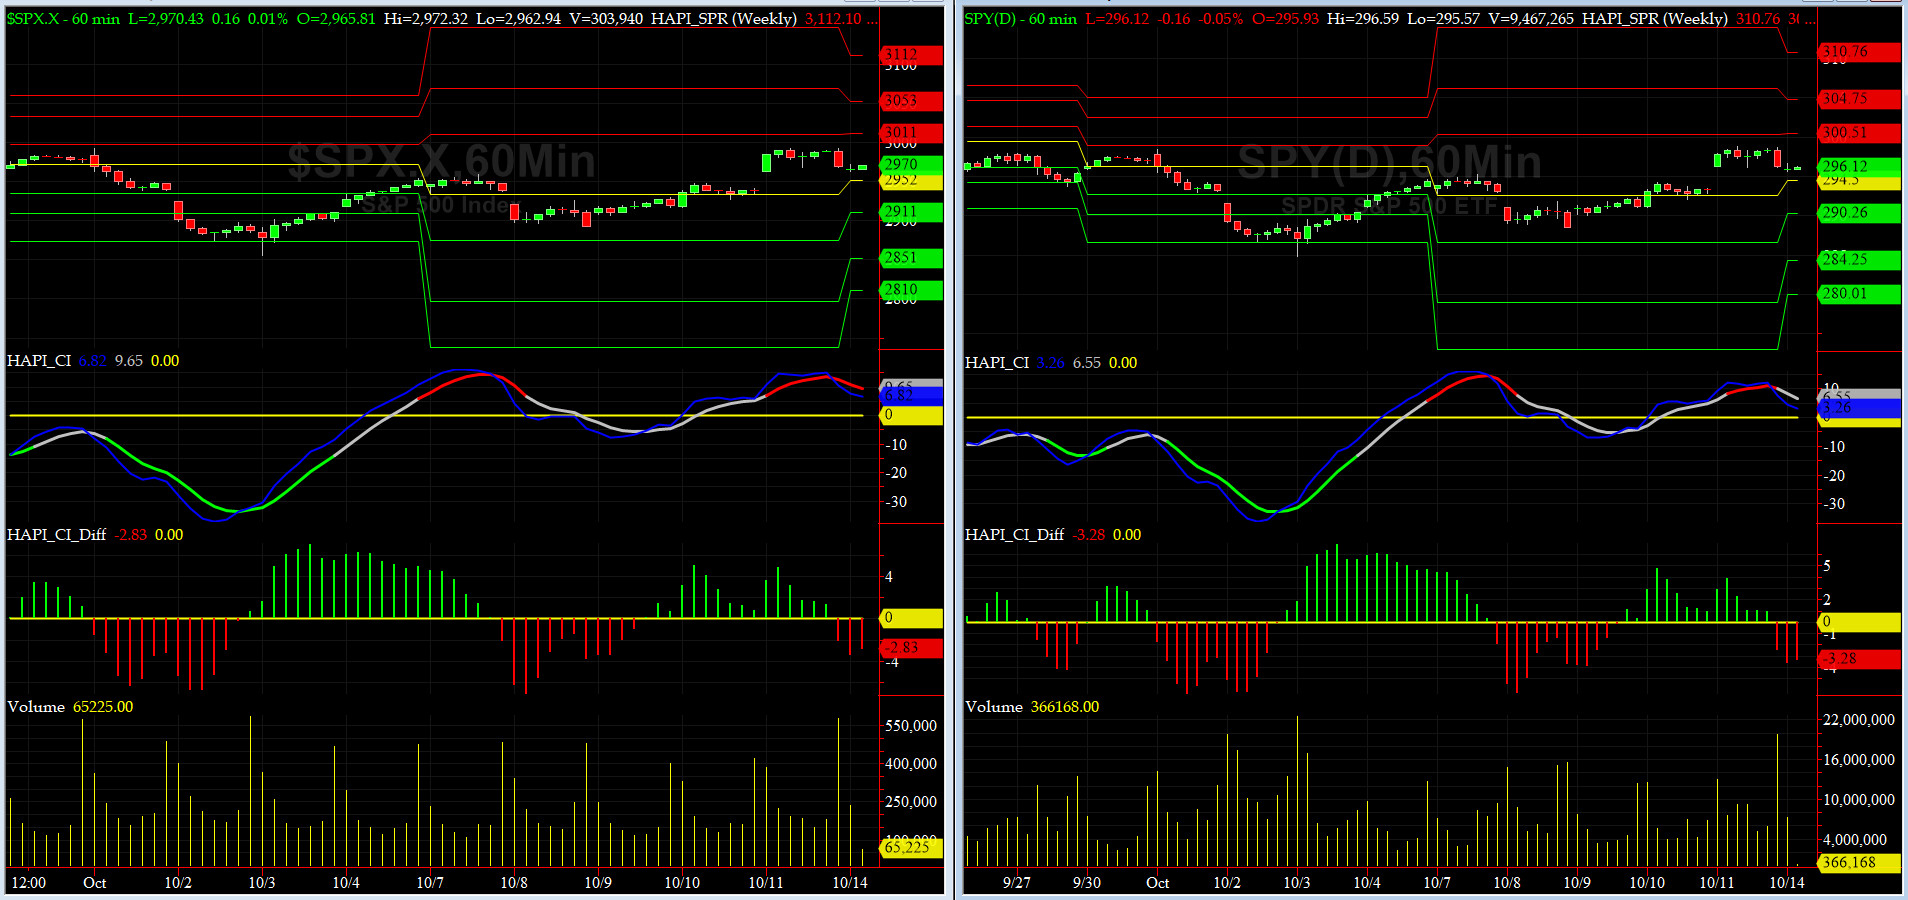
Timer Charts of S&P-500 Cash Index (SPX) + NASDAQ-100 Cash Index (NDX)
Most recent S&P-500 Cash Index (SPX) Close: 2952 down -10 (down -0.34%) for the week ending on Friday, October 4, 2019, which closed at its -0.5 sigma.
DJIA ALL TIME INTRADAY HIGH = 27398 (reached on Tuesday, July 16, 2019)
DJT ALL TIME INTRADAY HIGH = 11623 (reached on Friday, September 14, 2018)
SPX ALL TIME INTRADAY HIGH = 3028 (reached on Friday, July 26, 2019)
NDX ALL TIME INTRADAY HIGH = 8027 (reached on Friday, July 26, 2019)
RUT ALL TIME INTRADAY HIGH = 1742 (reached on Friday, August 31, 2018)
Current DAILY +2 Sigma SPX = 3034 with WEEKLY +2 Sigma = 3067
Current DAILY 0 Sigma SPX = 2961 with WEEKLY 0 Sigma = 2939
Current DAILY -2 Sigma SPX = 2888 with WEEKLY -2 Sigma = 2812
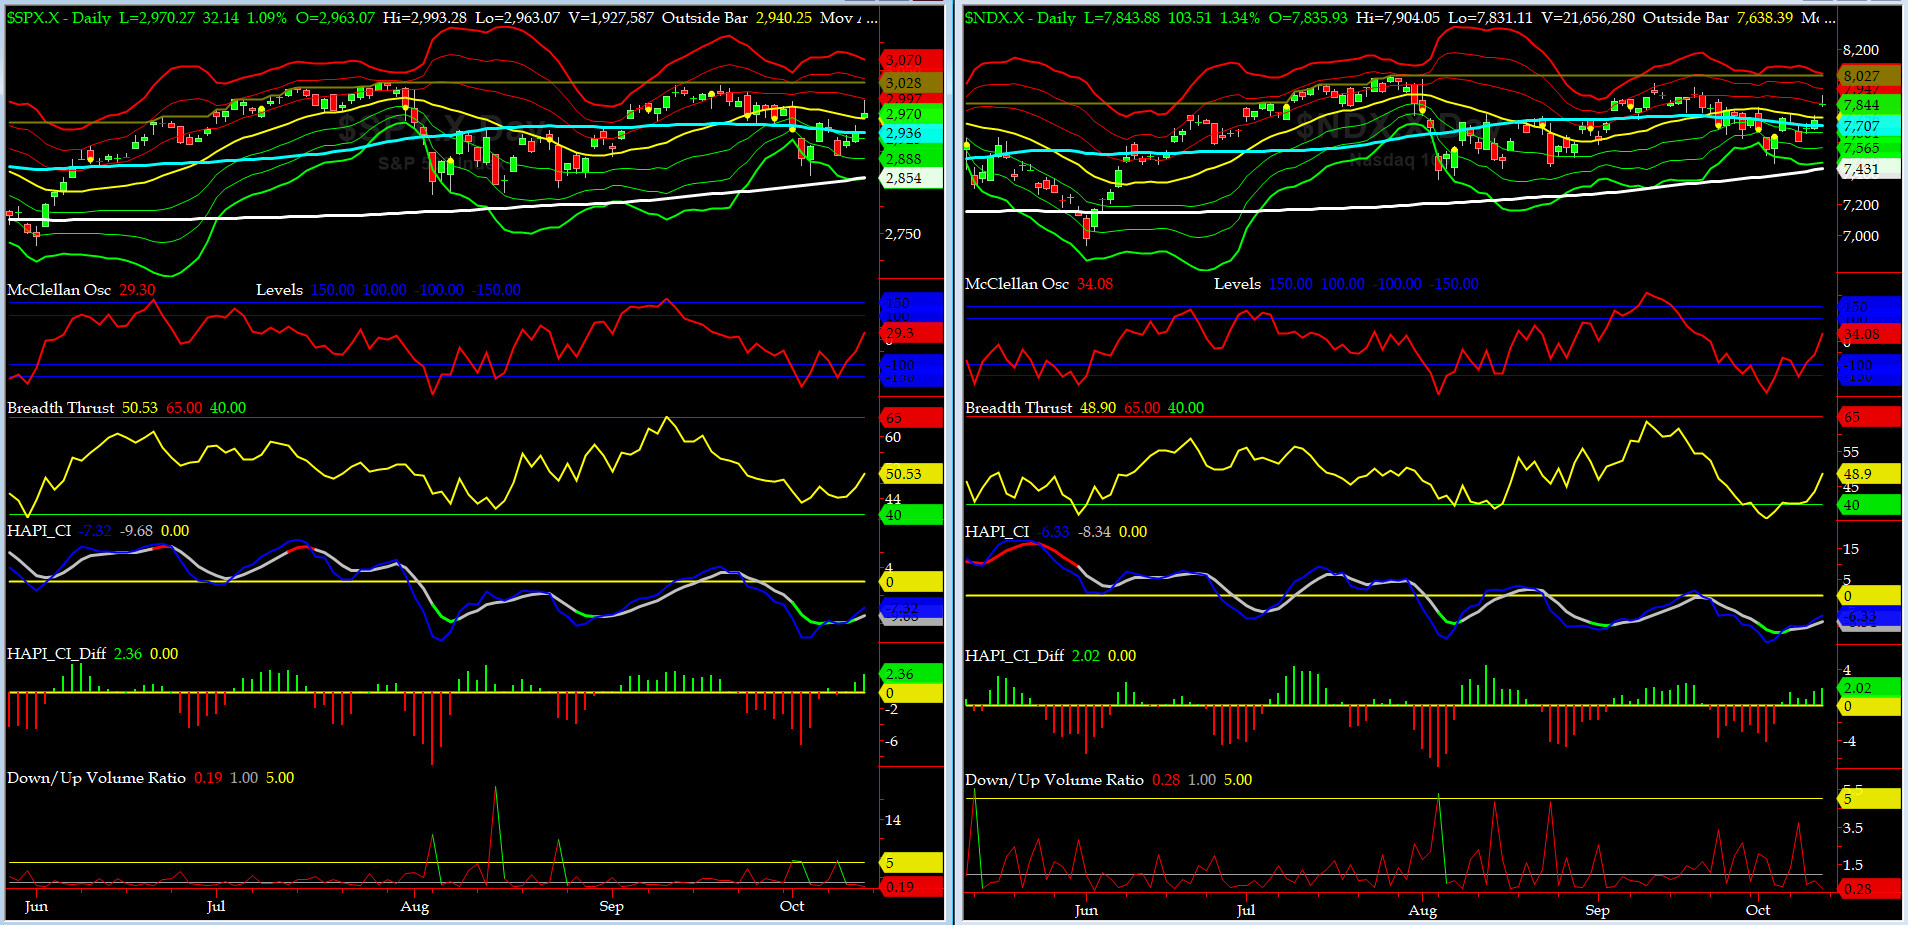
NYSE McClellan Oscillator = +29.5 (-150 is start of the O/S area; around -275 to -300 area or lower, we go into the �launch-pad� mode; over +150, we are in O/B area)
NYSE Breadth Thrust = 50.5 (40 is considered as oversold and 65 as overbought)
We will stay LONG for day or two as we are crossing NEUTRAL zone into overbought.
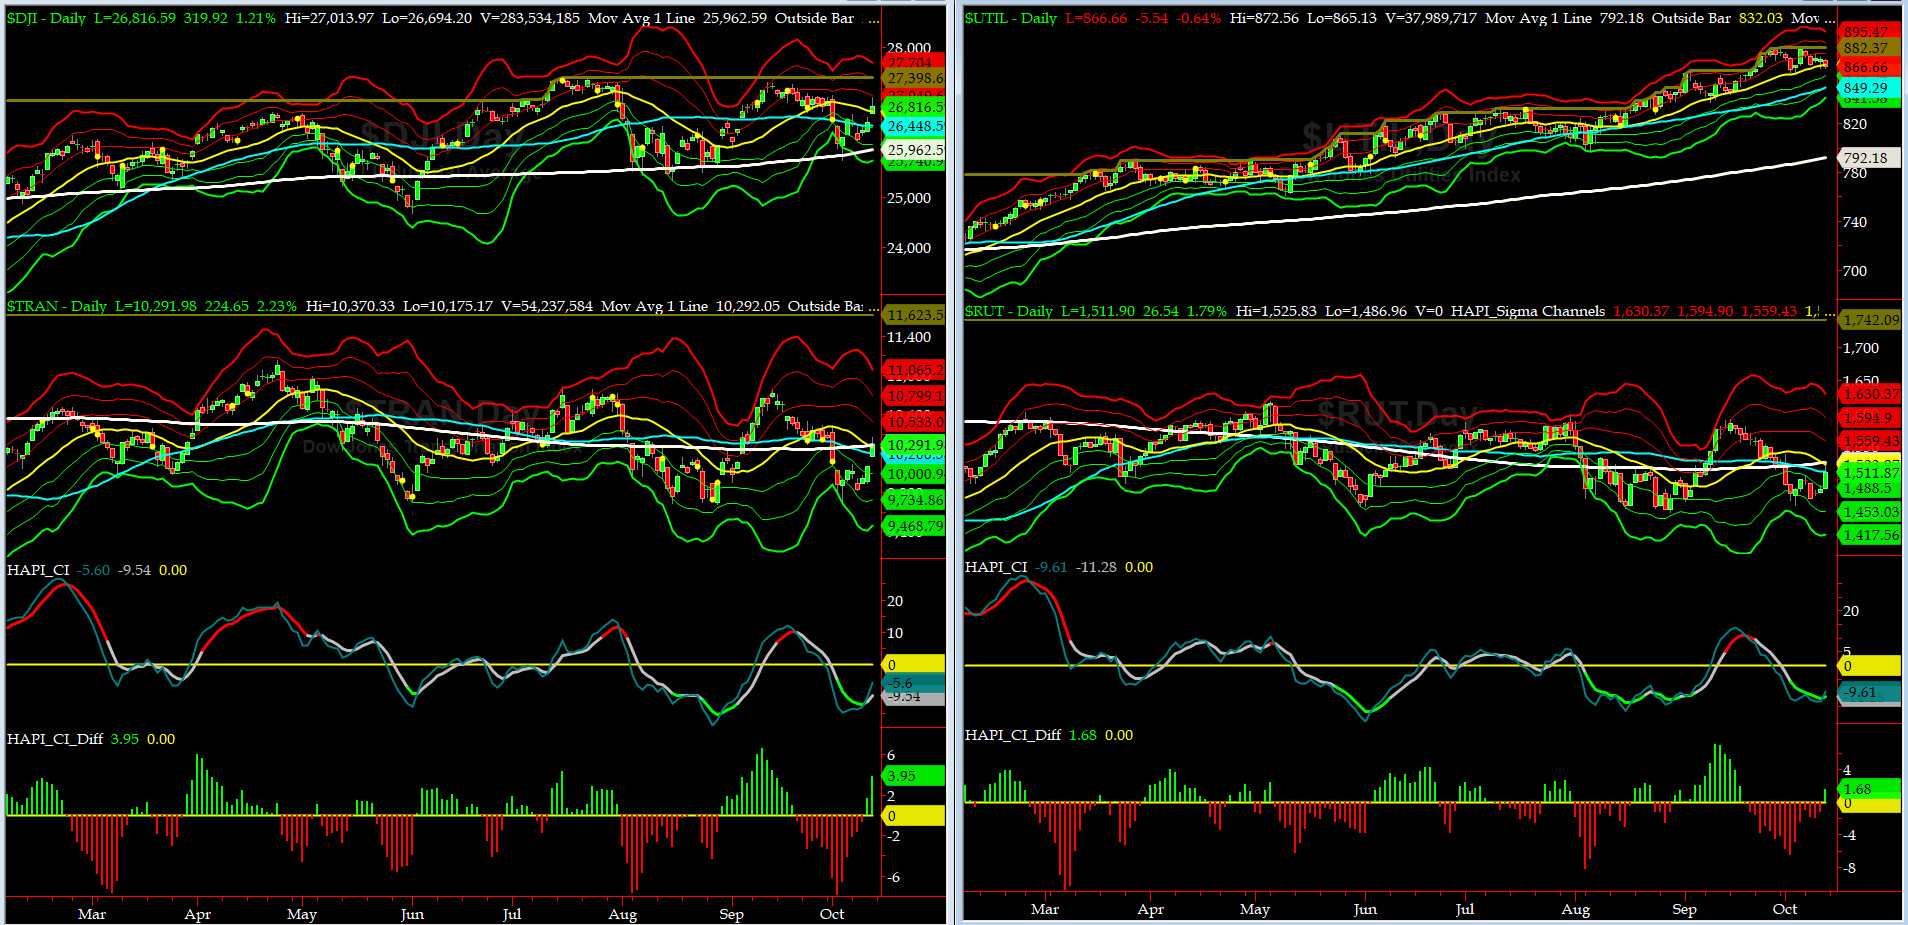
Canaries [in the Coal Mine] Chart for DJ TRAN & RUT Indices
200-Day MA DJ TRAN = 10,273 or at the DJ TRAN (max observed in last 7 yrs = 20.2%, min = -20.3%)
200-Day MA RUT = 1526 or 1% ABOVE RUT (max observed in last 7 yrs = 21.3%, min = -22.6%)
DJ Transportation Index (proxy for economic conditions 6 to 9 months hence) had a huge come back on Thursday & Friday after a tough two weeks.
Russell 2000 Small Caps Index (proxy for Risk ON/OFF) also had a very rough week but came back a tad on Friday. RISK IS STILL OFF.
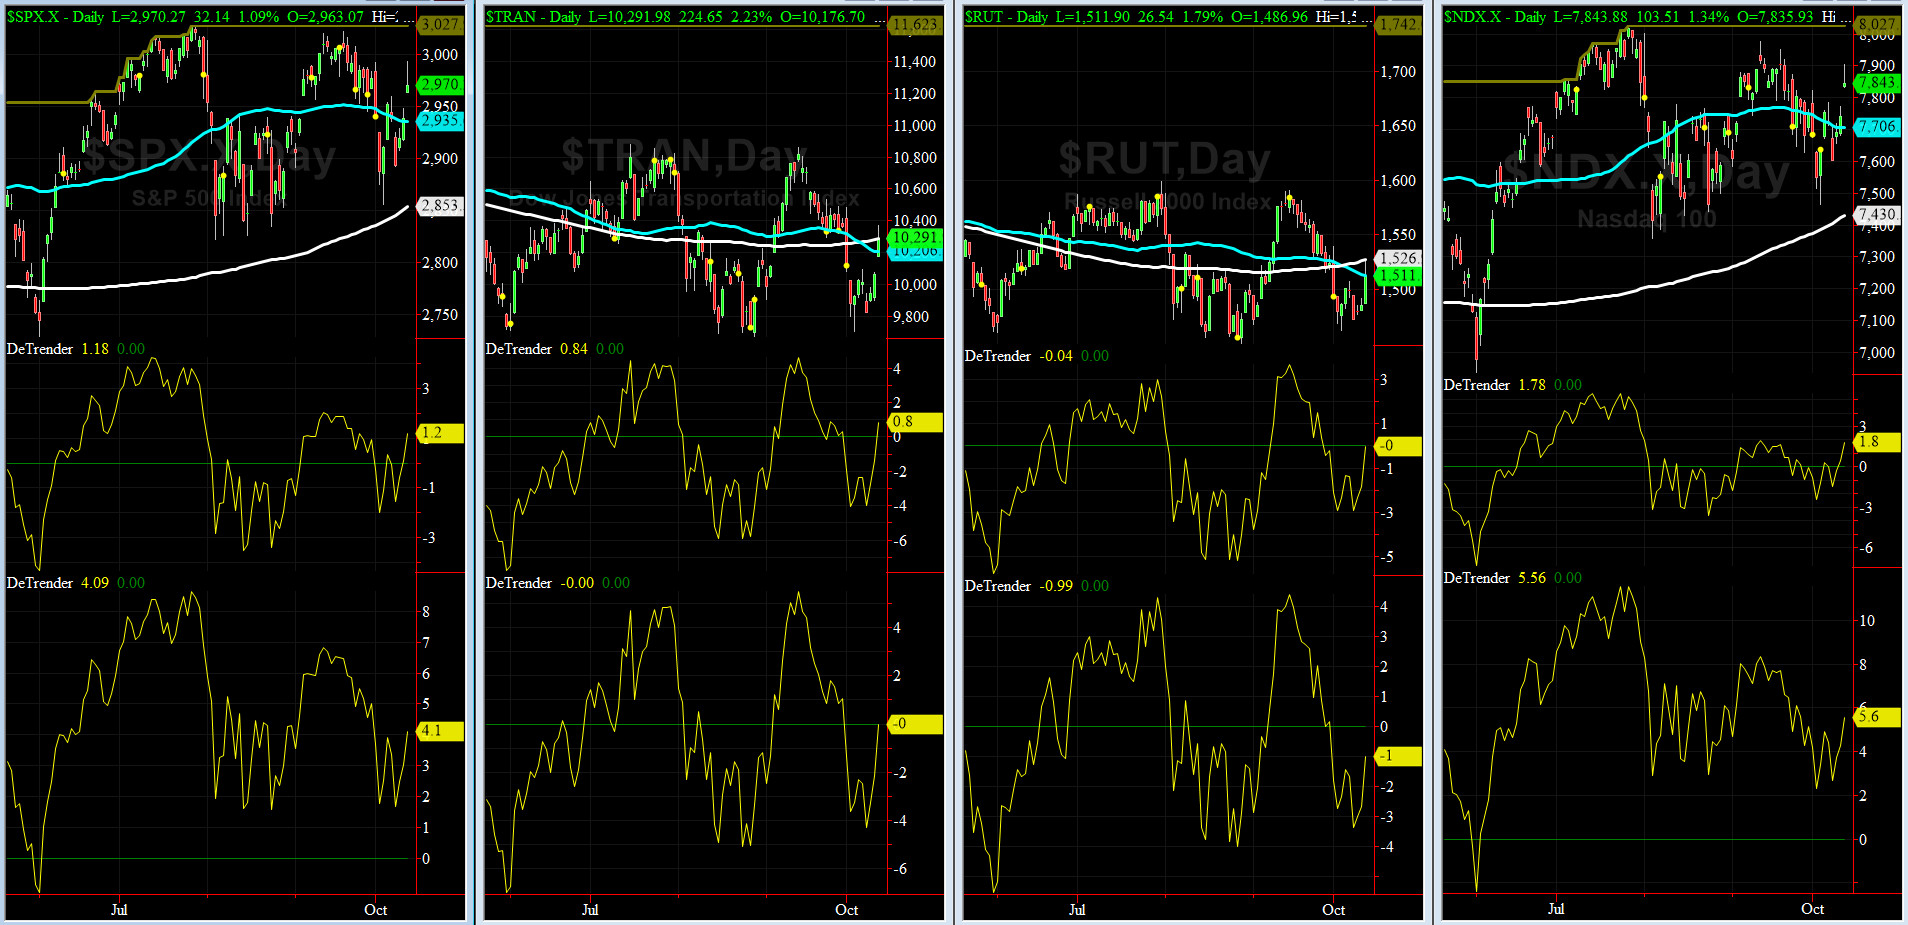
DeTrenders Charts for SPX, NDX, TRAN & RUT Indices
50-Day MA SPX = 2935 or 1.2% BELOW SPX (max observed in last 7 yrs = +8.6%, min = -9.3%)
200-Day MA SPX = 2853 or 4.1% BELOW SPX (max observed in last 7 yrs = 15.2%, min = -14%)
Only FIVE of our EIGHT DeTrenders are in the POSITIVE territory. The DeTrenders for DJ Tran & RUT will continue to be harbingers of future price behavior in broad indices.
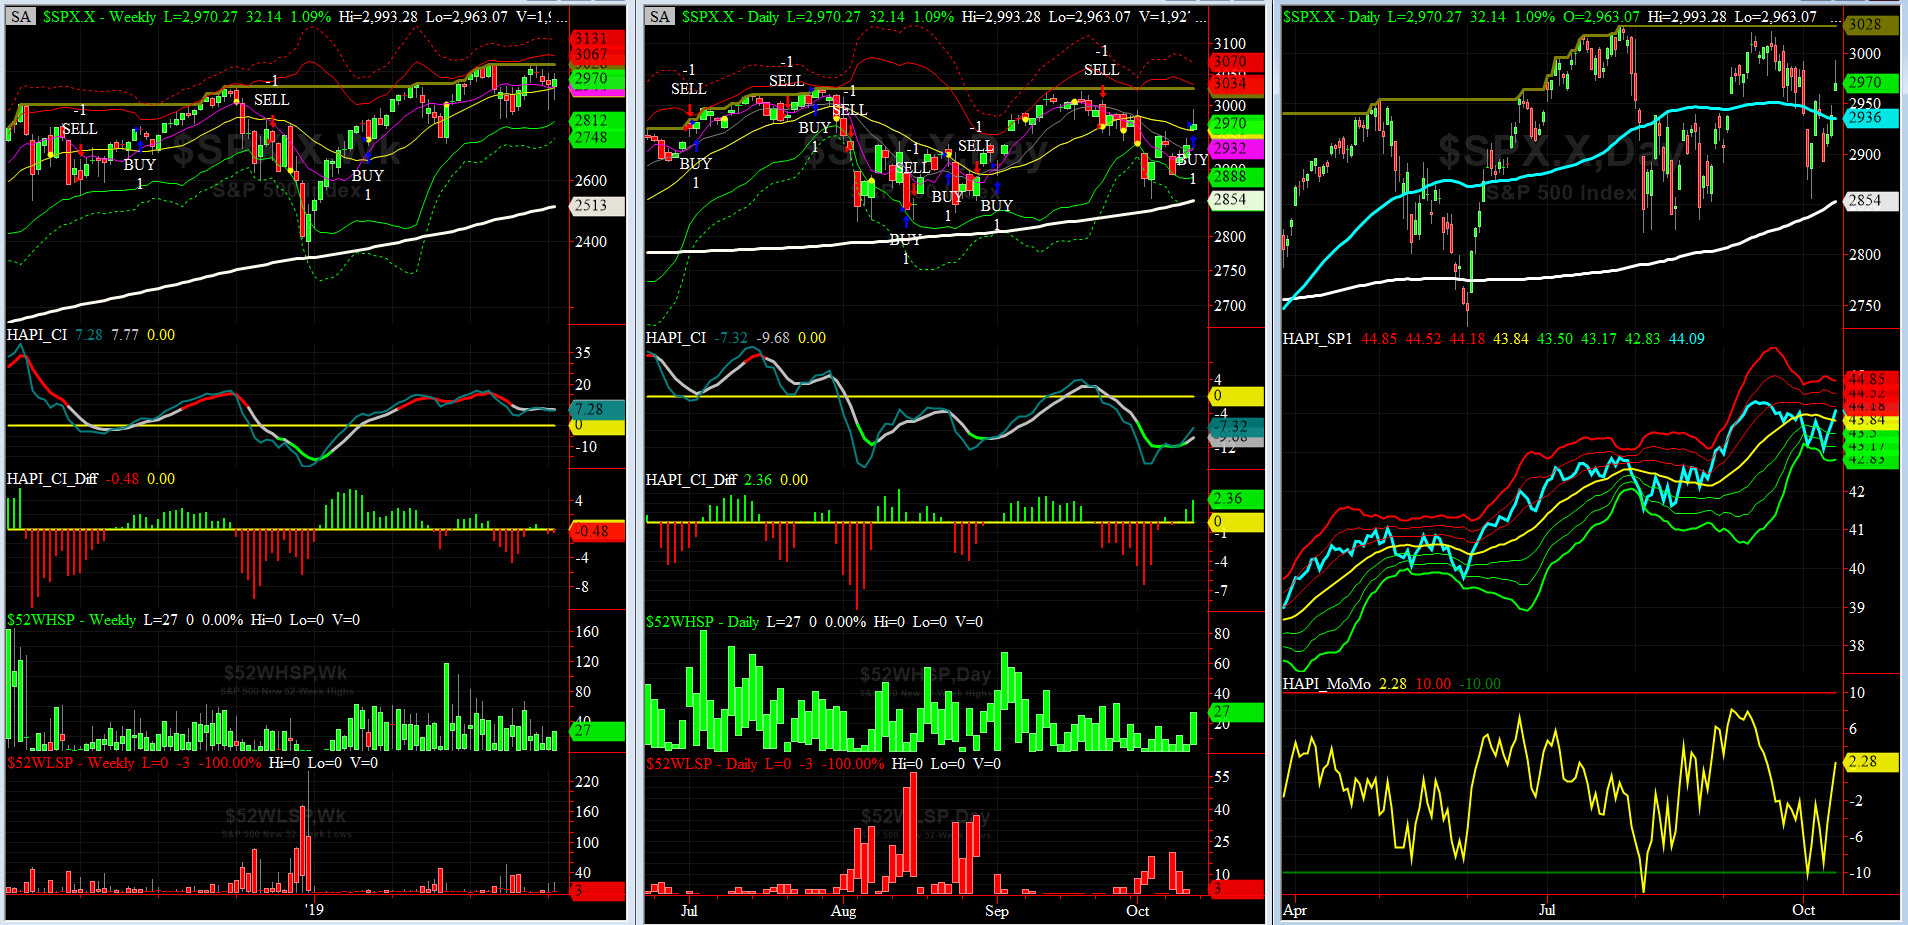
HA_SP1_Momo Chart
WEEKLY Timing Model = on a BUY Signal since Friday, March 8, 2019 CLOSE at 2743
DAILY Timing Model = on a BUY Signal since Friday, October 11, 2019 CLOSE at 2970
Max SPX 52wk-highs reading last week = 27 (over 120-140, the local maxima is in)
Max SPX 52wk-Lows reading last week = 20 (over 40-60, the local minima is in)
HA_SP1 closed near its +1 sigma channels
HA_Momo = +2.28 (reversals most likely occur above +10 or below -10)
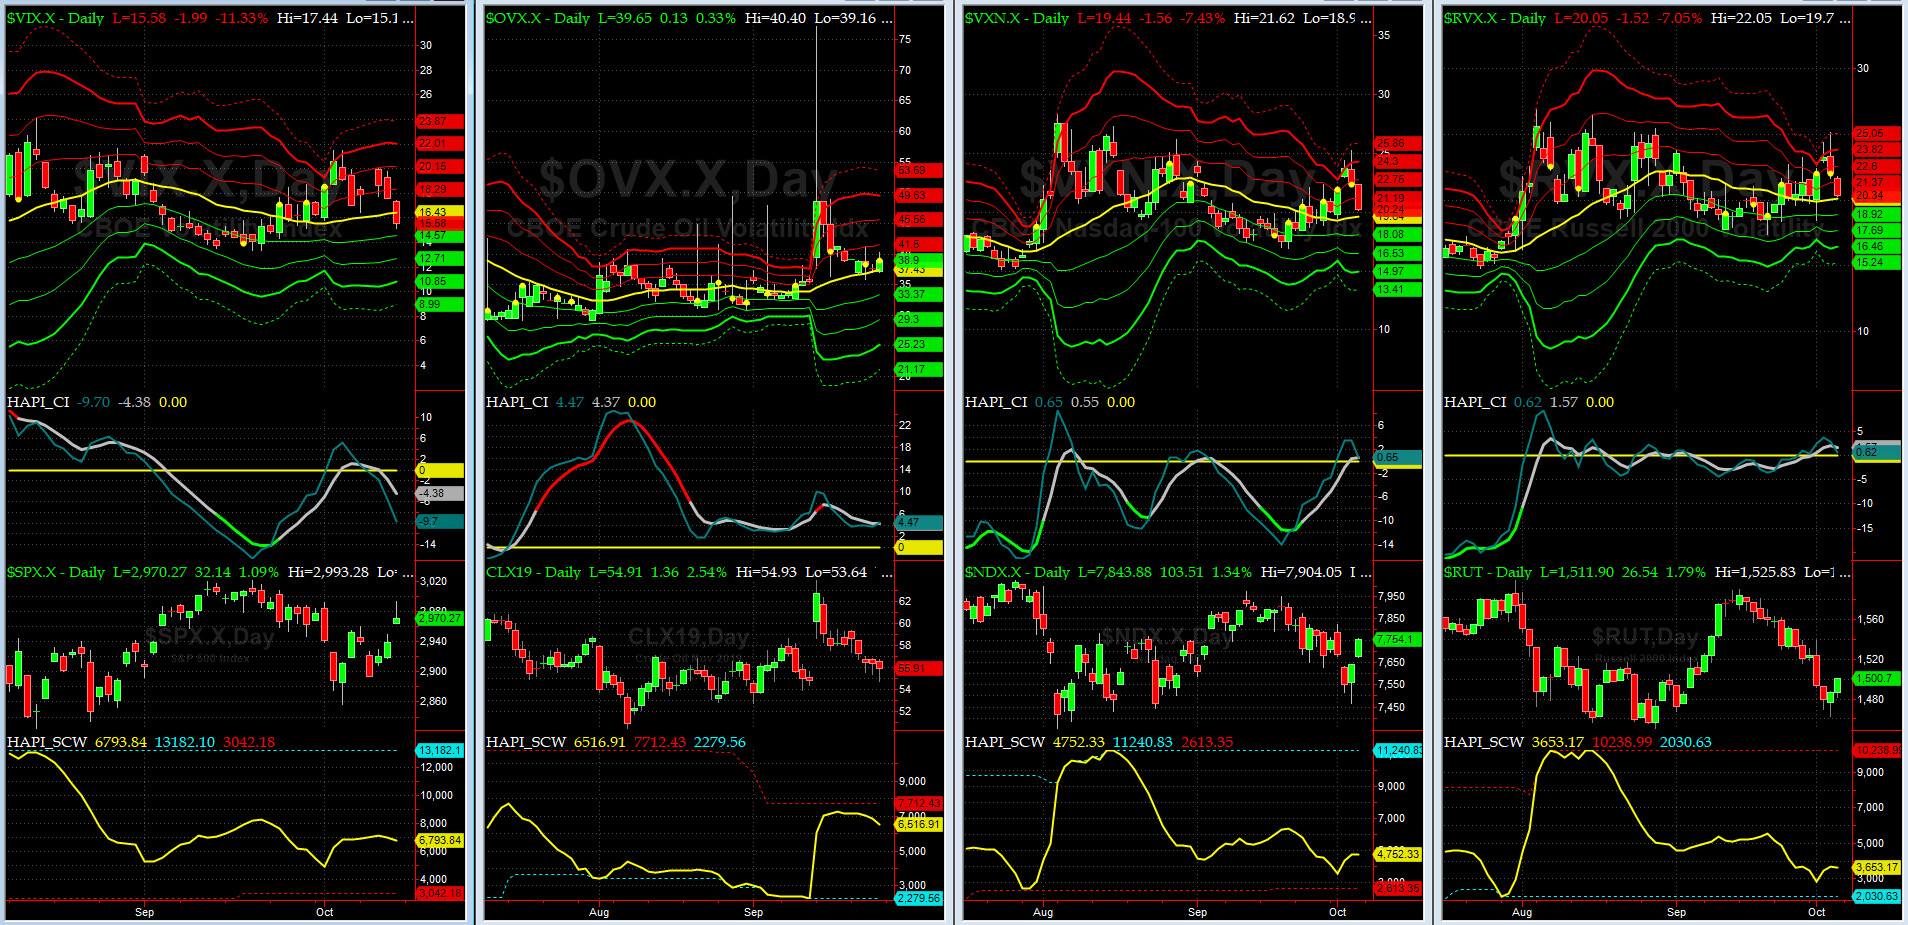
Vol of the Vols Chart
Spot VIX stood at 15.6 Friday night, a tad below its -1 sigma (remember it's the VIX volatility pattern aka "its sigma channels" that matters, and not the level of VIX itself (this is per Dr. Robert Whaley, a great mentor and inventor of original VIX, now called VXO). VIX usually peaks around a test of its +4 sigma).
Last week, this shockwave completed its move.....
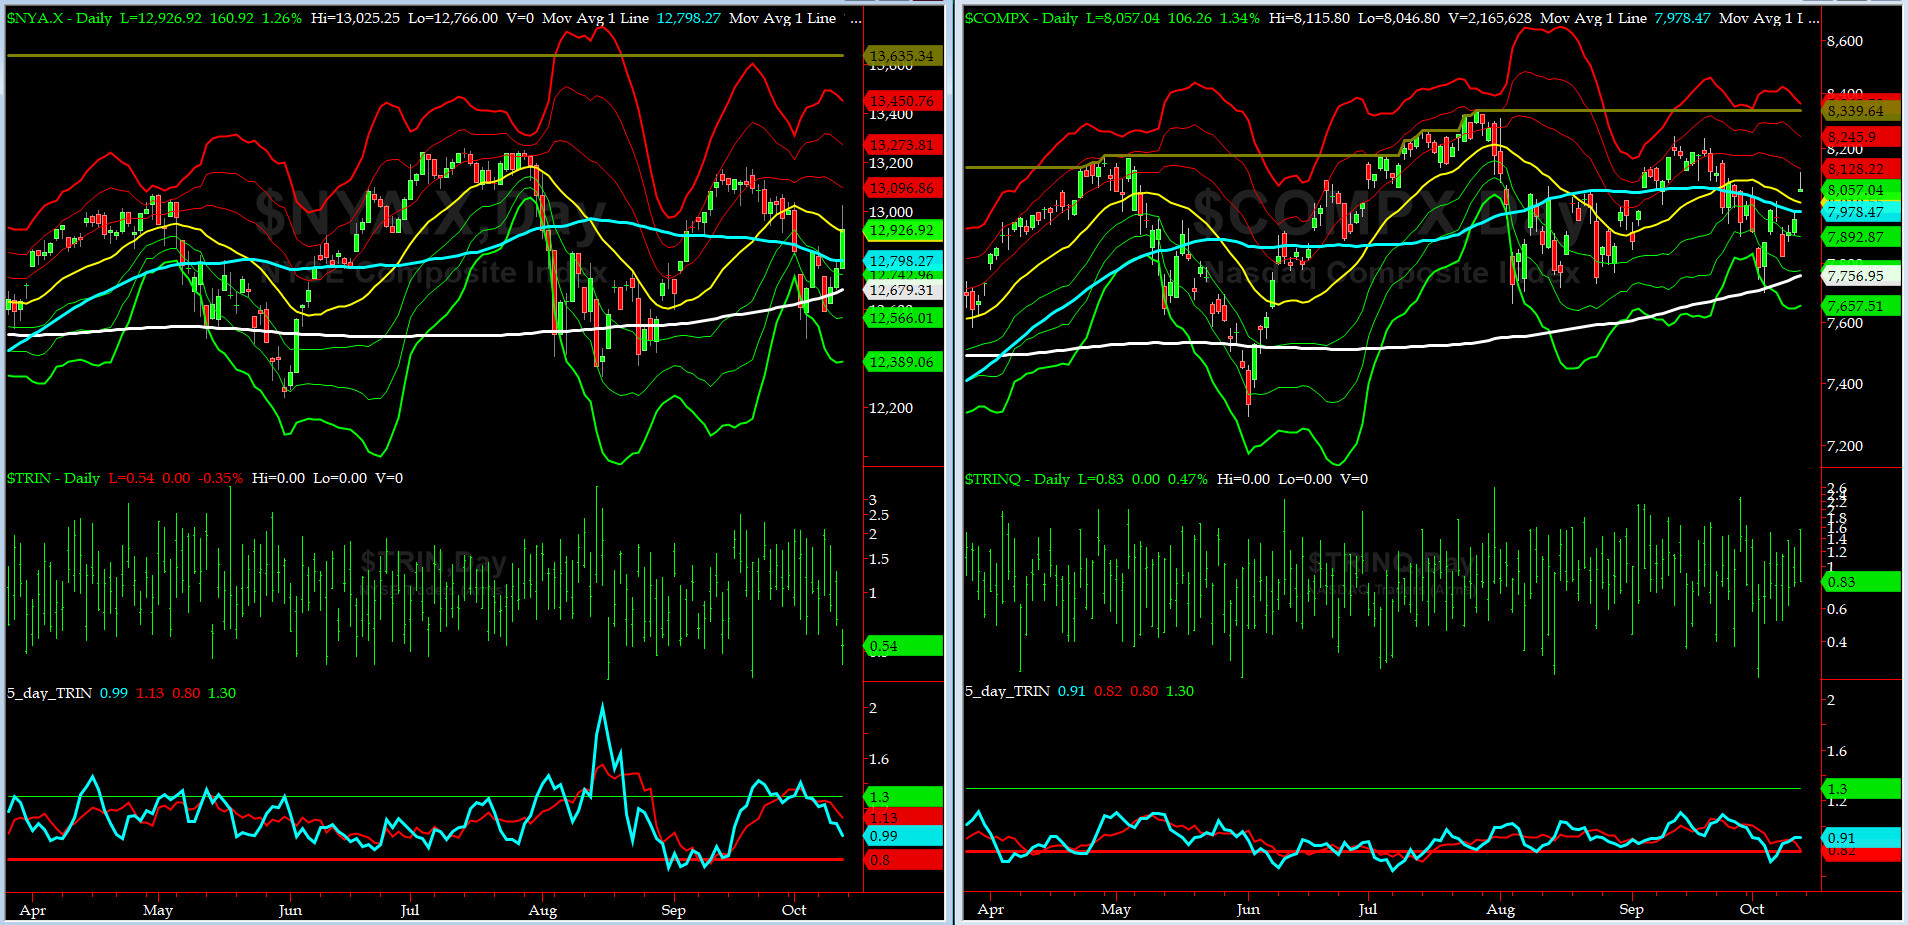
5-day TRIN & TRINQ Charts
Both NYSE & NASDAQ 5-day TRINs are in NEUTRAL zone.
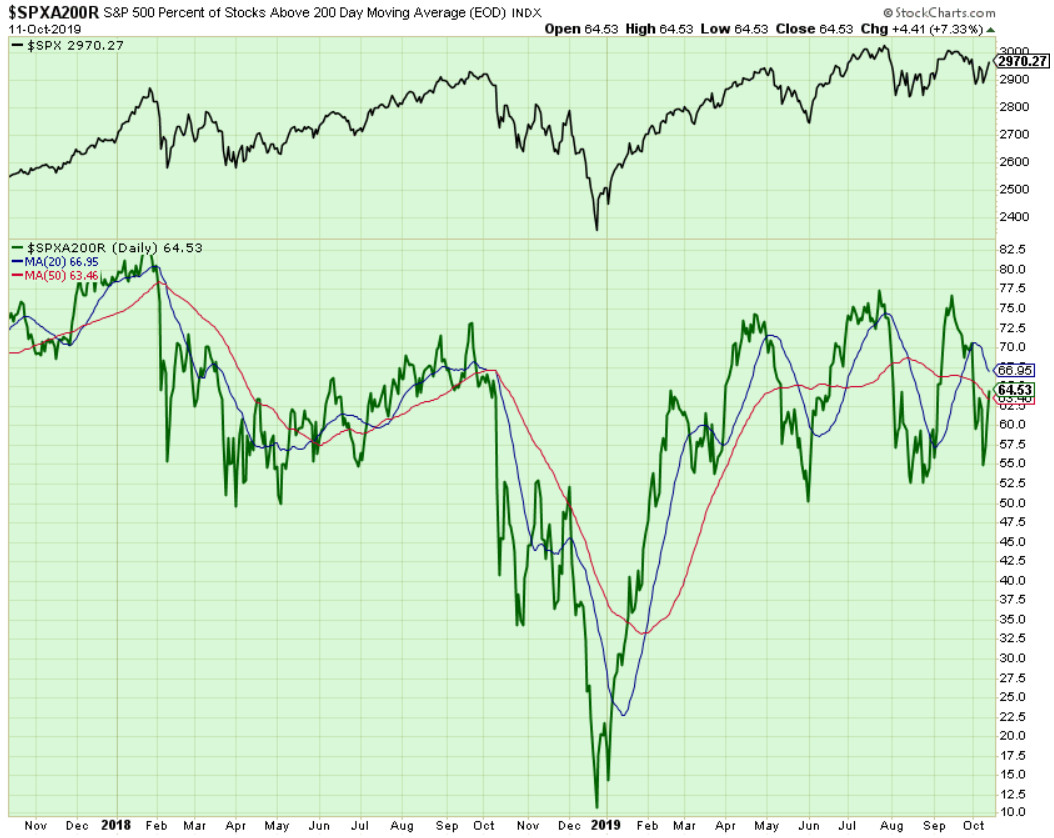
Components of SPX above their respective 200-day MA Chart
This scoring indicator closed at 64.5% which went nowhere fast as whole week of trading. AGAIN, WE MUST THANK Grumpino for helping out ALL index day-traders.
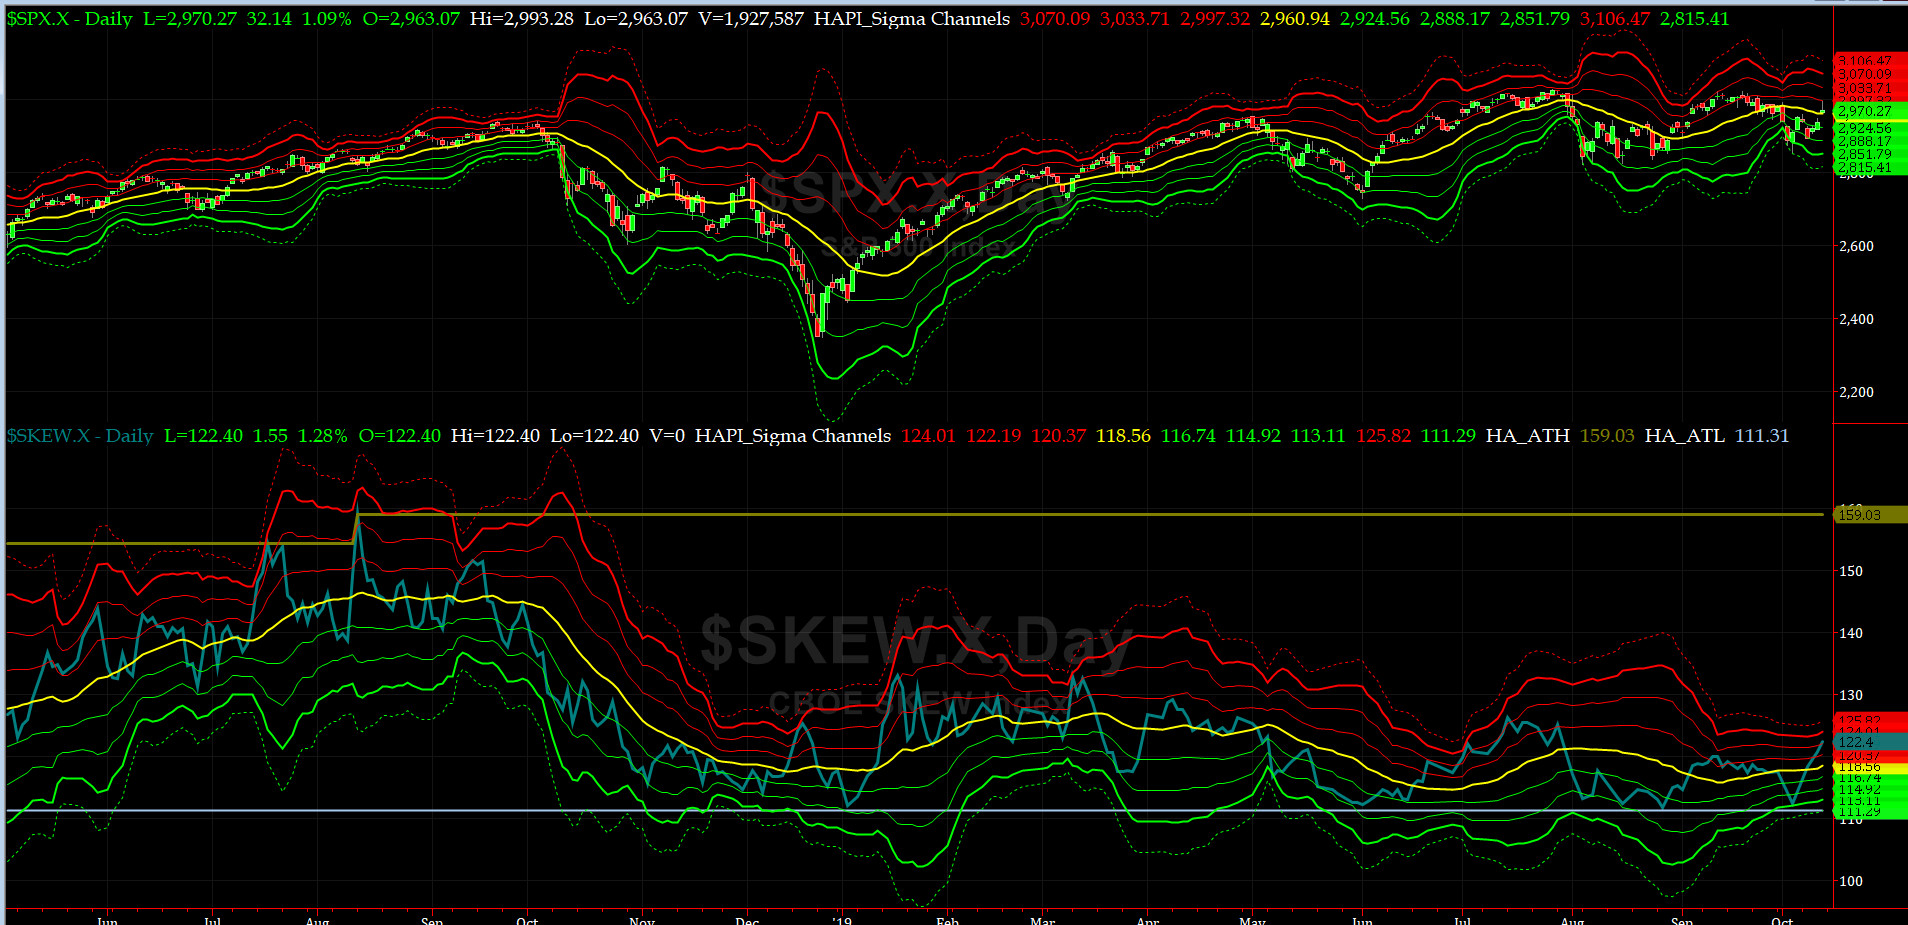
SPX SKEW (Downside Tail Risk) Chart
On Friday, SPX SKEW (Downside Tail Risk) rose pretty sharply to 122.4, now just a tad above its +2 sigma (normal = 115, range 100-150).
All quiet on the Eastern & Mid-Western Fronts? our beloved HRH Capt. Tiko, KCPE, now thinks move rock 'n roll is ahead. "What is the catalyst?" no one knows but stay alert
How to interpret the value of SPX SKEW? (from CBOE white paper on SKEW)

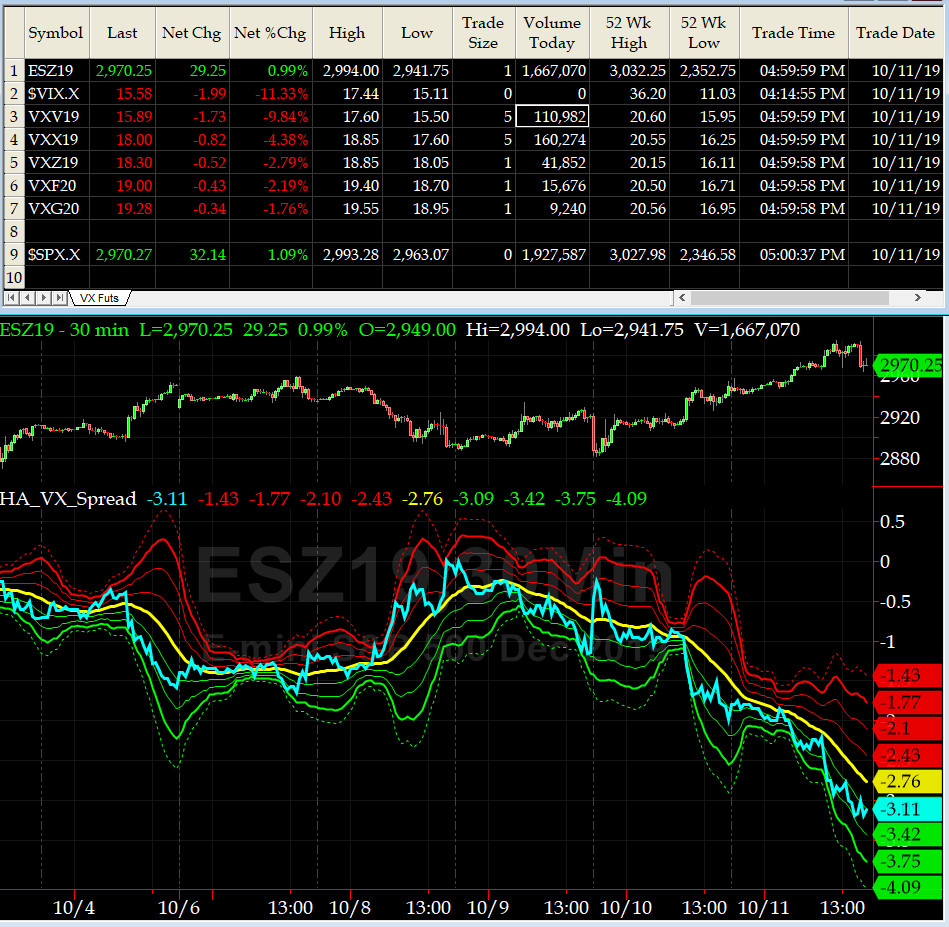
3-month VIX Futures Spread(VX) Chart
This popular timing indicator for identifying tradable bottoms, (now long SEP19, & short DEEZ19 VIX Futures) hit -3.11 Friday Close . We are in overbought zone here.

HA_SP2 Chart
HA_SP2 = 63.4 (Buy signal <= 25, Sell Signal >= 75)
This indicator is heading up from the NEUTRAL zone.
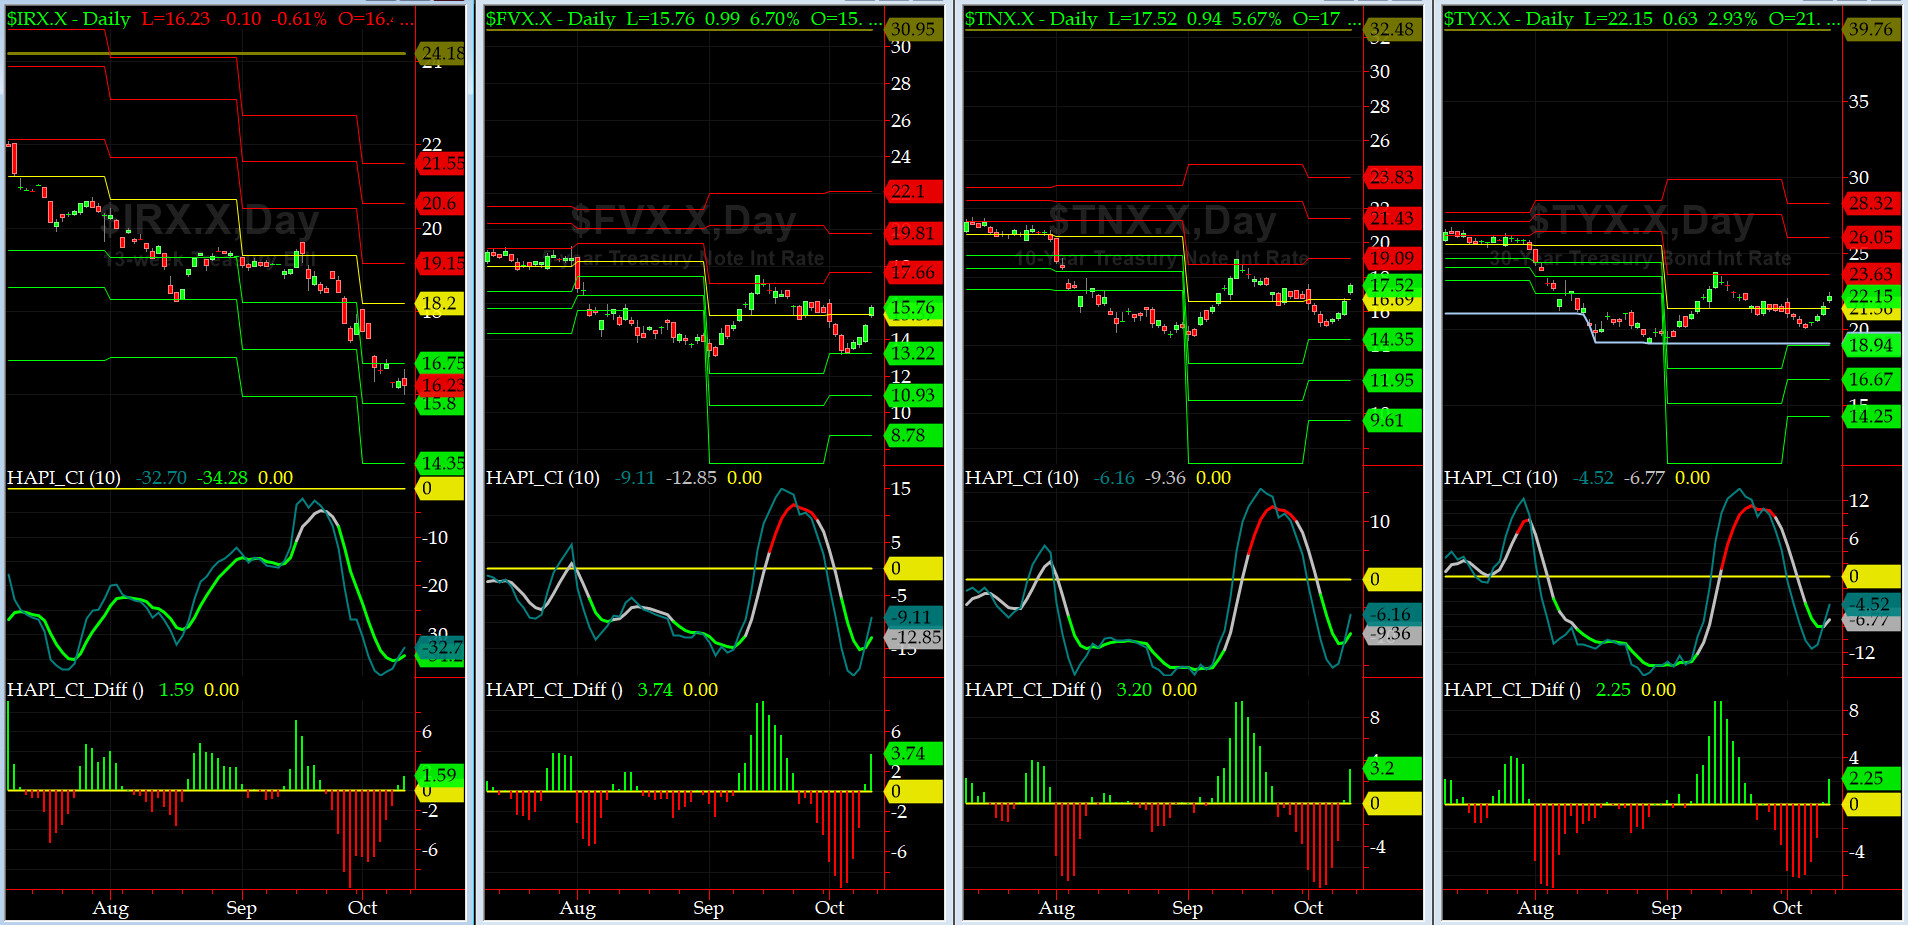
US Treasury T-Notes & T-Bonds Yields Chart
The Yield Curve (both front and back end) eased off more in the first part of last week and then rallied on Thursday & Friday as news of possible trade deal on China was reported. As usual, Grumpino was skating on thin ice. Oops !!
Fari Hamzei
|


 Proactive Market Timing