|
Tuesday, October 22, 2019, 2230ET
Market Timing Charts, Analysis & Commentary for Issue #311

Timer Charts of S&P-500 Cash Index (SPX) + NASDAQ-100 Cash Index (NDX)
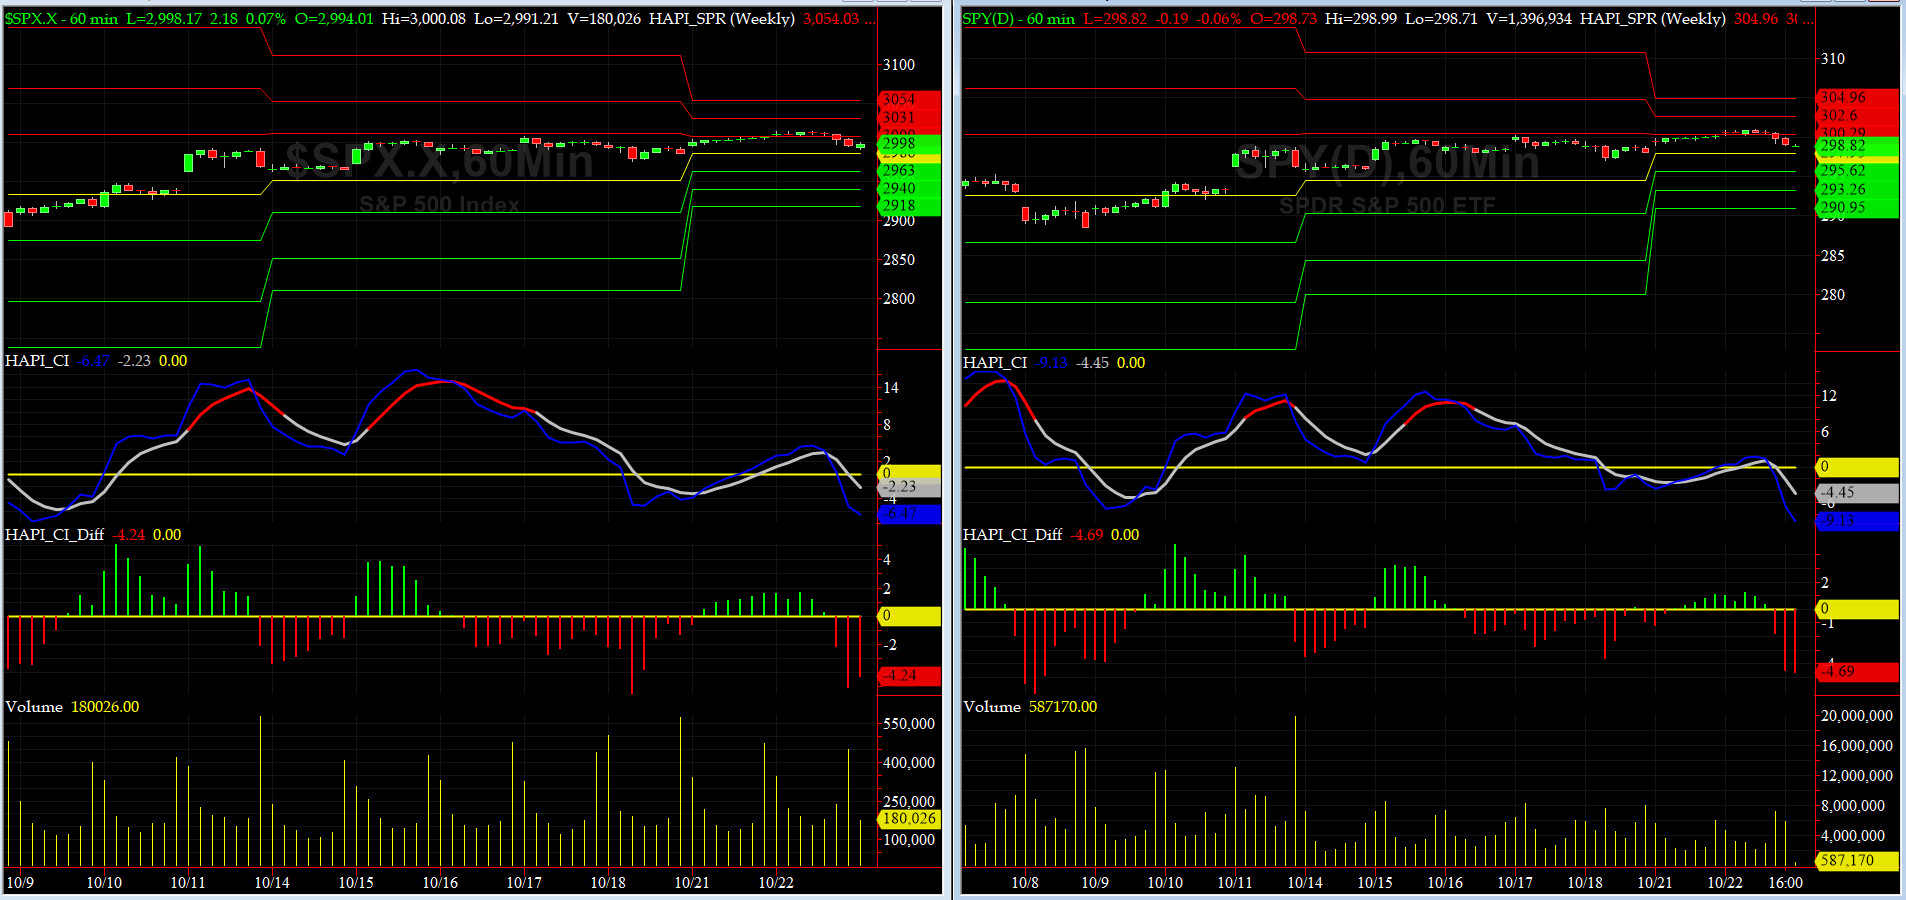
Most recent S&P-500 Cash Index (SPX) Close: 2996 up +26 (up +0.87%) for the seven trading days ending on Tuesday, October 22, 2019, which closed at its +1 sigma.
DJIA ALL TIME INTRADAY HIGH = 27398 (reached on Tuesday, July 16, 2019)
DJT ALL TIME INTRADAY HIGH = 11623 (reached on Friday, September 14, 2018)
SPX ALL TIME INTRADAY HIGH = 3028 (reached on Friday, July 26, 2019)
NDX ALL TIME INTRADAY HIGH = 8027 (reached on Friday, July 26, 2019)
RUT ALL TIME INTRADAY HIGH = 1742 (reached on Friday, August 31, 2018)
Current DAILY +2 Sigma SPX = 3029 with WEEKLY +2 Sigma = 3048
Current DAILY 0 Sigma SPX = 2959 with WEEKLY 0 Sigma = 2957
Current DAILY -2 Sigma SPX = 2890 with WEEKLY -2 Sigma = 2866
NYSE McClellan Oscillator = +95.4 (-150 is start of the O/S area; around -275 to -300 area or lower, we go into the “launch-pad” mode; over +150, we are in O/B area)
NYSE Breadth Thrust = 61.9 (40 is considered as oversold and 65 as overbought)
It's time to get short, because: short-term chart patterns, Earnings Season volatility & the political crisis Washington is in currently.
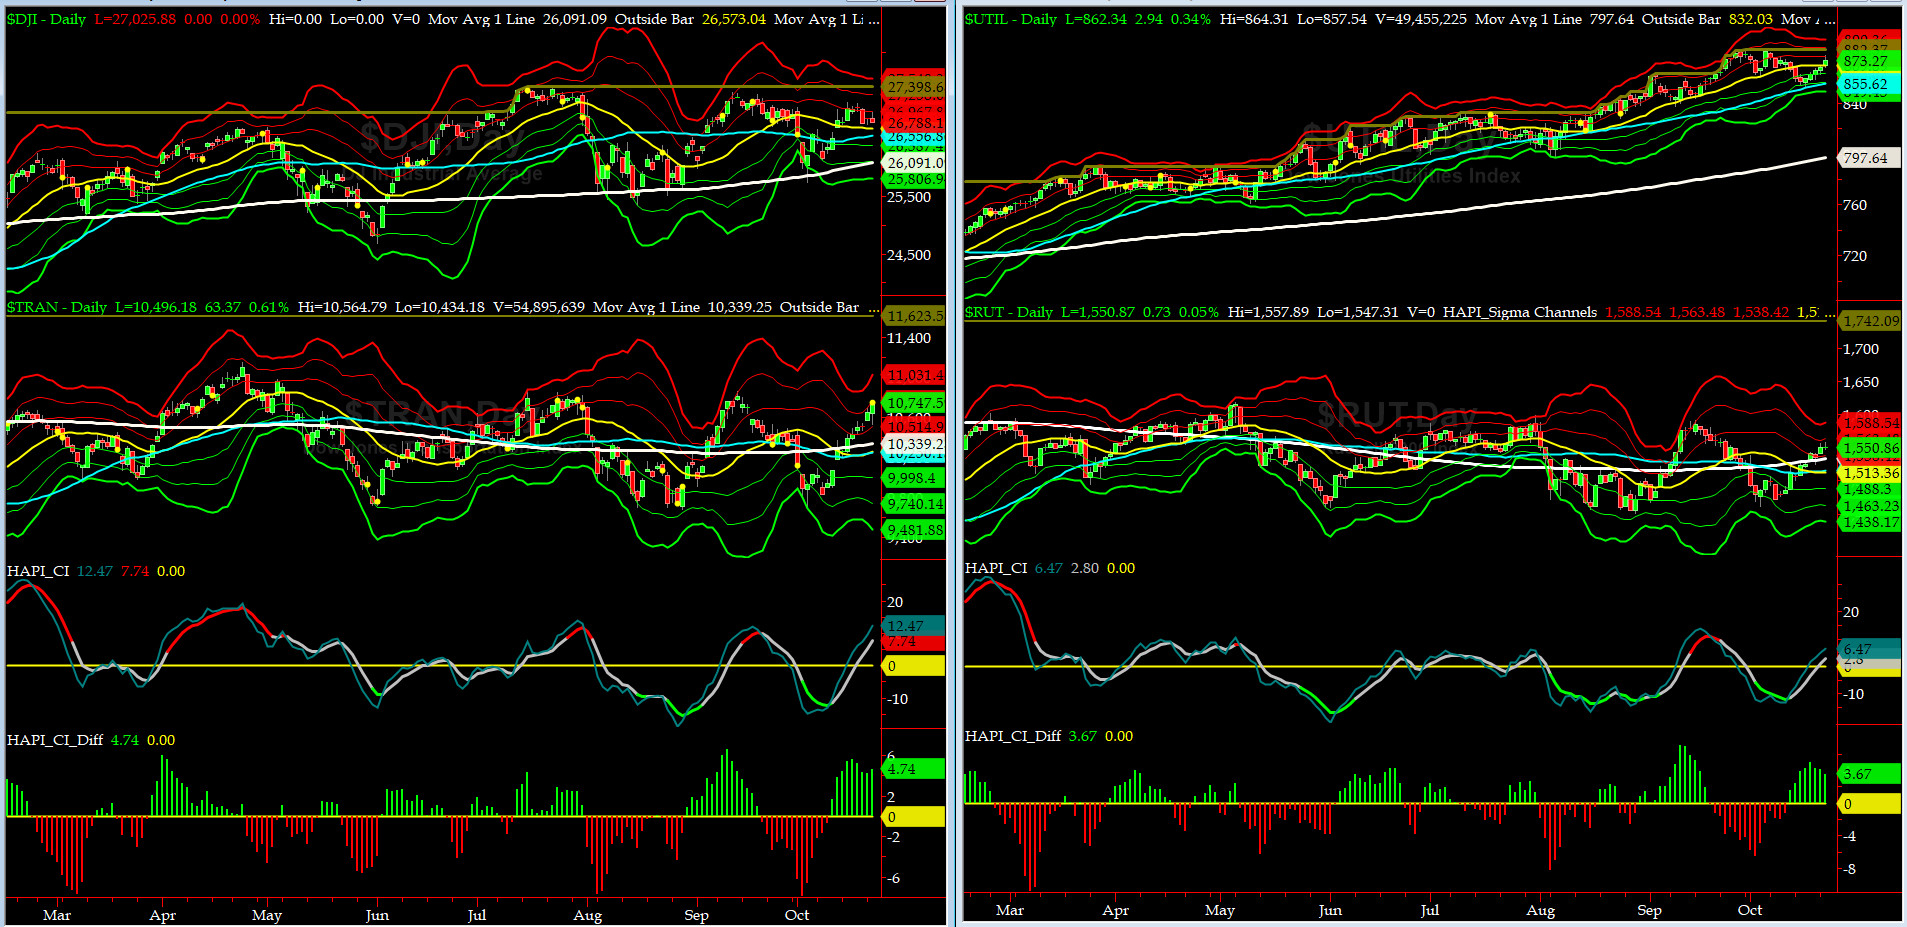
Canaries [in the Coal Mine] Chart for DJ TRAN & RUT Indices
200-Day MA DJ TRAN = 10,339 or 3.9% ABOVE the DJ TRAN (max observed in last 7 yrs = 20.2%, min = -20.3%)
200-Day MA RUT = 1533 or 1.2% ABOVE RUT (max observed in last 7 yrs = 21.3%, min = -22.6%)
DJ Transportation Index (proxy for economic conditions 6 to 9 months hence) had a run-up in the last 7 days.
Russell 2000 Small Caps Index (proxy for Risk ON/OFF) also had a very strong up in the last 9 days. RISK ON IS so-so.
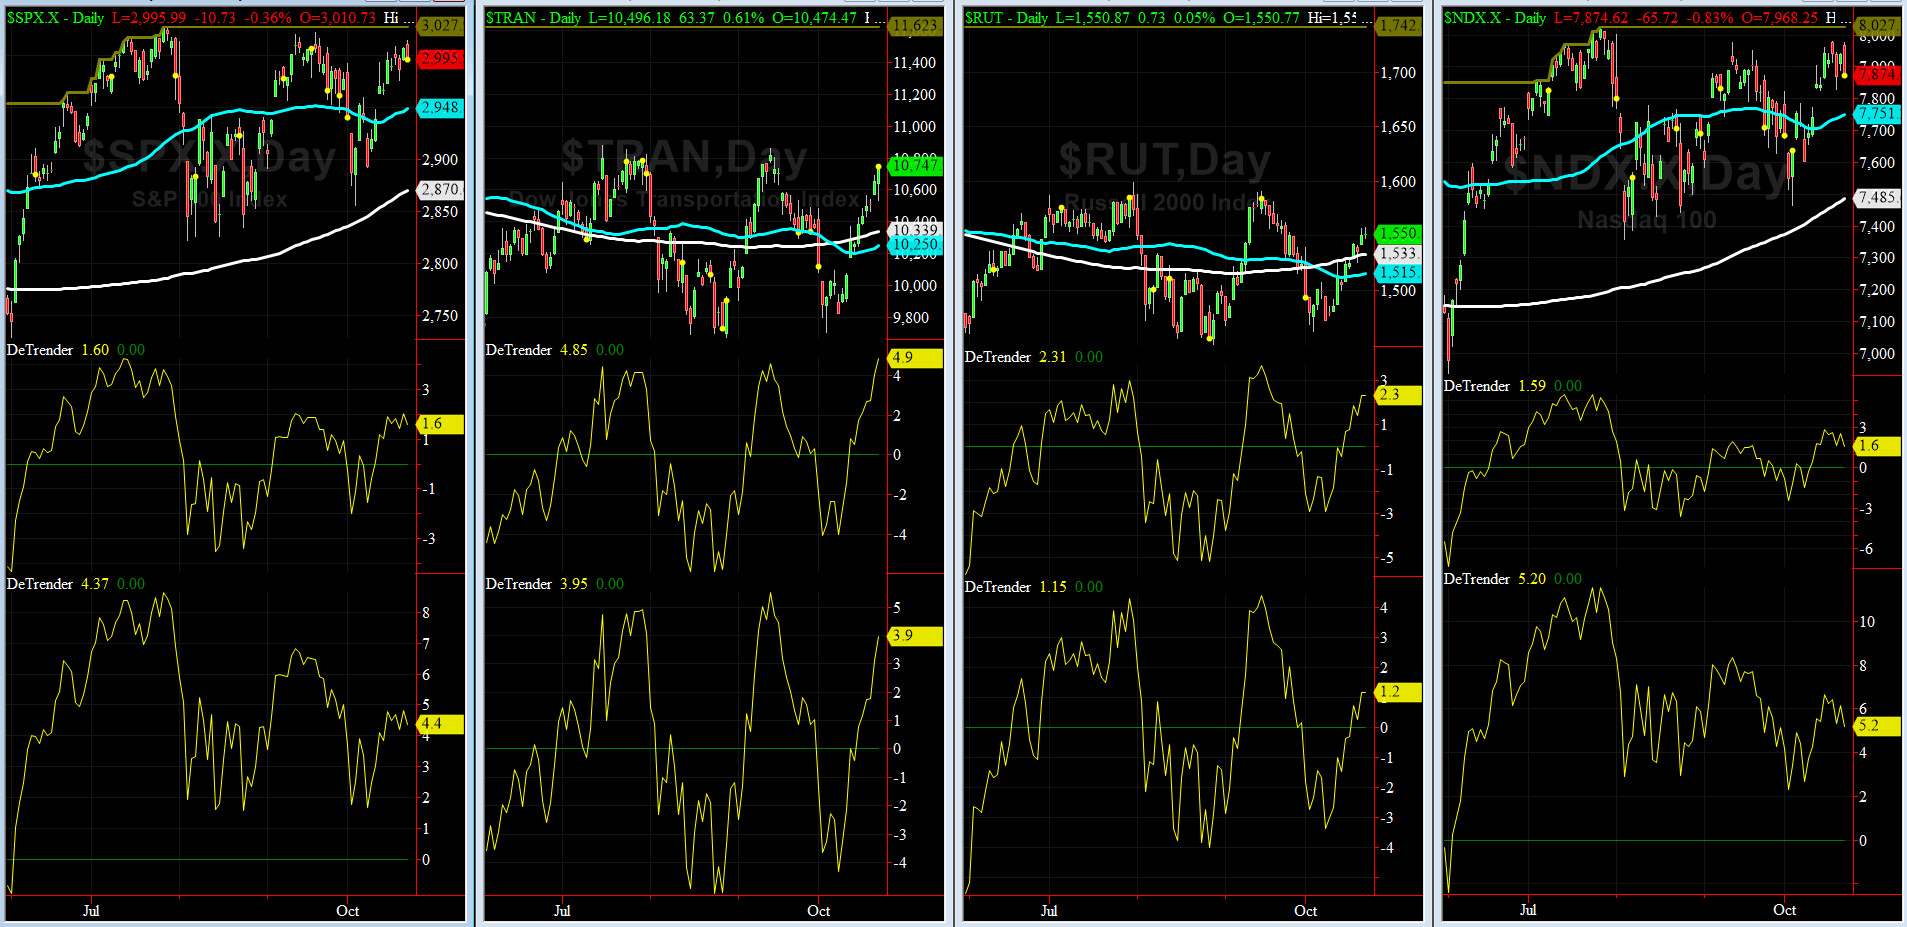
DeTrenders Charts for SPX, NDX, TRAN & RUT Indices
50-Day MA SPX = 2948 or 1.6% BELOW SPX (max observed in last 7 yrs = +8.6%, min = -9.3%)
200-Day MA SPX = 2870 or 4.4% BELOW SPX (max observed in last 7 yrs = 15.2%, min = -14%)
All EIGHT of our EIGHT DeTrenders are in the POSITIVE territory. The DeTrenders for DJ Tran & RUT will continue to be harbingers of future price behavior in broad indices.
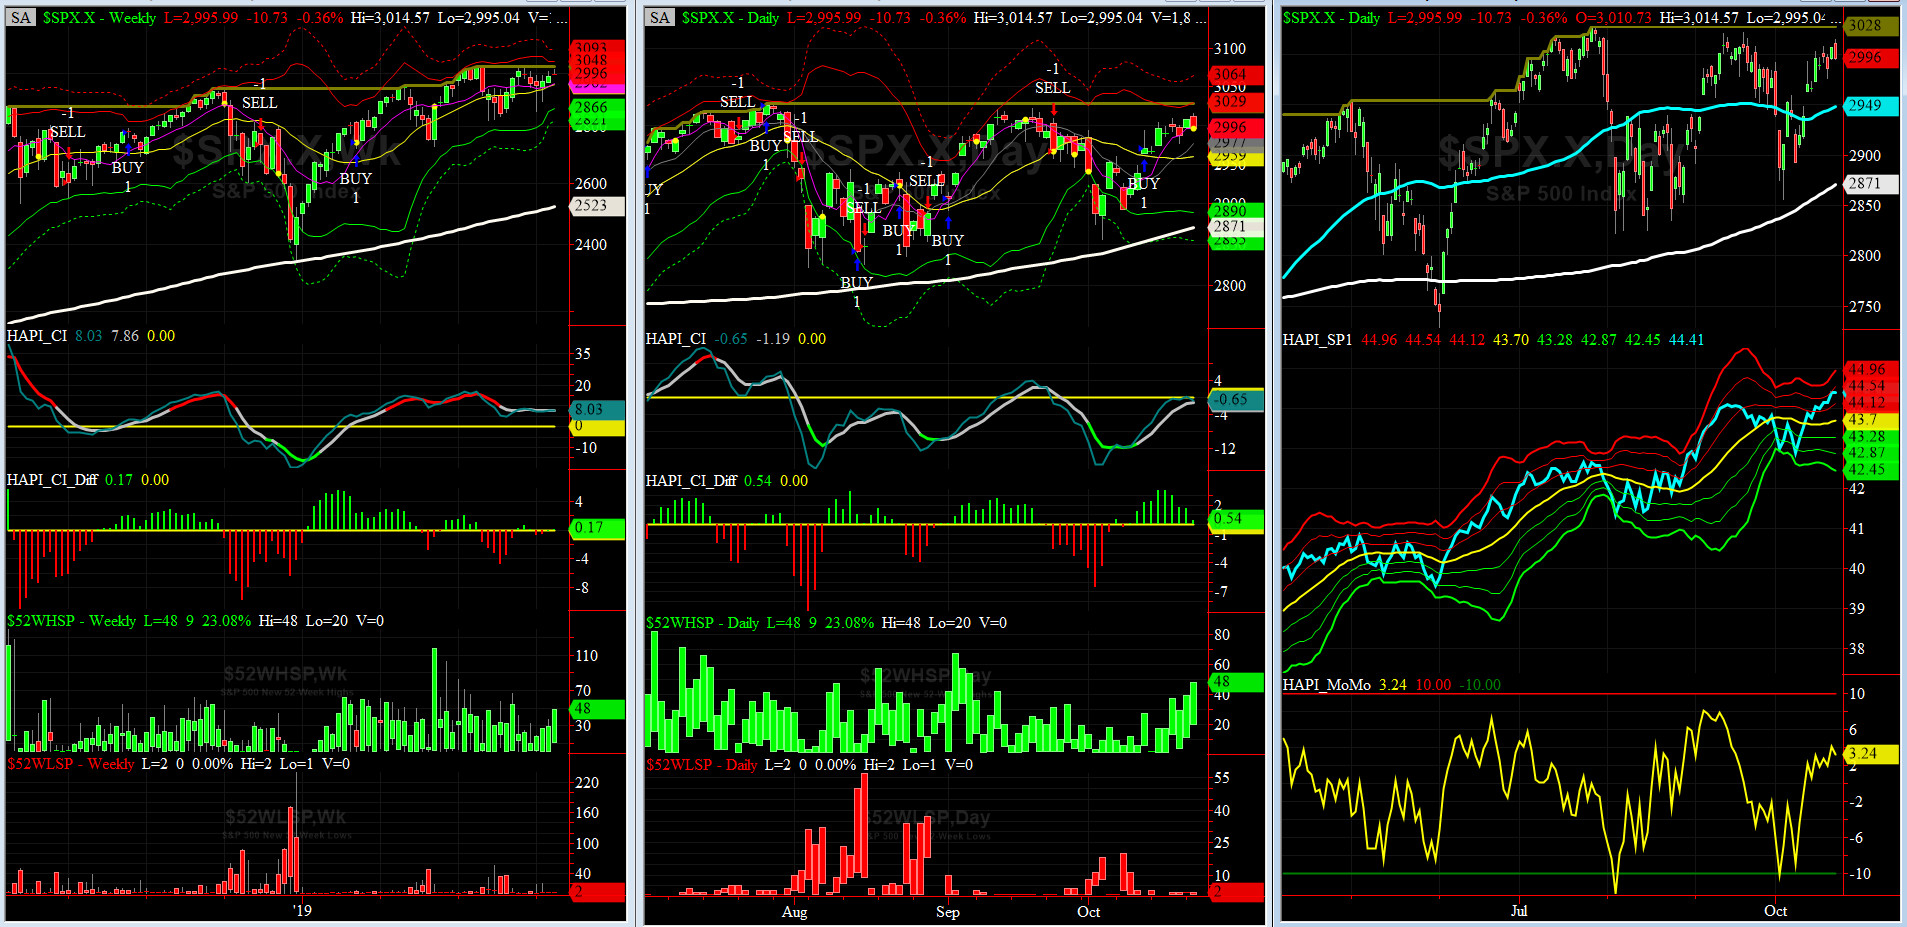
HA_SP1_Momo Chart
WEEKLY Timing Model = on a BUY Signal since Friday, March 8, 2019 CLOSE at 2743
DAILY Timing Model = on a BUY Signal since Friday, October 11, 2019 CLOSE at 2970
Max SPX 52wk-highs reading last week = 48 (over 120-140, the local maxima is in)
Max SPX 52wk-Lows reading last week = 2 (over 40-60, the local minima is in)
HA_SP1 closed near its +2 sigma channels
HA_Momo = +3.25 (reversals most likely occur above +10 or below -10)
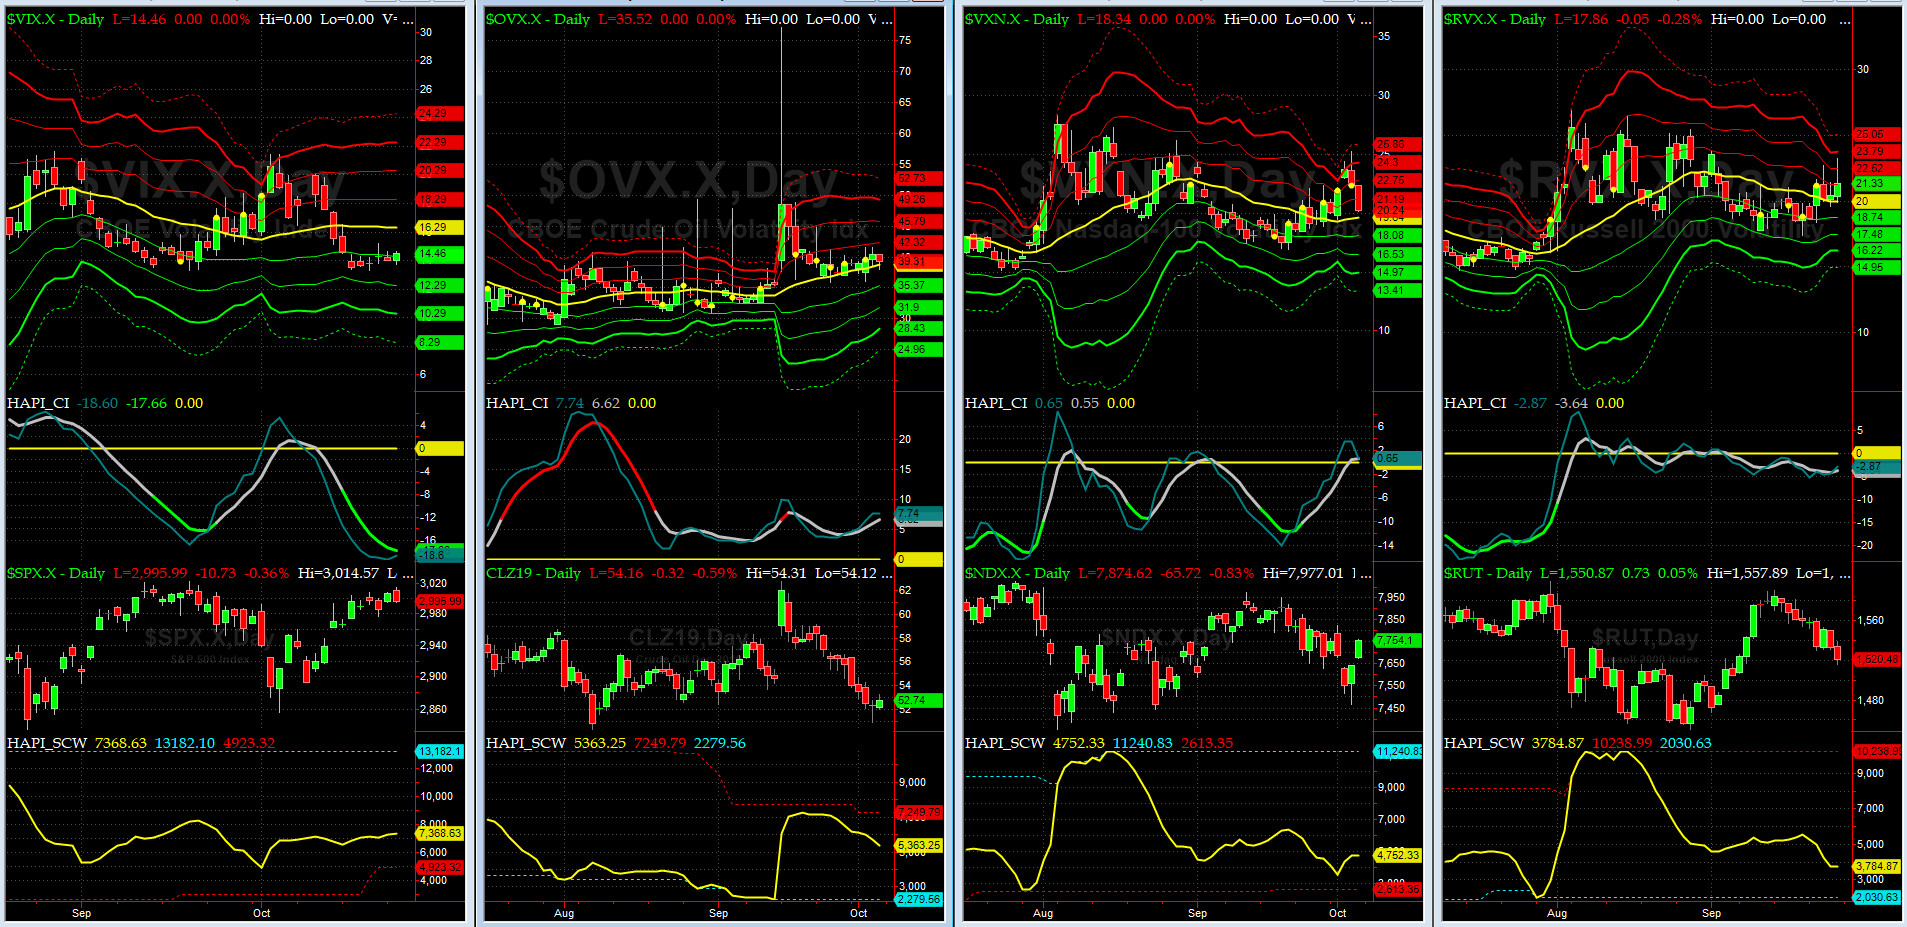
Vol of the Vols Chart
Spot VIX stood at 14.5 Friday night, a tad below its -1 sigma (remember it's the VIX volatility pattern aka "its sigma channels" that matters, and not the level of VIX itself (this is per Dr. Robert Whaley, a great mentor and inventor of original VIX, now called VXO). VIX usually peaks around a test of its +4 sigma).
The past shockwave is all but gone for now.....
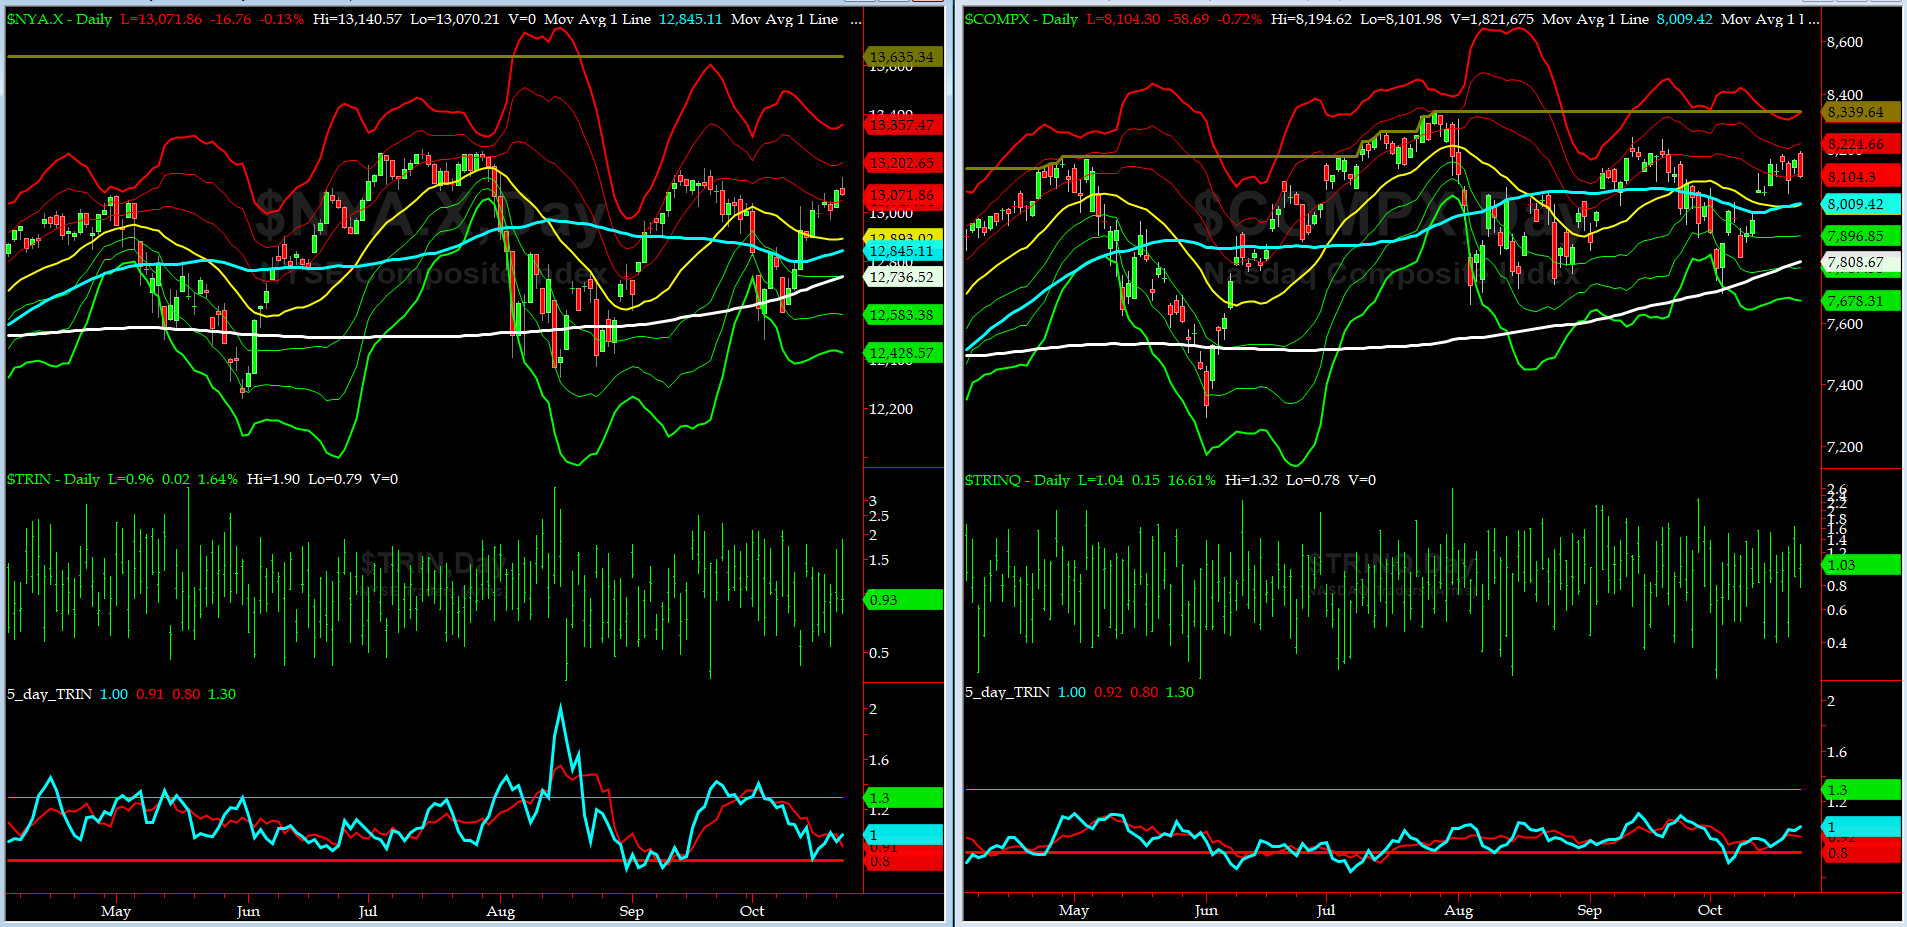
5-day TRIN & TRINQ Charts
Both NYSE & NASDAQ 5-day TRINs are in NEUTRAL zone.
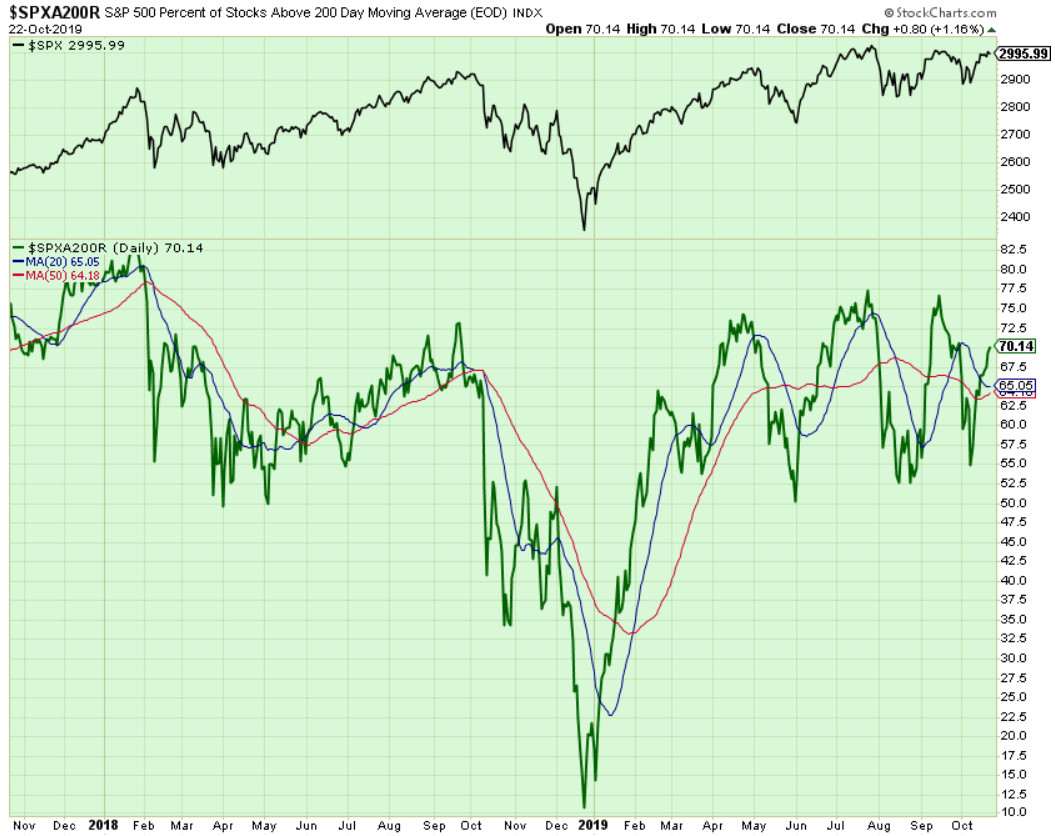
Components of SPX above their respective 200-day MA Chart
This scoring indicator closed today at 70.1% which in the upper-end of overbought region. We must keep an eye on this indicator this week.
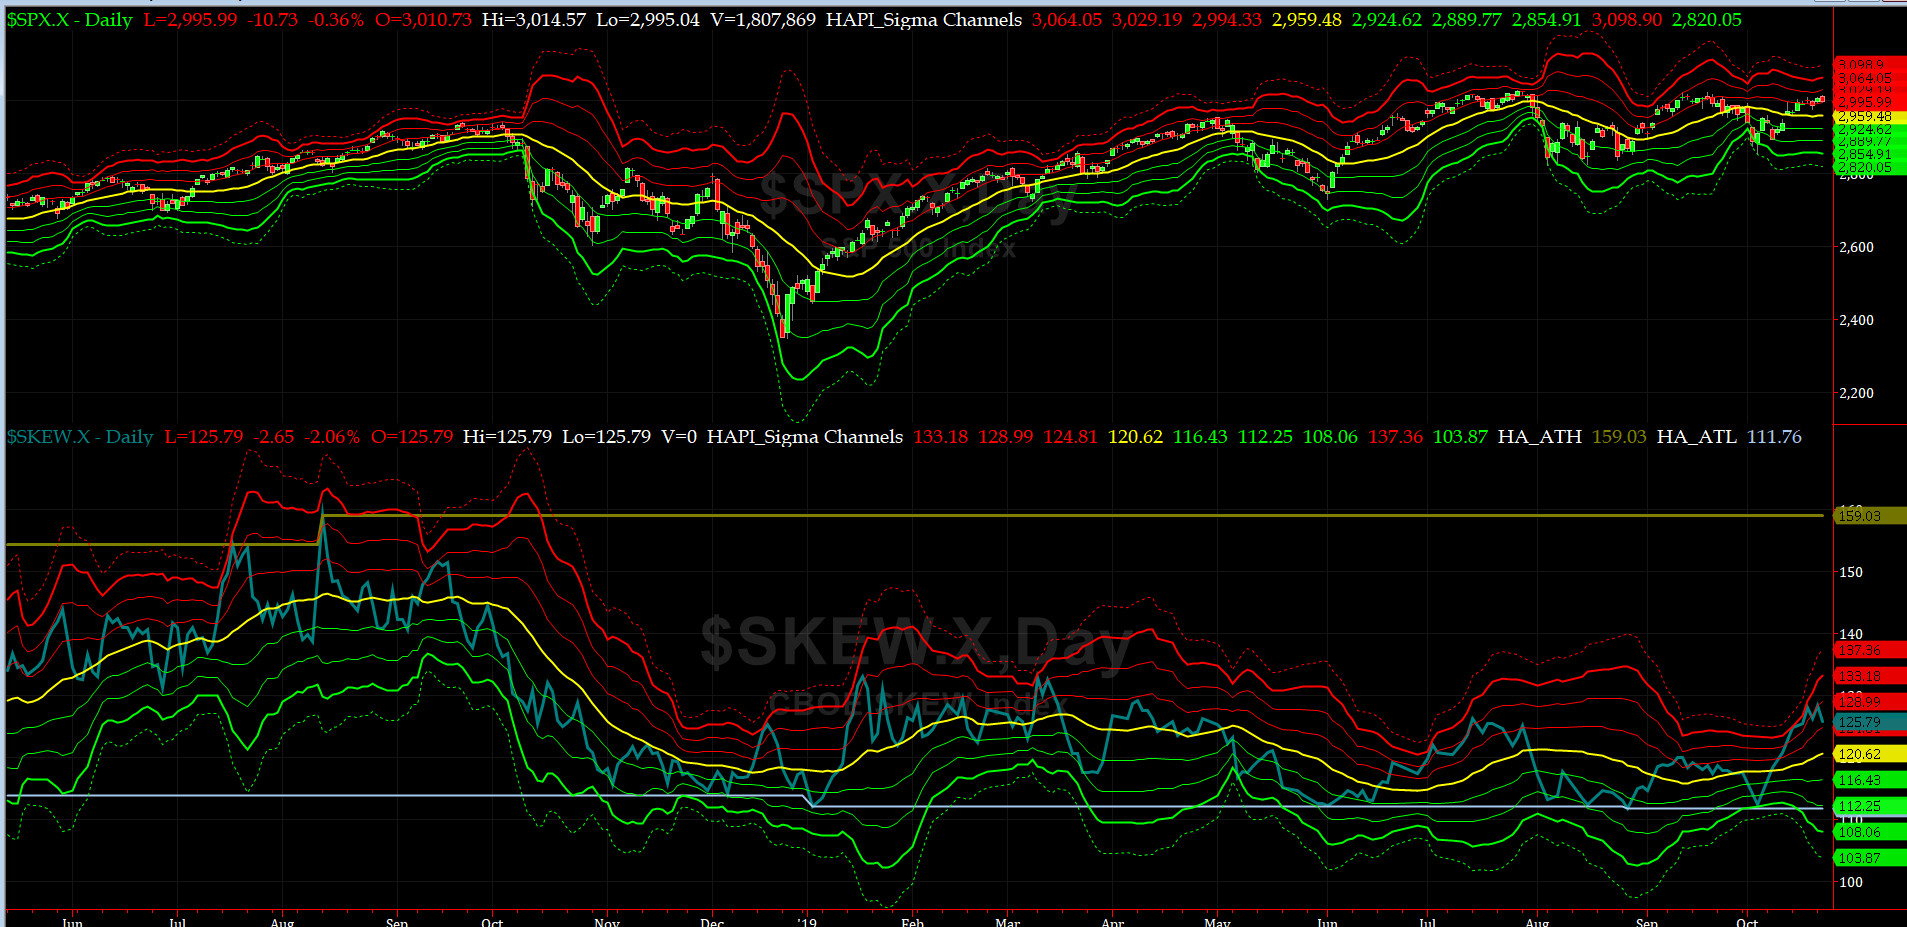
SPX SKEW (Downside Tail Risk) Chart
On Friday, SPX SKEW (Downside Tail Risk) rose pretty sharply to 125.9, now just a tad above its +1 sigma (normal = 115, range 100-150).
All quiet on the Eastern & Mid-Western Fronts? our beloved HRH Capt. Tiko, KCPE, says NO. "What is the catalyst?" no one knows but stay alert
How to interpret the value of SPX SKEW? (from CBOE white paper on SKEW)


3-month VIX Futures Spread(VX) Chart
This popular timing indicator for identifying tradable bottoms, (now long NOV19, & short FEB20 VIX Futures) hit -2.11 today at the Close. We are near overbought zone here.
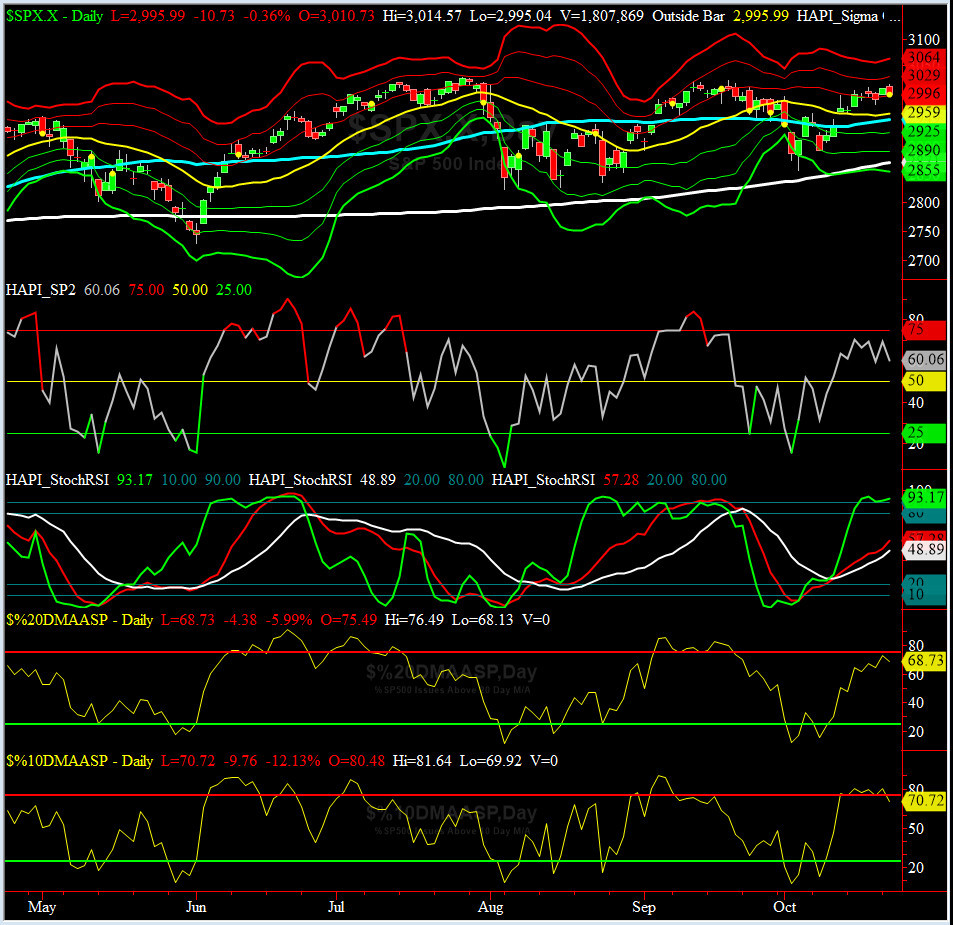
HA_SP2 Chart
HA_SP2 = 60.1 (Buy signal <= 25, Sell Signal >= 75)
This indicator has dropped from almost OVERBOUGHT zone down to mildly NEUTRAL zone.
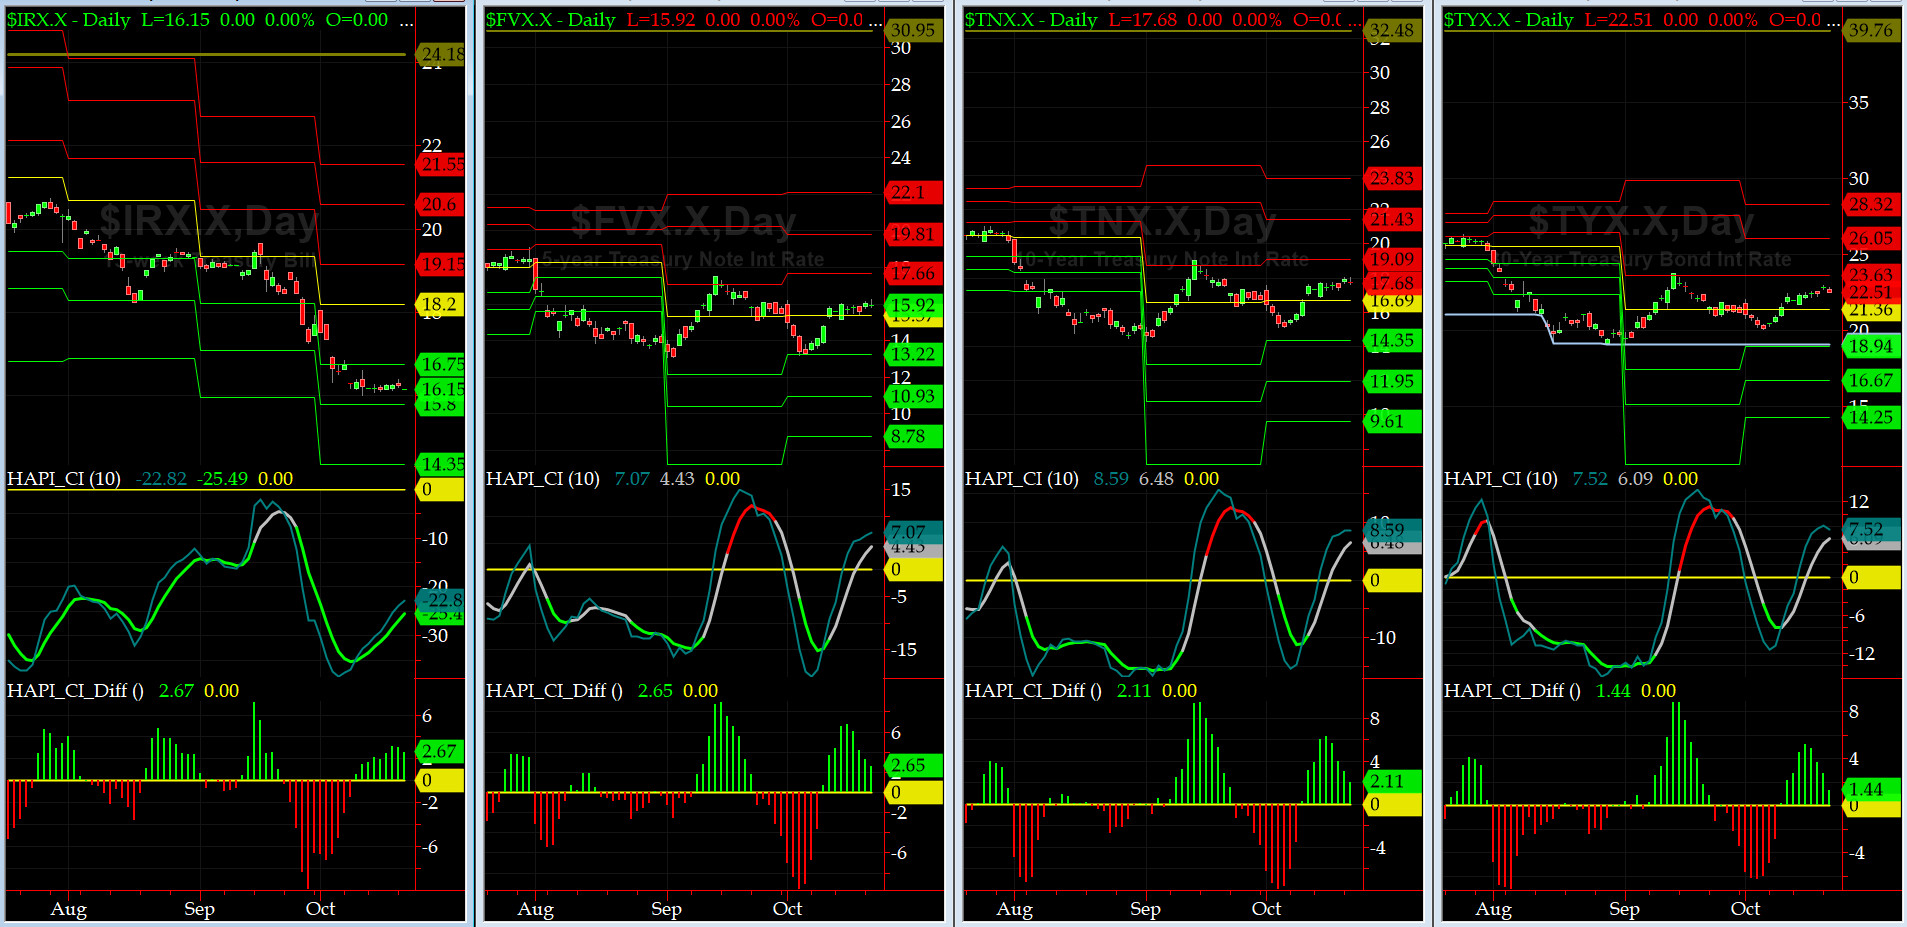
US Treasury T-Notes & T-Bonds Yields Chart
The Yield Curve (both front and back end) have been fairly flat here for last 7 trading days.
Fari Hamzei
|


 Proactive Market Timing