
|
 |
 |
 |
 |
 |
 |
 |
 |
 Proactive Market Timing Proactive Market Timing
|
|
|
Most Recent PMT vs SPX Performance Chart

|
|
|
|
Wednesday, November 20, 2019, 1324ET
SPECIAL PARTIAL EXIT Email, Issue #314
Cover your at least 3/4 of your put spread
For all practial purposes, we hit our primary profit traget of 3090 for PMT Issue #314
SPX LoD was put in less than 5-min ago at 3091.41
Cheers
------------------------------------------------------
SPX is trading at 3091.55 now
SPY is trading at 309.06 now
The midpoint price for our Long Put leg is trading approximately at 6.05 now
The midpoint price for our Short Put leg is trading approximately at 3.53 now
Therefore, the midpoint price for our Put Spread is trading approximately at 2.52 now
@Capt_Tiko: EXECUTE�.. EXECUTE�..EXECUTE����
Fari Hamzei
|
|
|
|
|
|
Monday, November 18, 2019, 1521ET
Launch Command Email, Issue #314
PLEASE NOTE: the targets have changed since this morning and we have updated them in the panel below
SPX is trading at 3120.55 now
SPY is trading at 311.91 now
The midpoint price for our Long Put leg is trading approximately at 4.25 now
The midpoint price for our Short Put leg is trading approximately at 2.48 now
Therefore, the midpoint price for our Put Spread is trading approximately at 1.85 now
@Capt_Tiko: EXECUTE�.. EXECUTE�..EXECUTE����
Fari Hamzei
|
|
|
|
|
|
Monday, November 18, 2019, 1515 ET
**UPDATED** Targets & Trade Setup for Issue #314
Our current Market Bias with Timer Digest is SHORT SPX as of OCT 22 from 2995
Our previous Market Bias was FLAT SPX as of OCT 15 from 2995
Here are the trade parameters for this week:
SPX Money Management Stop for 100% of our position = 3140
SPX BreakEven Stop (Current Price) for last 20% of our position = 3120
SPX Primary Profit Target for first 80% of our position = 3090
SPX Secondary Profit Target for last 20% of our position = 3070
|
| Action |
Asset |
Expiration |
Strike |
Option |
Mid-Point |
| BUY |
SPY |
Friday DEC 20 |
312 |
Puts |
4.30 |
| SELL SHORT |
SPY |
Friday DEC 20 |
306 |
Puts |
2.40 |
| You need to execute both legs and hold it as a Put-Spread.
|
Note A:
Once the Primary Profit Target has been reached, traders are advised to close 80% of their position in order to lock in profits. The remaining balance can be carried over with a BreakEven STOP, based on the SPX level at the time of entry, in order to make the trade a zero-risk trade with the final position running to reach the Secondary Profit Target.
Once either Secondary Profit or Money Management (BreakEven STOP after the 80% peel-off) is hit, our Option/ETF trade for that week is over. Go to Cash and wait for the next PMT Issue.
Note B:
When we change our Market Bias with Timer Digest, You need to go FLAT asap. With PMT Pro, that is before the Close that day and with the basic PMT, at the open of the next day. The following trading day, we will issue new SPX targets and a new SPY options trade, as long our new market bias with Timer Digest is NOT flat.
Fari Hamzei
|
|
|
|
|
|
Monday, November 18, 2019, 1115ET
WEEKLY Support, Pivot & Resistance Levels for Issue #314
|
|
|
|
|
|
Monday, November 18, 2019, 1110 ET
Targets & Trade Setup for Issue #314
Our current Market Bias with Timer Digest is SHORT SPX as of OCT 22 from 2995
Our previous Market Bias was FLAT SPX as of OCT 15 from 2995
Here are the trade parameters for this week:
SPX Money Management Stop for 100% of our position = 3140
SPX BreakEven Stop (Current Price) for last 20% of our position = 3117
SPX Primary Profit Target for first 80% of our position = 3090
SPX Secondary Profit Target for last 20% of our position = 3065
|
| Action |
Asset |
Expiration |
Strike |
Option |
Mid-Point |
| BUY |
SPY |
Friday DEC 13 |
311 |
Puts |
3.03 |
| SELL SHORT |
SPY |
Friday DEC 13 |
305 |
Puts |
1.59 |
| You need to execute both legs and hold it as a Put-Spread.
|
Note A:
Once the Primary Profit Target has been reached, traders are advised to close 80% of their position in order to lock in profits. The remaining balance can be carried over with a BreakEven STOP, based on the SPX level at the time of entry, in order to make the trade a zero-risk trade with the final position running to reach the Secondary Profit Target.
Once either Secondary Profit or Money Management (BreakEven STOP after the 80% peel-off) is hit, our Option/ETF trade for that week is over. Go to Cash and wait for the next PMT Issue.
Note B:
When we change our Market Bias with Timer Digest, You need to go FLAT asap. With PMT Pro, that is before the Close that day and with the basic PMT, at the open of the next day. The following trading day, we will issue new SPX targets and a new SPY options trade, as long our new market bias with Timer Digest is NOT flat.
Fari Hamzei
|
|
|
|
|
|
Monday, November 18, 2019, 0915ET
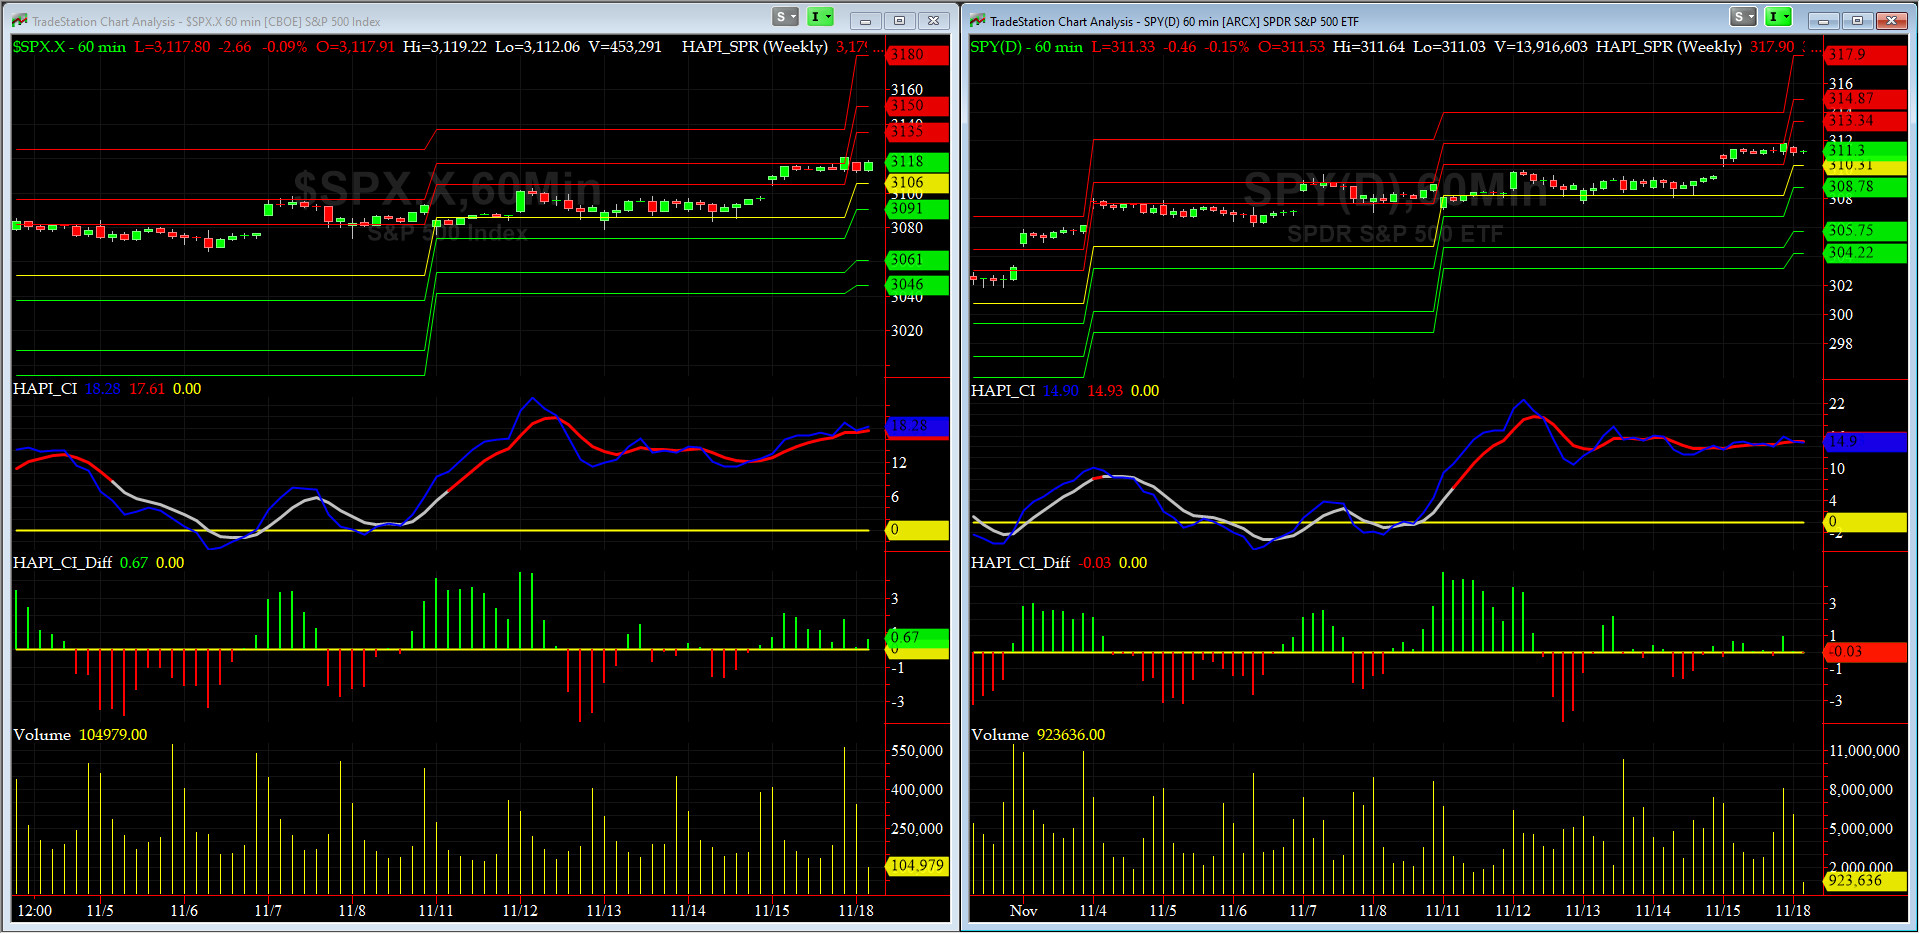
Market Timing Charts, Analysis & Commentary for Issue #314
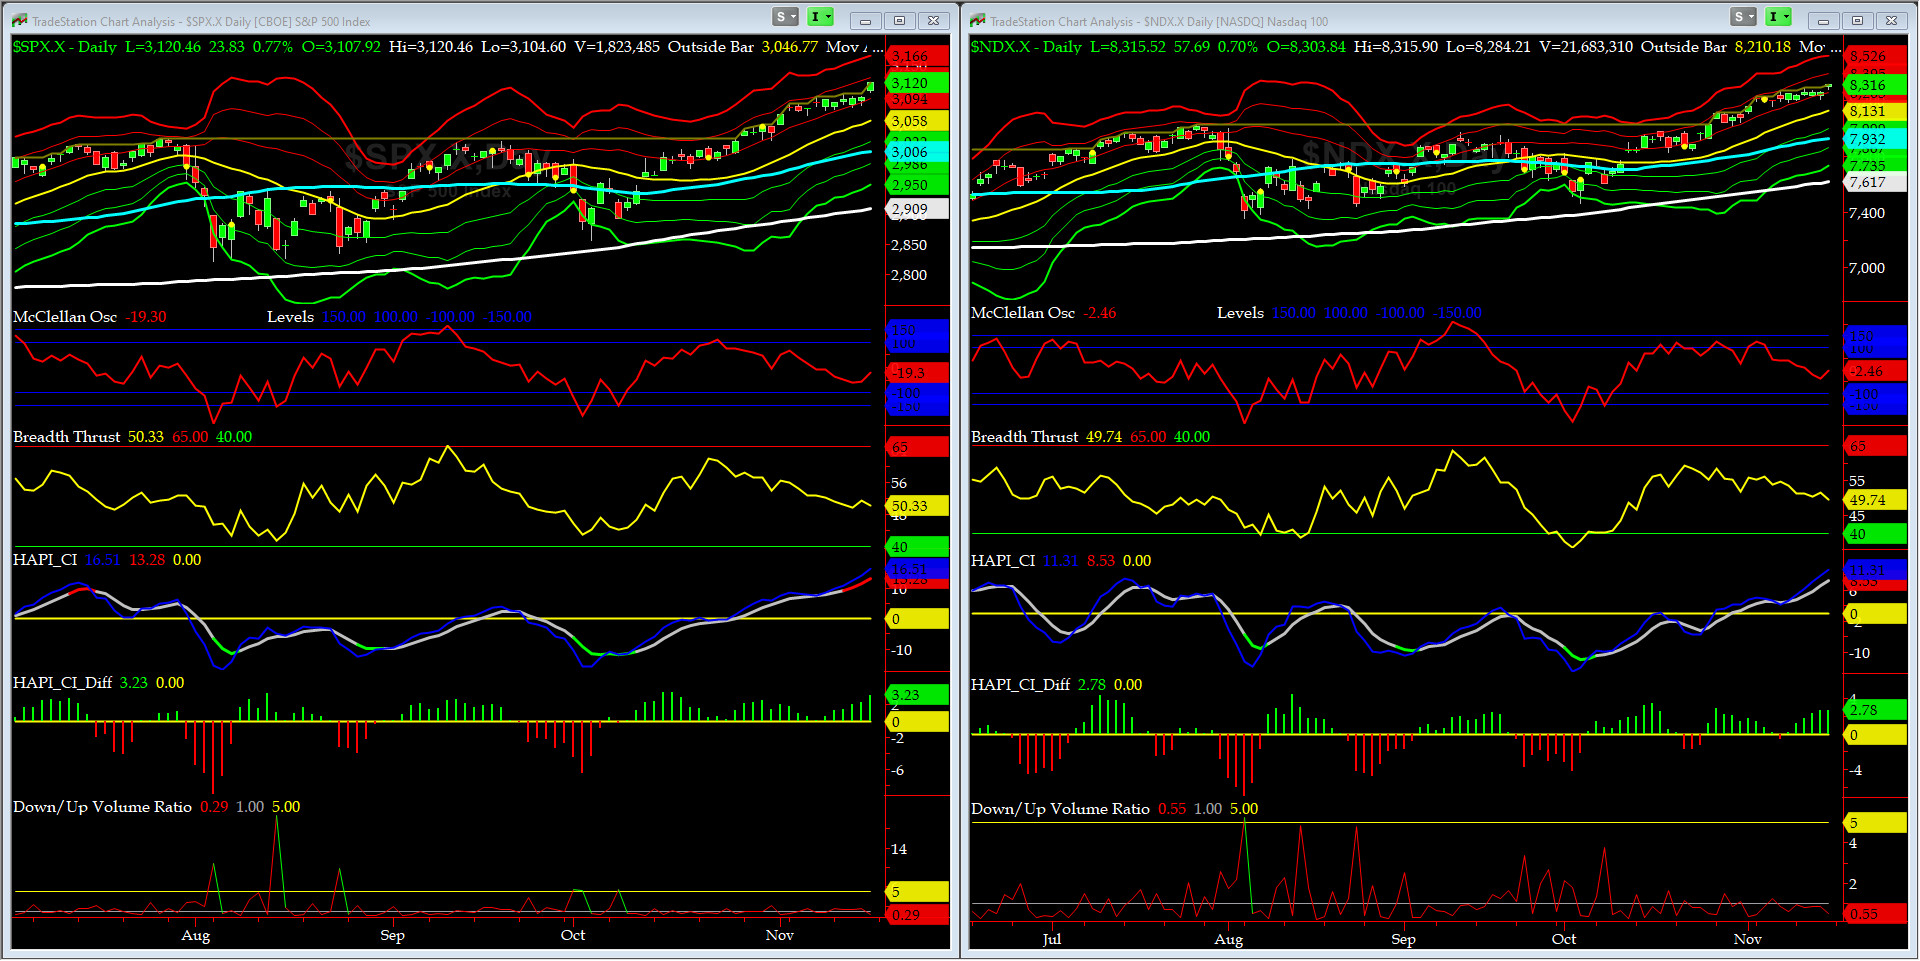
Timer Charts of S&P-500 Cash Index (SPX) + NASDAQ-100 Cash Index (NDX)
Most recent S&P-500 Cash Index (SPX) Close: 3120 up +33 (up +1.07%) for the four trading days ending on Friday, November 15, 2019, which closed very near its +2 sigma.
DJIA ALL TIME INTRADAY HIGH = 28004 (reached on Friday, November 15, 2019)
DJT ALL TIME INTRADAY HIGH = 11623 (reached on Friday, September 14, 2018)
SPX ALL TIME INTRADAY HIGH = 3120 (reached on Friday, November 15, 2019)
NDX ALL TIME INTRADAY HIGH = 8316 (reached on Friday, November 15, 2019)
RUT ALL TIME INTRADAY HIGH = 1742 (reached on Friday, August 31, 2018)
Current DAILY +2 Sigma SPX = 3130 with WEEKLY +2 Sigma = 3112
Current DAILY 0 Sigma SPX = 3058 with WEEKLY 0 Sigma = 2984
Current DAILY -2 Sigma SPX = 2986 with WEEKLY -2 Sigma = 2856
NYSE McClellan Oscillator = -19 (-150 is start of the O/S area; around -275 to -300 area or lower, we go into the �launch-pad� mode; over +150, we are in O/B area)
NYSE Breadth Thrust = 50.33 (40 is considered as oversold and 65 as overbought)
Bearish Divergences continue show up specially SPX + NDX vs TRAN + RUT no new highs. We will stay short SPX. We continue to believe that we should be nearing some form of fireworks any day now.
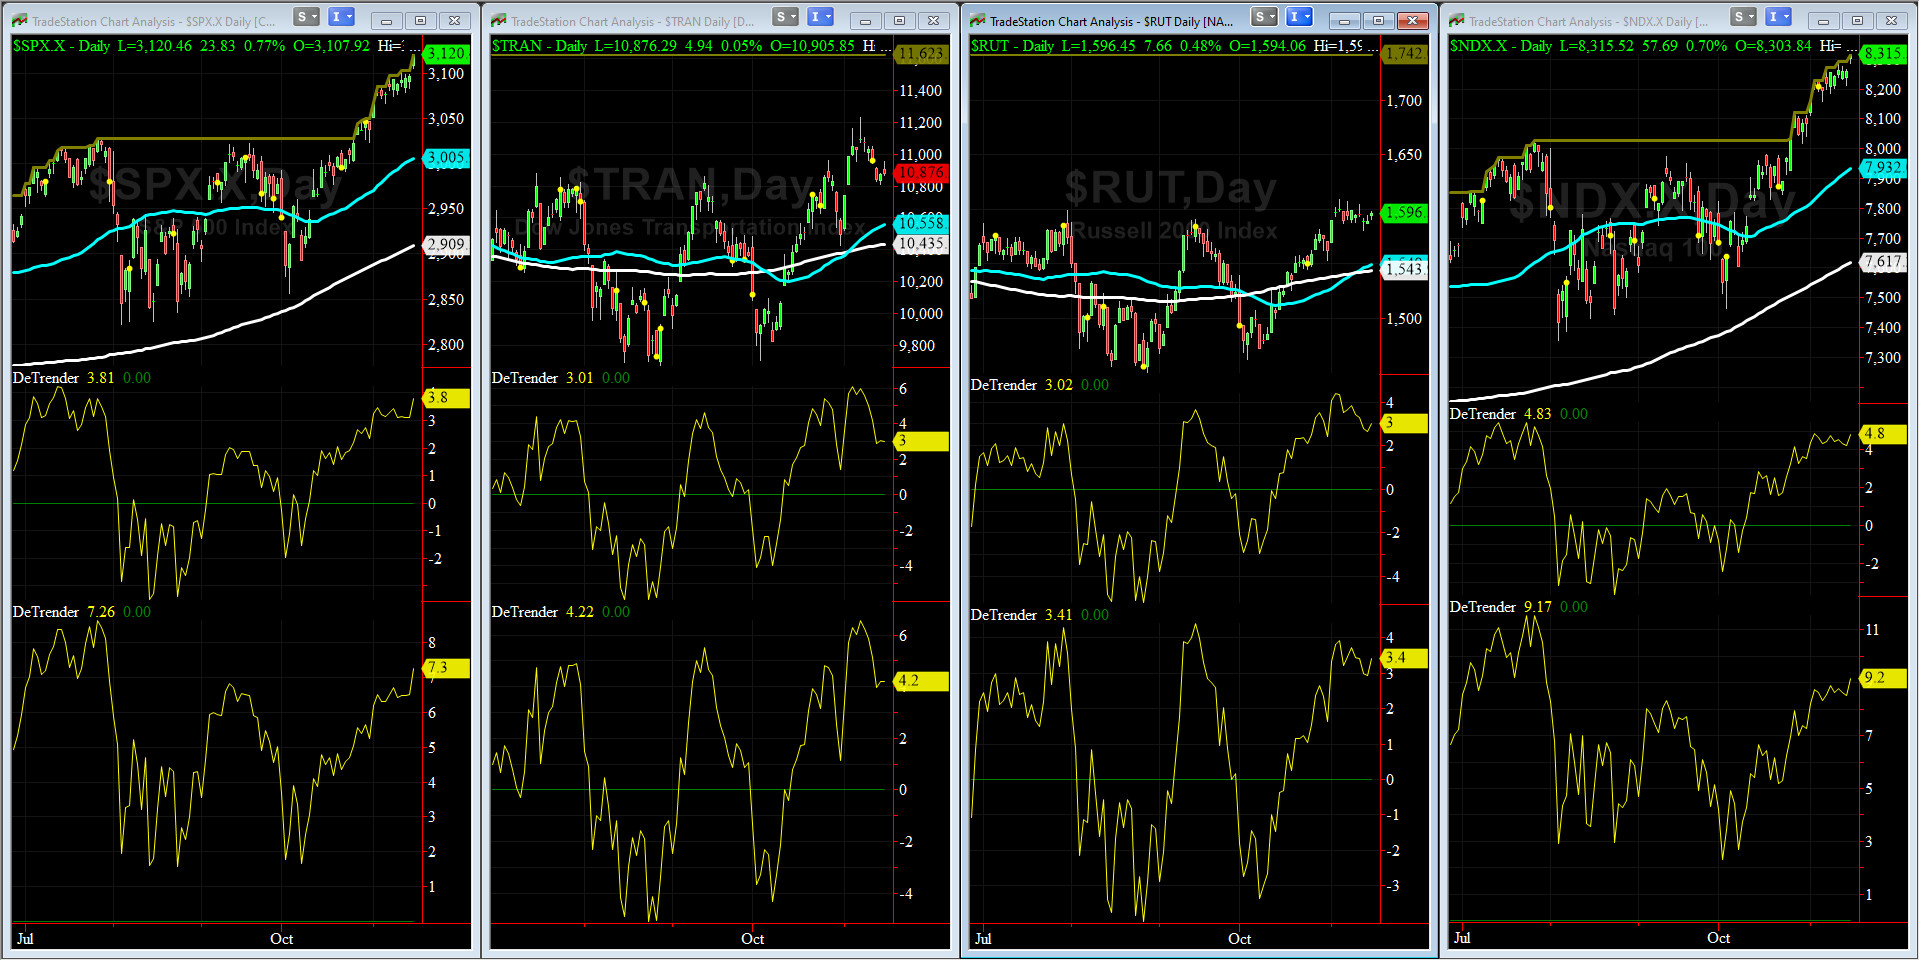
DeTrenders Charts for SPX, NDX, TRAN & RUT Indices
200-Day MA DJ TRAN = 10,435 or 4.2% ABOVE the DJ TRAN (max observed in last 7 yrs = 20.2%, min = -20.3%)
200-Day MA RUT = 1543 or 3.4% ABOVE RUT (max observed in last 7 yrs = 21.3%, min = -22.6%)
50-Day MA SPX = 3005 or 3.8% BELOW SPX (max observed in last 7 yrs = +8.6%, min = -9.3%)
200-Day MA SPX = 2909 or 7.3% BELOW SPX (max observed in last 7 yrs = 15.2%, min = -14%)
DJ Transportation Index (proxy for economic conditions 6 to 9 months hence) had a bad week again.
Russell 2000 Small Caps Index (proxy for Risk ON/OFF) also had a bad week. RISK ON remains so-so.
All EIGHT of our EIGHT DeTrenders are in the POSITIVE territory. The DeTrenders for DJ Tran & RUT will continue to be harbingers of future price behavior in broad indices.
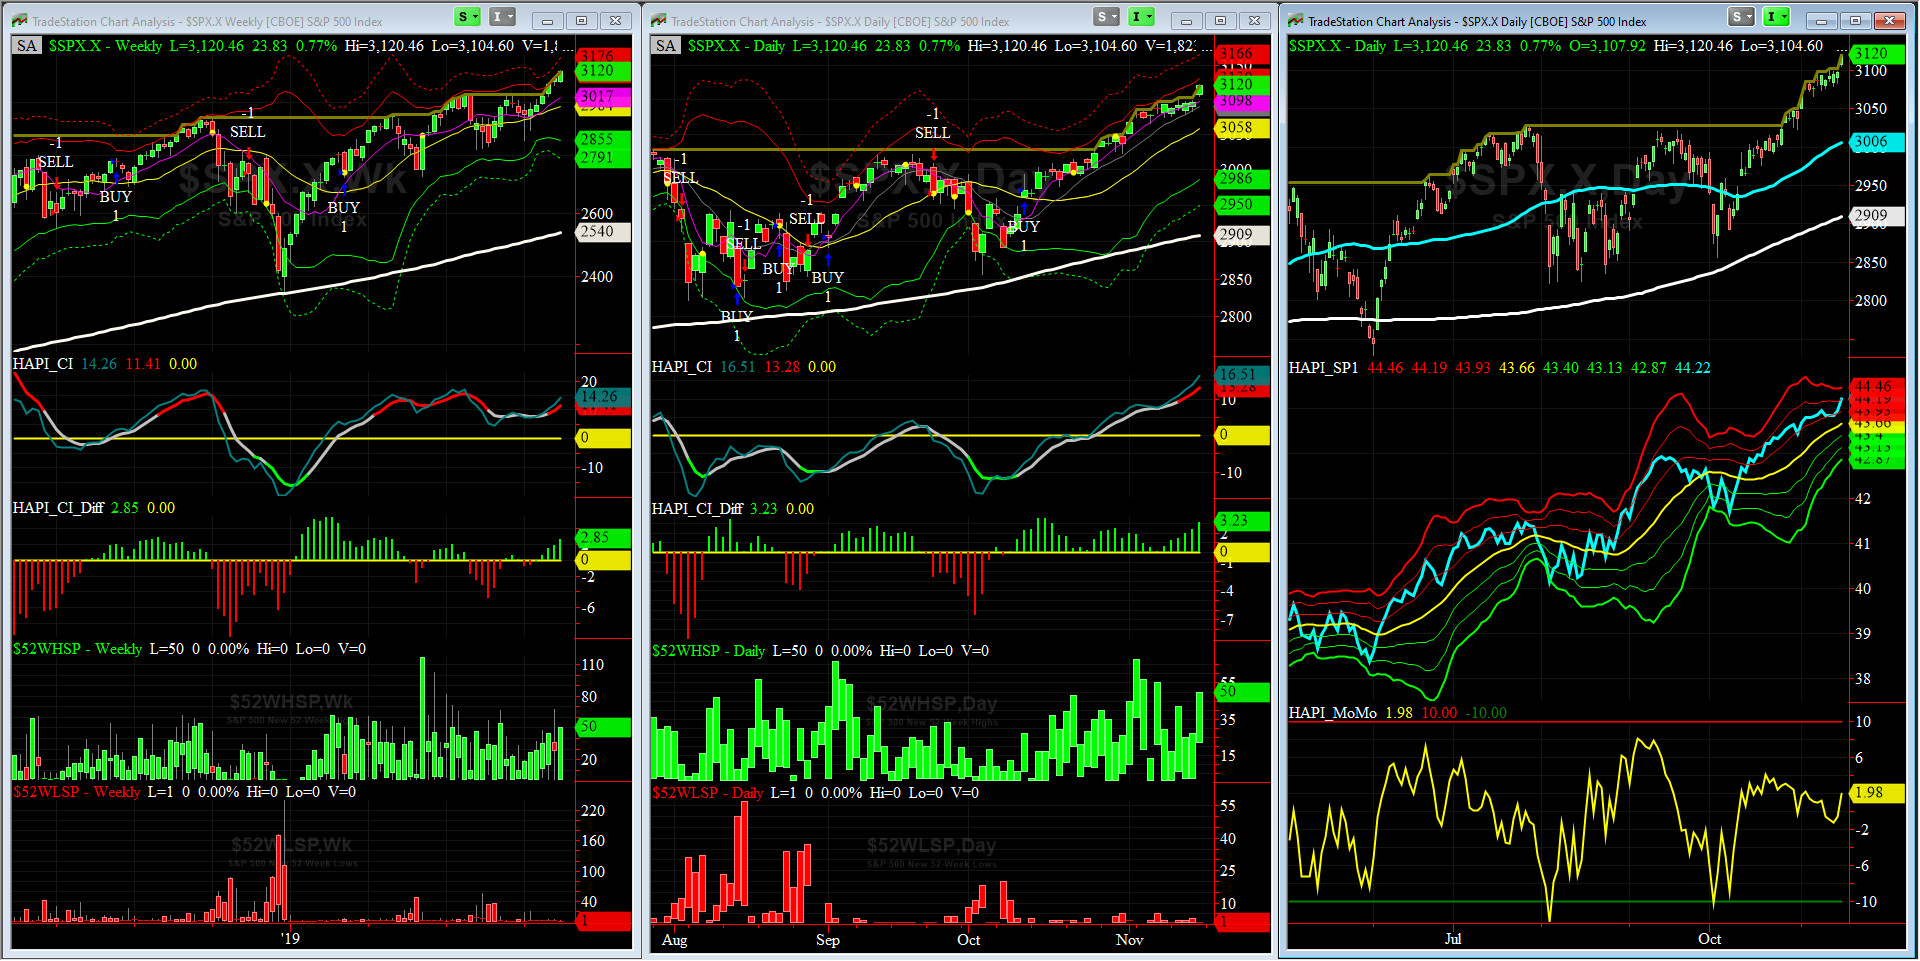
HA_SP1_Momo Chart
WEEKLY Timing Model = on a BUY Signal since Friday, March 8, 2019 CLOSE at 2743
DAILY Timing Model = on a BUY Signal since Friday, October 11, 2019 CLOSE at 2970
Max SPX 52wk-highs reading last week = 50 (over 120-140, the local maxima is in)
Max SPX 52wk-Lows reading last week = 3 (over 40-60, the local minima is in)
HA_SP1 closed near its +2 sigma channels
HA_Momo = +1.98 (reversals most likely occur above +10 or below -10)
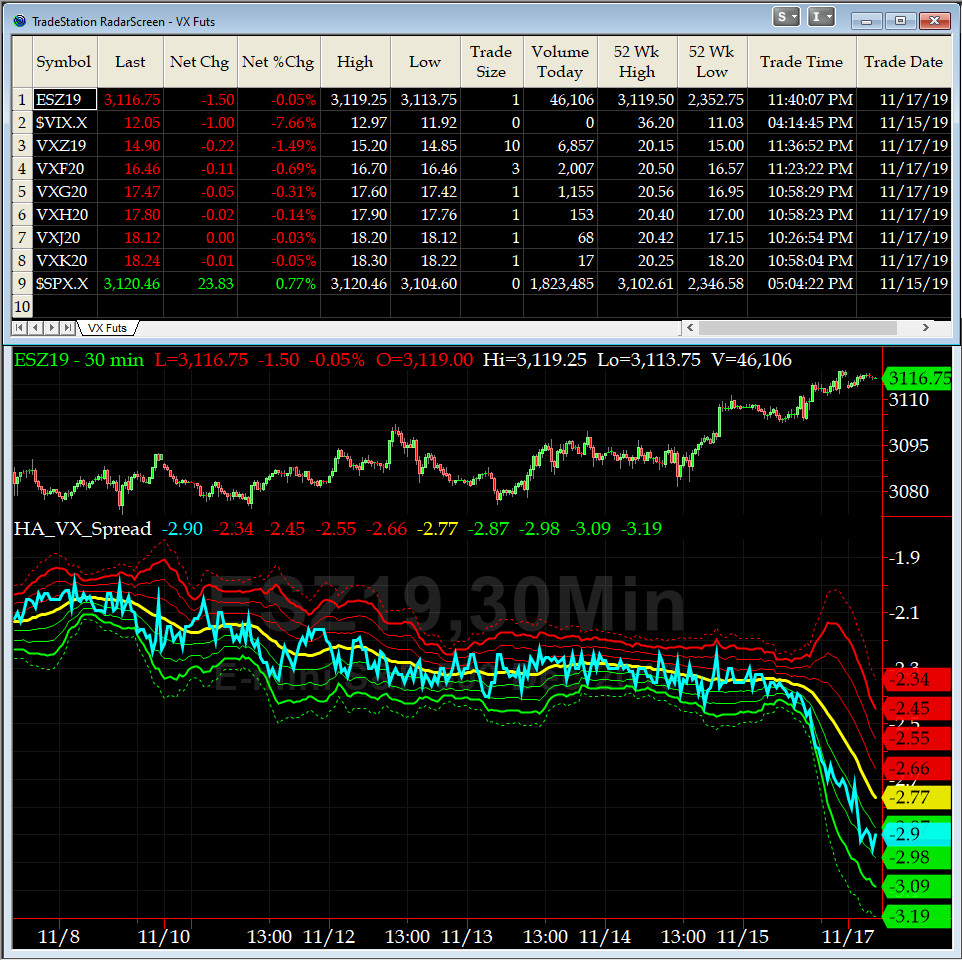
3-month VIX Futures Spread(VX) Chart
This popular timing indicator for identifying tradable bottoms, (now long DEC19, & short MAR20 VIX Futures) hit -2.9 today at the Close. We are clearly still stuck at overbought zone here.
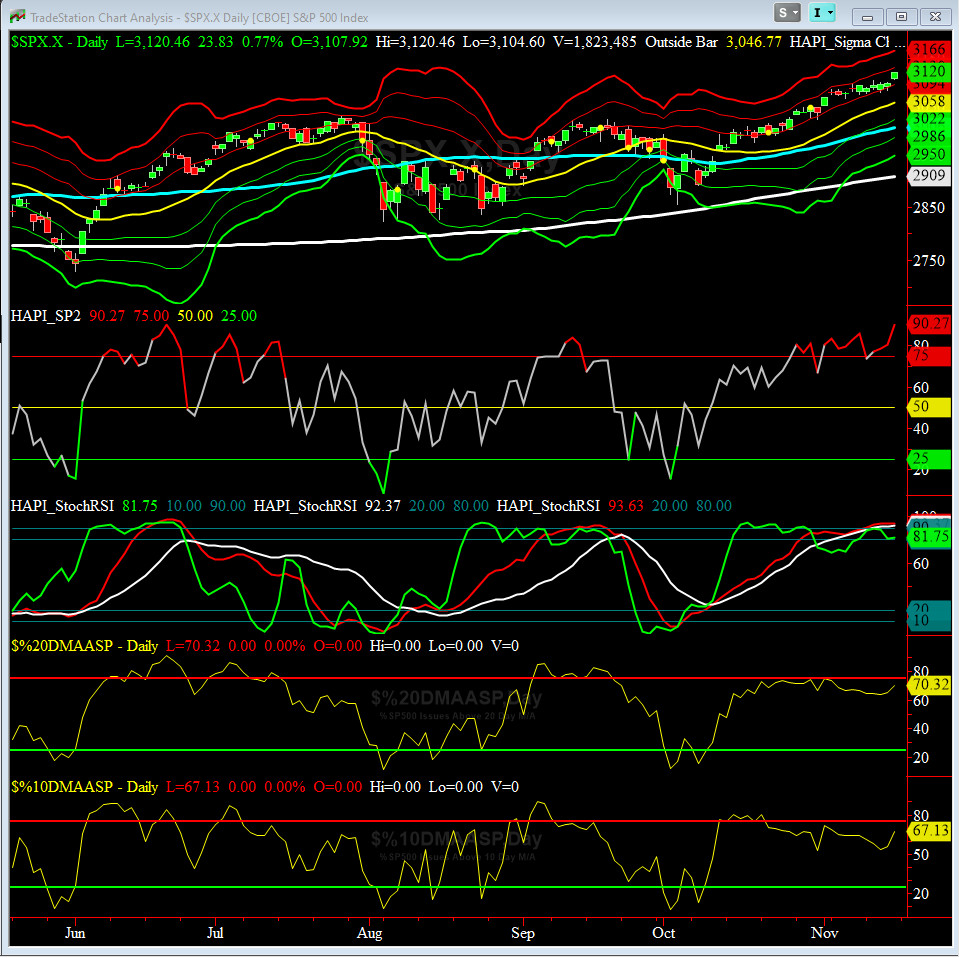
HA_SP2 Chart
HA_SP2 = 90.27 (Buy signal <= 25, Sell Signal >= 75)
This indicator has shows signs that the overall market is VERY VERY OVERBOUHT & tired [and could be susceptible to a pullback].
Fari Hamzei
|
|
|
|
|
|
Customer Care:
|
|
|
|
|
|
|
 |
 |
|
 |
|
 |
 |
 |
HA YouTube Channel ::: HA Blog ::: Testimonials ::: Tutorials & FAQs ::: Privacy Policy
|
Trading Derivatives (Options & Futures) contains substantial risk and is not for every investor. An investor could potentially lose all or more than his/her initial investment.
Only risk capital should be used for trading and only those with sufficient risk capital should consider trading derivatives. Past performance is not
necessarily indicative of future results. Testimonials appearing on this website may not be representative of other clients or customers
and are not a guarantee of future performance or success.
|
| (c) 1998-2025, Hamzei Analytics, LLC.® All Rights Reserved. |
|
|