|
Sunday, March 8, 2020, 1730ET
Market Timing Charts, Analysis & Commentary for Issue #320
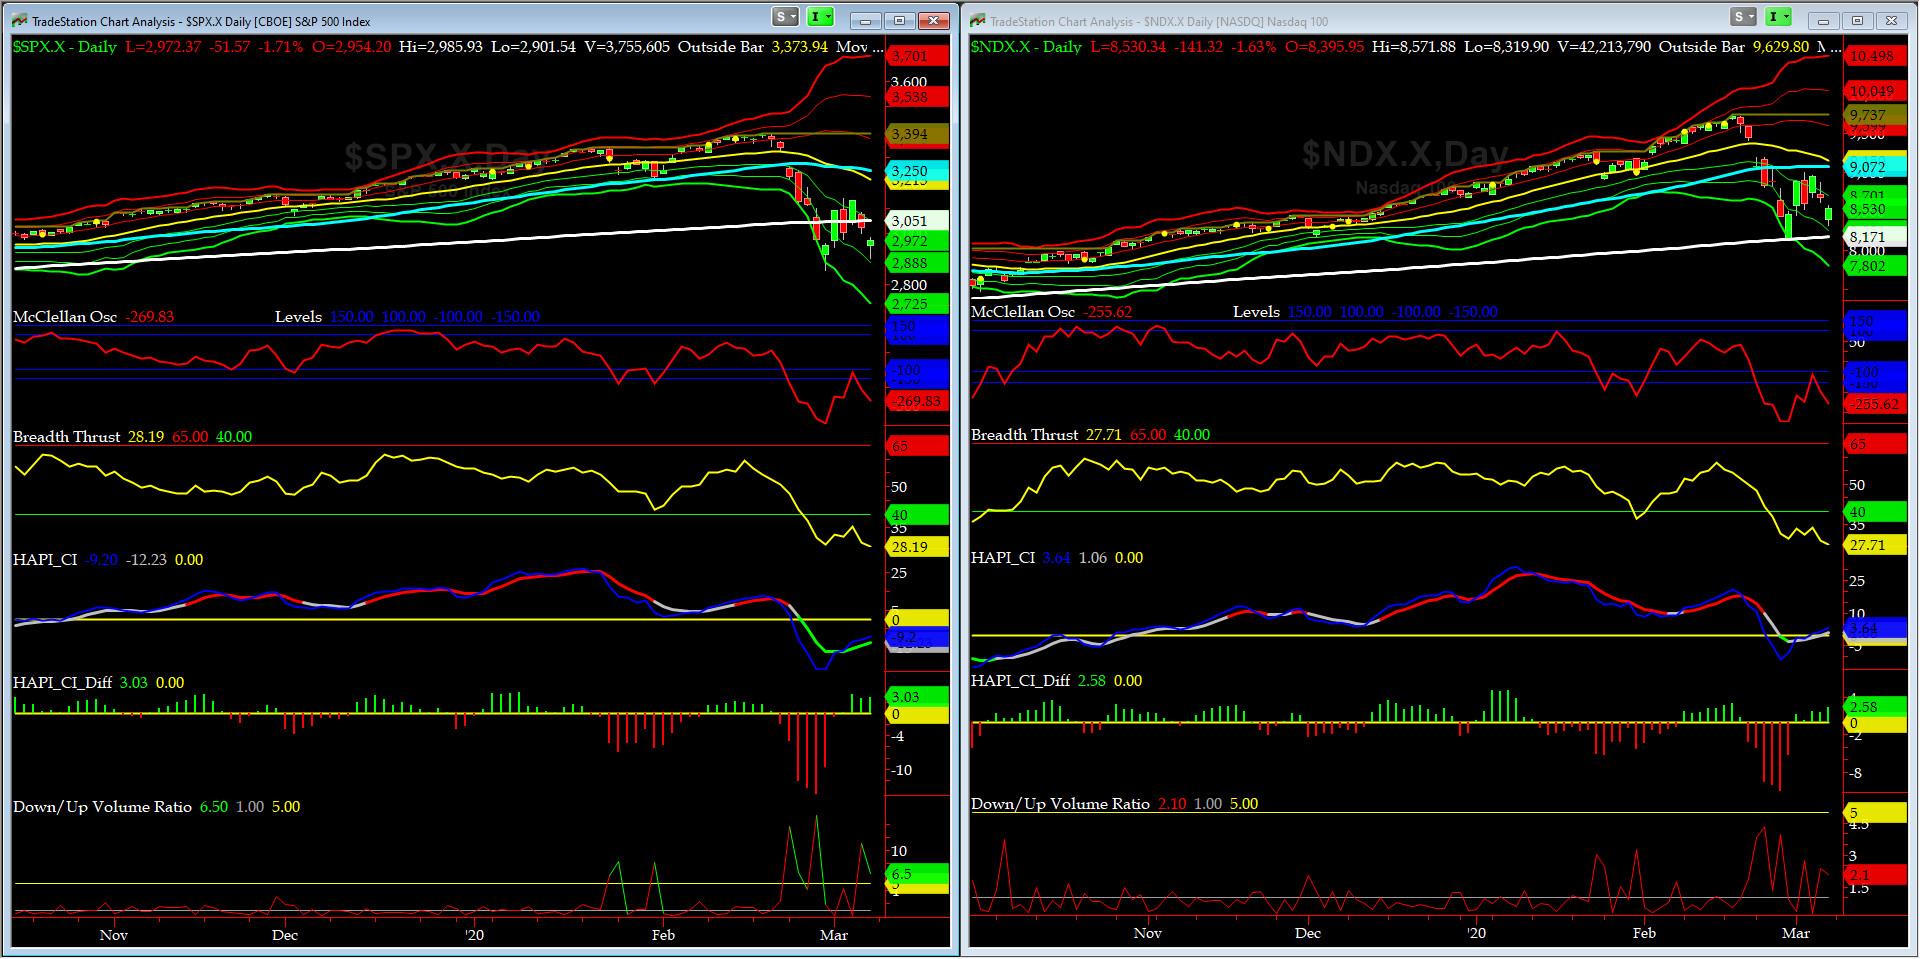
Timer Charts of S&P-500 Cash Index (SPX) + NASDAQ-100 Cash Index (NDX)
Most recent S&P-500 Cash Index (SPX) Close: 2972 down 365 (down -11%) for last two weeks days ending on Friday, March 6, 2020, which closed very near its negative 1.5 sigma.
DJIA ALL TIME INTRADAY HIGH = 29568 reached on Wednesday, February 12, 2020
DJT ALL TIME INTRADAY HIGH = 11623 reached on Friday, September 14, 2018
SPX ALL TIME INTRADAY HIGH = 3258 reached on Wednesday, February 19, 2020
NDX ALL TIME INTRADAY HIGH = 8873 reached on Wednesday, February 19, 2020
RUT ALL TIME INTRADAY HIGH = 1742 reached on Friday, August 31, 2018
Current DAILY +2 Sigma SPX = 3538 with WEEKLY +2 Sigma = 3424
Current DAILY 0 Sigma SPX = 3213 with WEEKLY 0 Sigma = 3183
Current DAILY -2 Sigma SPX = 2888 with WEEKLY -2 Sigma = 2942
NYSE McClellan Oscillator = -270 (-150 is start of the O/S area; around -275 to -300 area or lower, we go into the �launch-pad� mode; over +150, we are in O/B area)
NYSE Breadth Thrust = 28.1 (40 is considered as oversold and 65 as overbought)
This market is now totally news driven..... downside targets are first 2400 on SPX (equates to 21,700 on DJIA, Dec 18 lows) and then 2100 on SPX (= 18,000 on DJIA, Oct 16 lows).
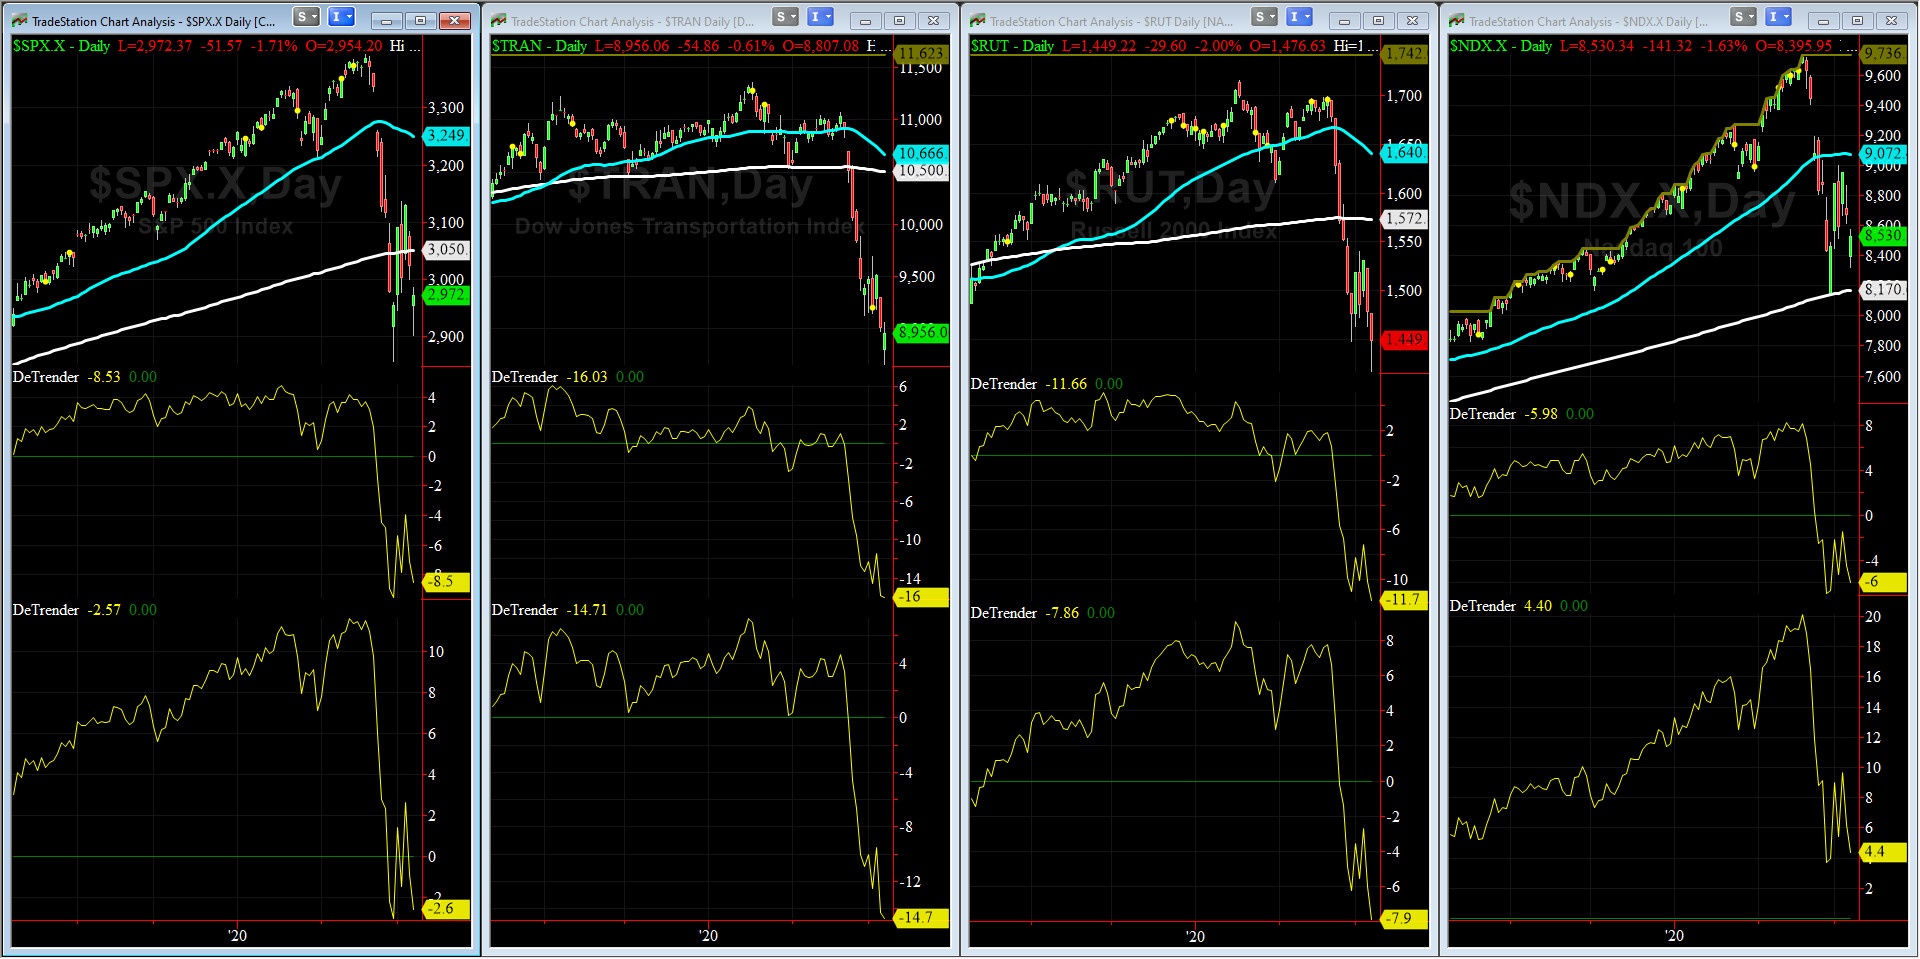
DeTrenders Charts for SPX, NDX, TRAN & RUT Indices
200-Day MA DJ TRAN = 10,500 or 14.7% ABOVE the DJ TRAN (max observed in last 7 yrs = 20.2%, min = -20.3%)
200-Day MA RUT = 1572 or 7.9% ABOVE RUT (max observed in last 7 yrs = 21.3%, min = -22.6%)
50-Day MA SPX = 3249 or 8.5% ABOVE SPX (max observed in last 7 yrs = +8.6%, min = -9.3%)
200-Day MA SPX = 3051 or 2.6% ABOVE SPX (max observed in last 7 yrs = 15.2%, min = -14%)
DJ Transportation Index (proxy for economic conditions 6 to 9 months hence) has had a horribly bloody two weeks.
Russell 2000 Small Caps Index (proxy for Risk ON/OFF) had a great week but also pulled back on Friday. RISK remains OFF for now.
Only ONE of our EIGHT DeTrenders are in the POSITIVE territory. The DeTrenders for DJ Tran & RUT will continue to be harbingers of future price behavior in broad indices.
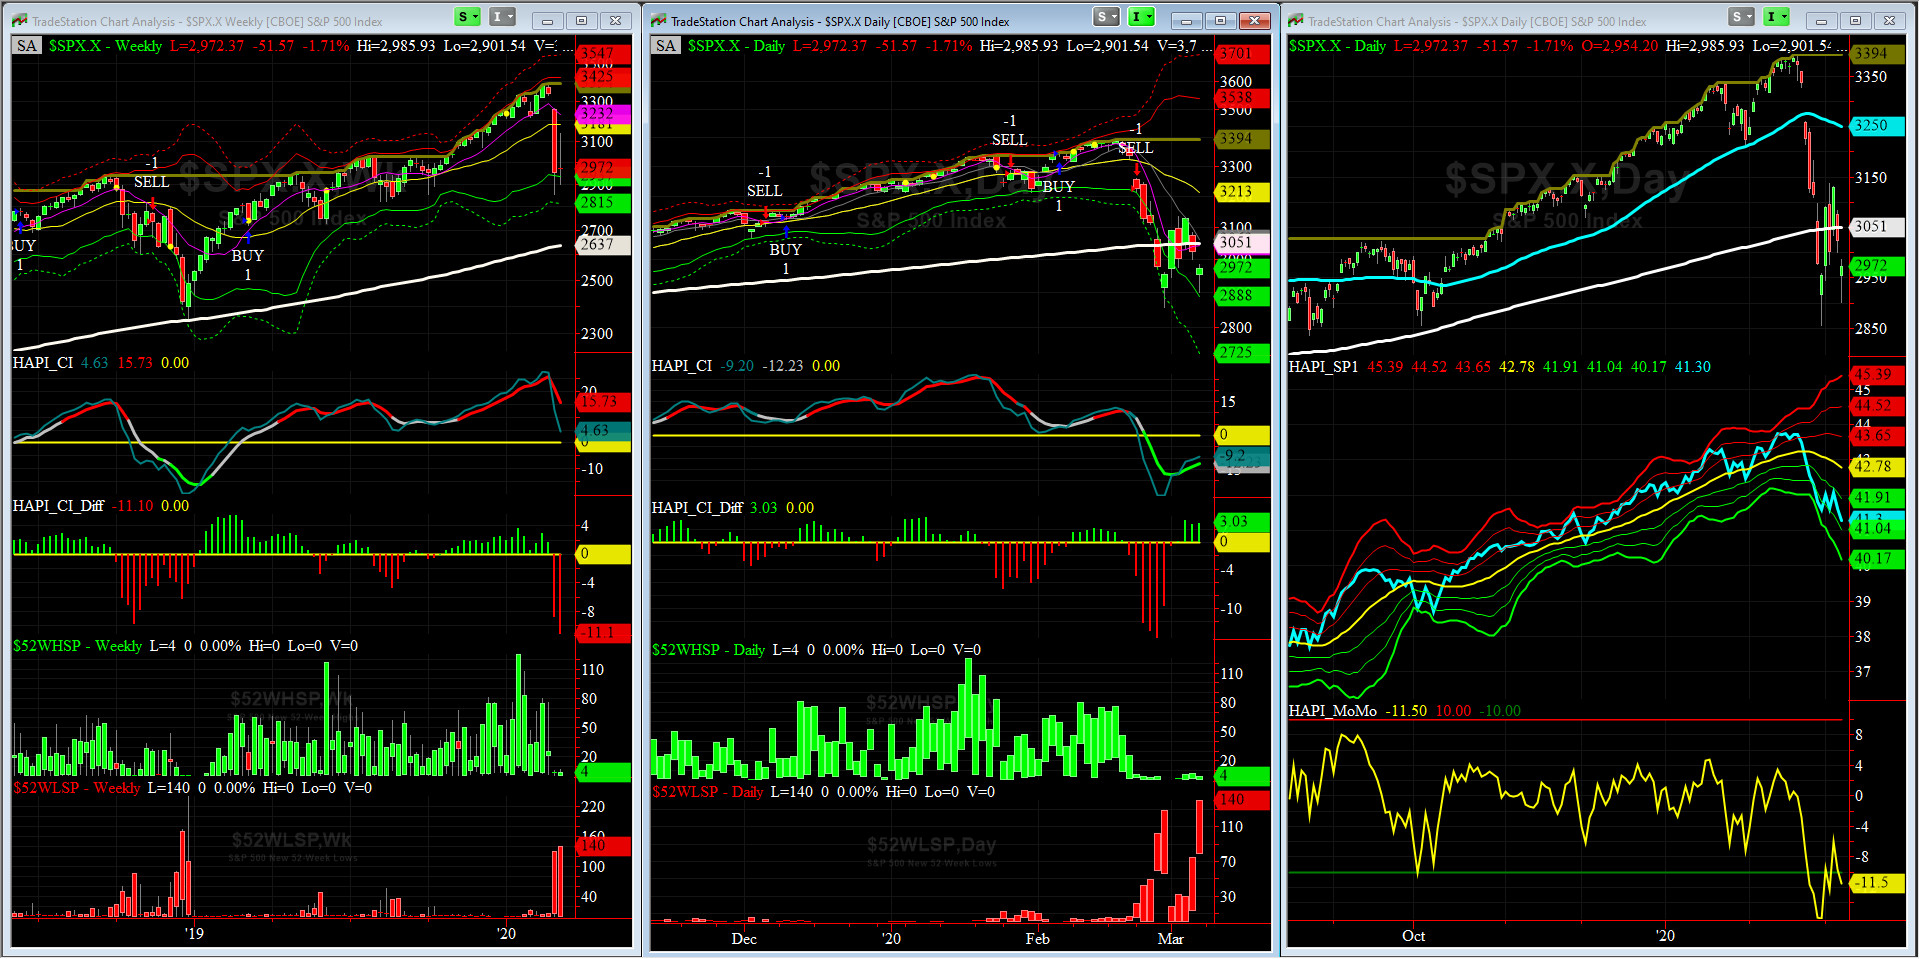
HA_SP1_Momo Chart
WEEKLY Timing Model = on a BUY Signal since Friday, March 8, 2019 CLOSE at 2743
DAILY Timing Model = on a SELL Signal since Monday, February 24, 2020 CLOSE at 3225
Max SPX 52wk-highs reading last week = 4 (over 120-140, the local maxima is in)
Max SPX 52wk-Lows reading last week = 140 (over 40-60, the local minima is in)
HA_SP1 closed near its -2 sigma channels
HA_Momo = -11.5 (reversals most likely occur above +10 or below -10)
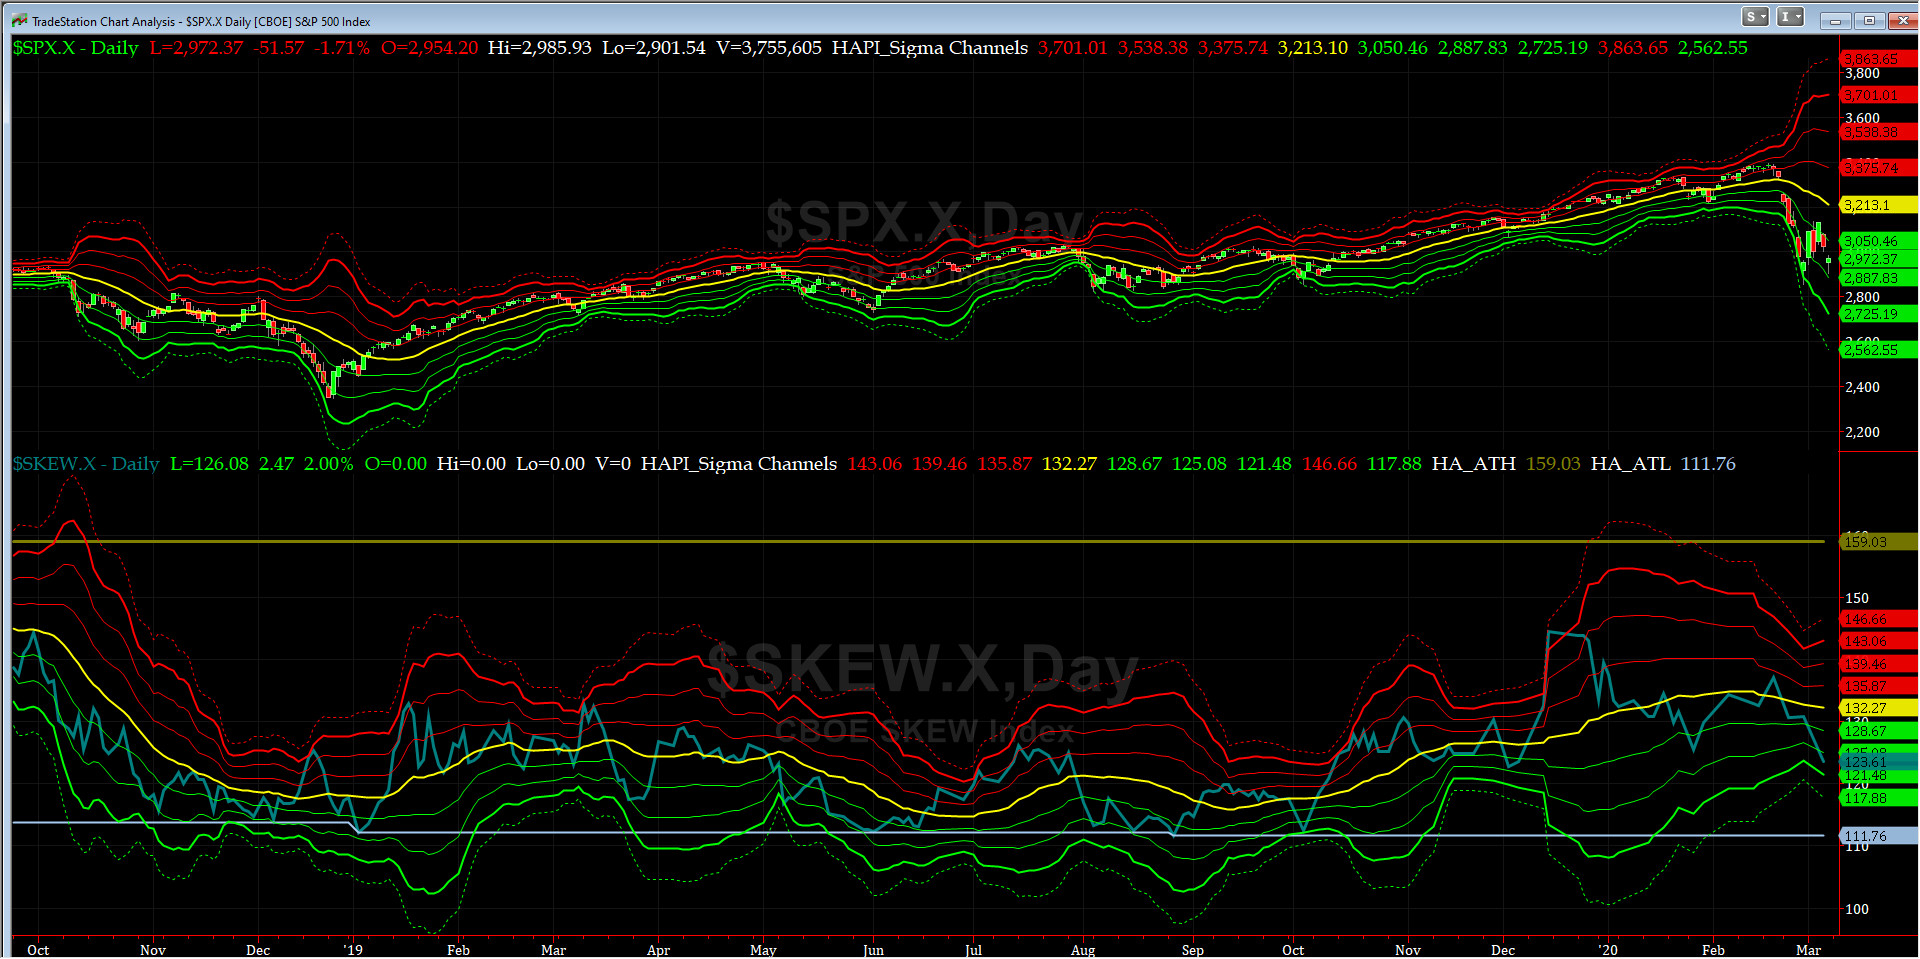
SPX SKEW (Downside Tail Risk) Chart
This week SPX SKEW (Downside Tail Risk) eased off on Thursday (SKEW is NOT computed every day any more) and closed at 123.6, now about its negative 2.5 sigma (normal = 115, range 100-150).
All quiet on the Eastern & Mid-Western Fronts? our beloved & newly promoted Vice Admiral Tiko, KCPE, says NO, ALL IS NOT WELL..... (VADM Tiko notes that on Feb 20, SKEW was at 137+ or its +1 sigma)
How to interpret the value of SPX SKEW? (from CBOE white paper on SKEW)


3-month VIX Futures Spread(VX) Chart
This popular timing indicator for identifying tradable bottoms, (now long MAR20, & short JUN20 VIX Futures) hit -11.28 Friday at the Close. We have never seen anything like this before (note: we were NOT running this chart during 2008-2009 financial debacle).
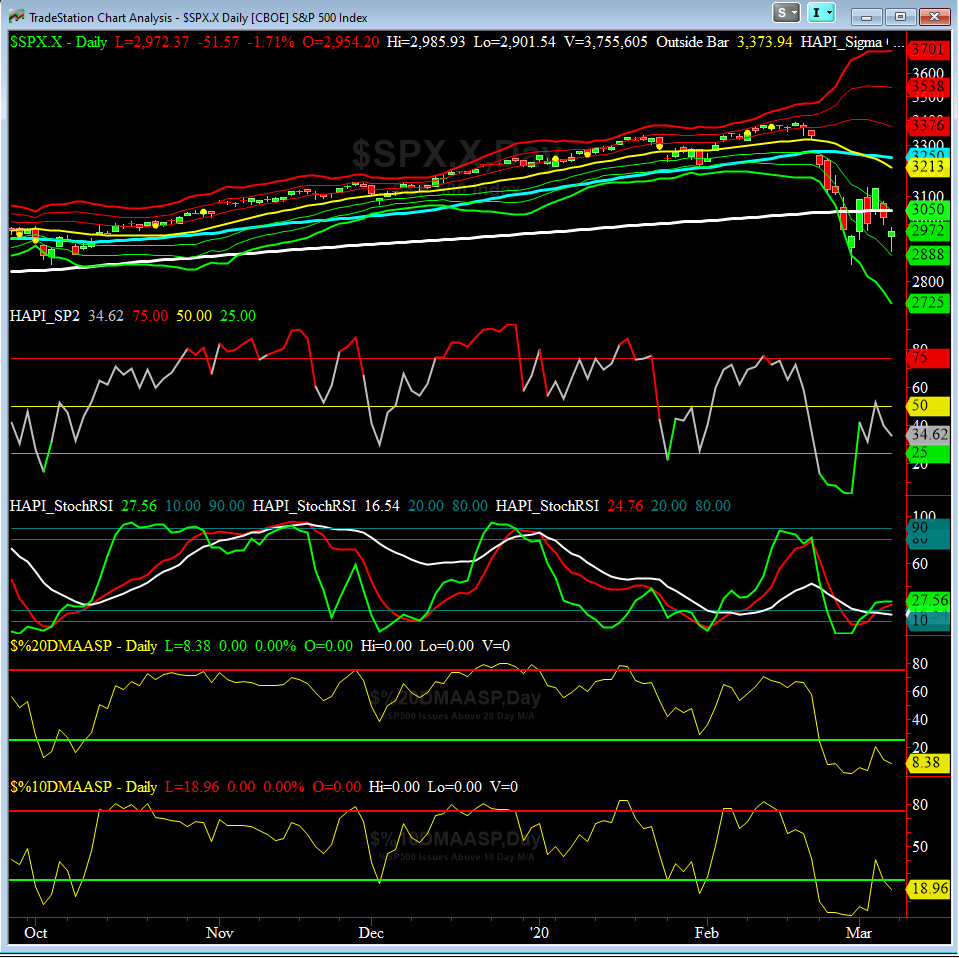
HA_SP2 Chart
HA_SP2 = 34.6 (Buy signal <= 25, Sell Signal >= 75)
This indicator says we are approaching oversold again (25 and lower) - during the prior week, we observed values (between 4.5 & 4.1) for our SP2 indicator that we had NOT seen before either.
Fari Hamzei
|


 Proactive Market Timing


