Investment Advice via real time put call ratio real time investment advice
Contact Us Home Products News About Members
Proactive Market Timing
 
Proactive Market Timing Service

Market Timer: Fari Hamzei

Executive Officer: @Fleet_Adm_Tiko

Editors: Nancy Scott

Here is the most recent How the PMT Market Bias Service Works Video

Weekly PMT Webinars on YouTube   PMT Archives   Current PMT Issue

Most Recent PMT vs SPX Performance Chart

Thursday, May 28, 2020, 14208ET
Our Secondary Profit Target for PMT Issue #327 is also history


Dear Jim,

SPX at 3060 is now gone

HoD as of this writing = 3068++

Cheers……….

Fari Hamzei

Tuesday, May 26, 2020, 1203ET
Our Primary Target of SPX at 3040 for Issue #327 is taken out


You should be 80% out now

Next target is SPX at 3060 which we could hit today (HoD is 3052 right now)

Fari Hamzei

Tuesday, May 26, 2020, 1203ET
LAUNCH COMMAND EMAIL for PMT Issue #327


SPX is trading at 3005 now
SPY is trading at 300.45 now

The midpoint price for our Long Call leg is trading approximately at 6.54 now
The midpoint price for our Short Call leg is trading approximately at 3.06 now

Therefore, the midpoint price for our Call Spread is trading approximately at 3.49 now

@Admiral_Tiko: EXECUTE….. EXECUTE…..

Fari Hamzei

Tuesday, May 26, 2020, 1150ET
WEEKLY Support, Pivot & Resistance Levels Chart for Issue #327

Tuesday, May 26, 2020, 1145ET
Market Bias for Issue #327

Our current Market Bias with Timer Digest is LONG SPX as of MAY 22 at 2955
Our previous Market Bias was SHORT SPX as of APR 30 at 2912


            Here are the trade parameters for this week:

SPX Secondary Profit Target for last 20% of our position = 3060
SPX Primary Profit Target for first 80% of our position = 3040
SPX BreakEven Stop (Current Price) for last 20% of our position = 3015
SPX Money Management Stop for 100% of our position = 2950


Action Asset Expiration Strike Option Last Mid-Point
BUY SPY Friday JUN 19 301 Calls 6.37 6.41
SELL SHORT SPY Friday JUN 19 308 Calls 3.00 3.00
You need to execute both legs and hold it as a Call-Spread.

Note A: Once the Primary Profit Target has been reached, traders are advised to close 80% of their position in order to lock in profits. The remaining balance can be carried over with a BreakEven STOP, based on the SPX level at the time of entry, in order to make the trade a zero-risk trade with the final position running to reach the Secondary Profit Target. Once either Secondary Profit or Money Management (BreakEven STOP after the 80% peel-off) is hit, our Option/ETF trade for that week is over. Go to Cash and wait for the next PMT Issue.

Note B: When we change our Market Bias with Timer Digest, You need to go FLAT asap. With PMT Pro, that is before the Close that day and with the basic PMT, at the open of the next day. The following trading day, we will issue new SPX targets and a new SPY options trade, as long as our new market bias with Timer Digest is NOT flat.

Fari Hamzei

Monday, May 25, 2020, 2230ET
Market Timing Charts, Analysis & Commentary for Issue #327


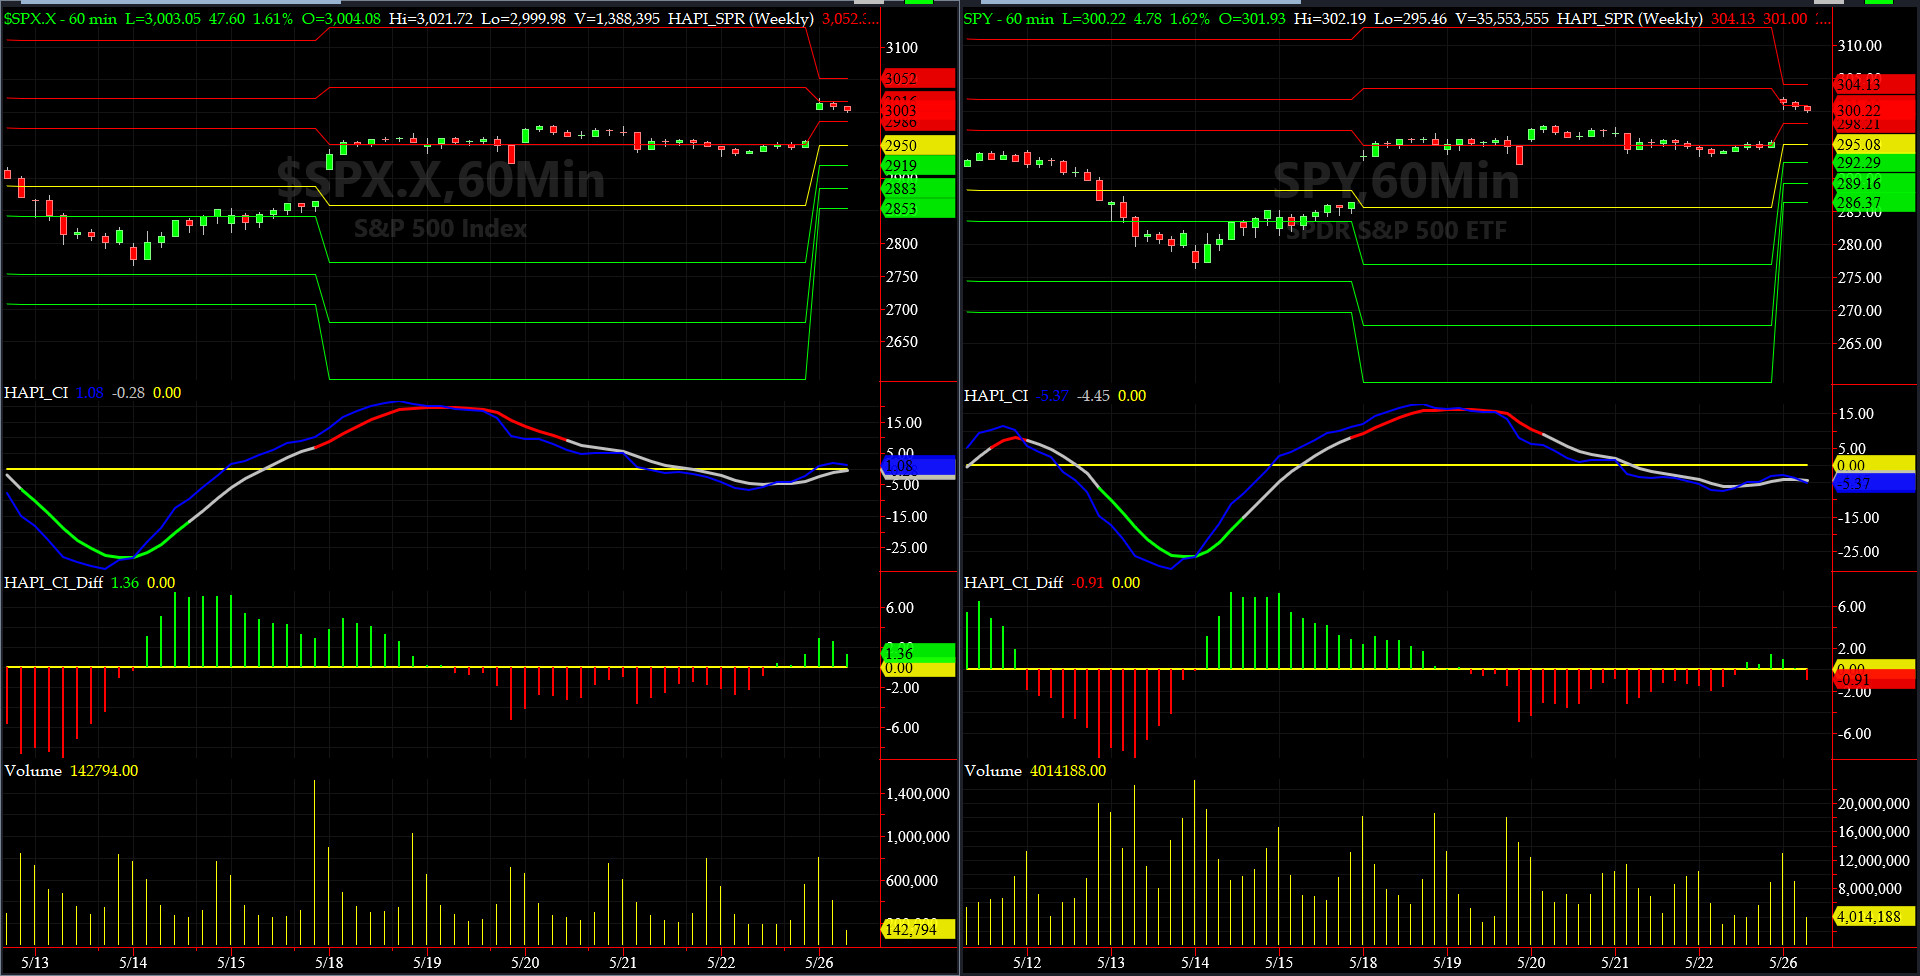
Timer Charts of S&P-500 Cash Index (SPX) + NASDAQ-100 Cash Index (NDX)

Most recent S&P-500 Cash Index (SPX) Close: 2870 up +40 (up +1.4%) for 9 days ending on Friday, May 22, 2020, which closed very near its +1 sigma.

DJIA ALL TIME INTRADAY HIGH = 29568 reached on Wednesday, February 12, 2020
DJT ALL TIME INTRADAY HIGH = 11623 reached on Friday, September 14, 2018
SPX ALL TIME INTRADAY HIGH = 3258 reached on Wednesday, February 19, 2020
NDX ALL TIME INTRADAY HIGH = 8873 reached on Wednesday, February 19, 2020
RUT ALL TIME INTRADAY HIGH = 1742 reached on Friday, August 31, 2018

Current DAILY +2 Sigma SPX = 2985 with WEEKLY +2 Sigma = 3566
Current DAILY 0 Sigma SPX = 2894 with WEEKLY 0 Sigma = 2861
Current DAILY -2 Sigma SPX = 2803 with WEEKLY -2 Sigma = 2355

NYSE McClellan Oscillator = +95 (-150 is start of the O/S area; around -275 to -300 area or lower, we go into the “launch-pad” mode; over +150, we are in O/B area)
NYSE Breadth Thrust = 49.3 (40 is considered as oversold and 65 as overbought)

SPX is in its own orbit, and, now it is finally trying to break out over its 200-day MA (~3000).


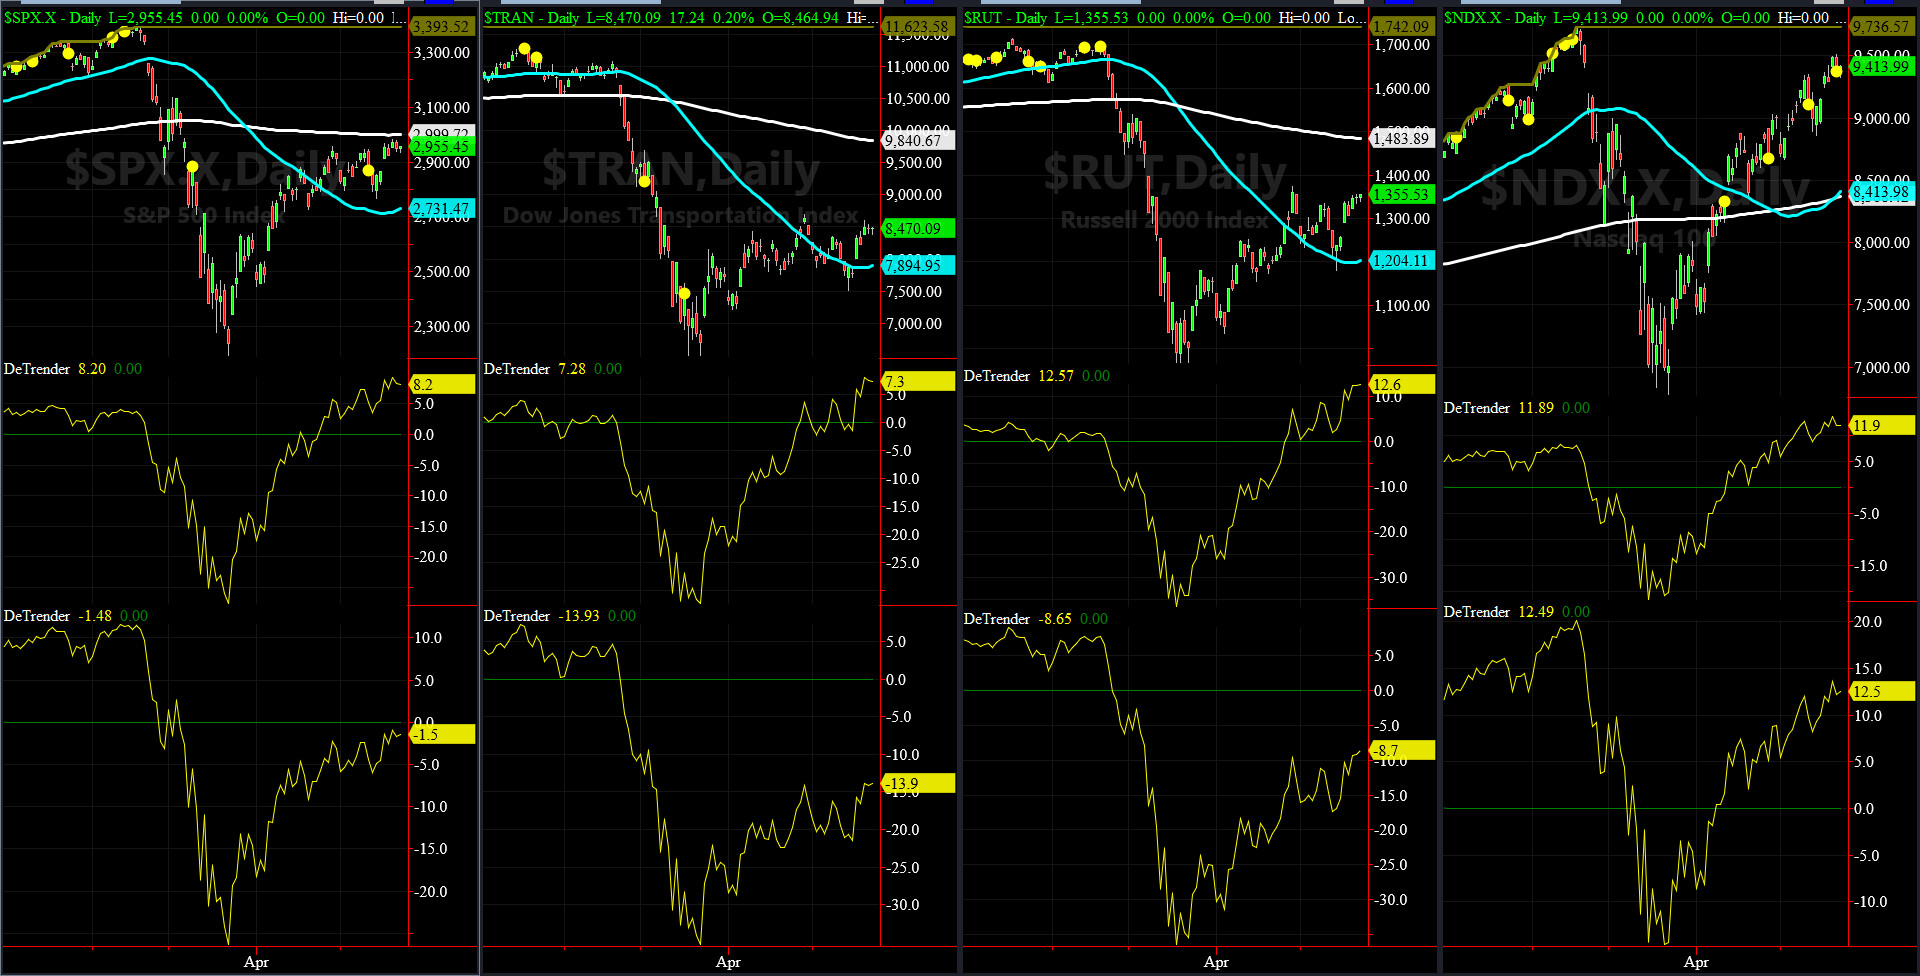
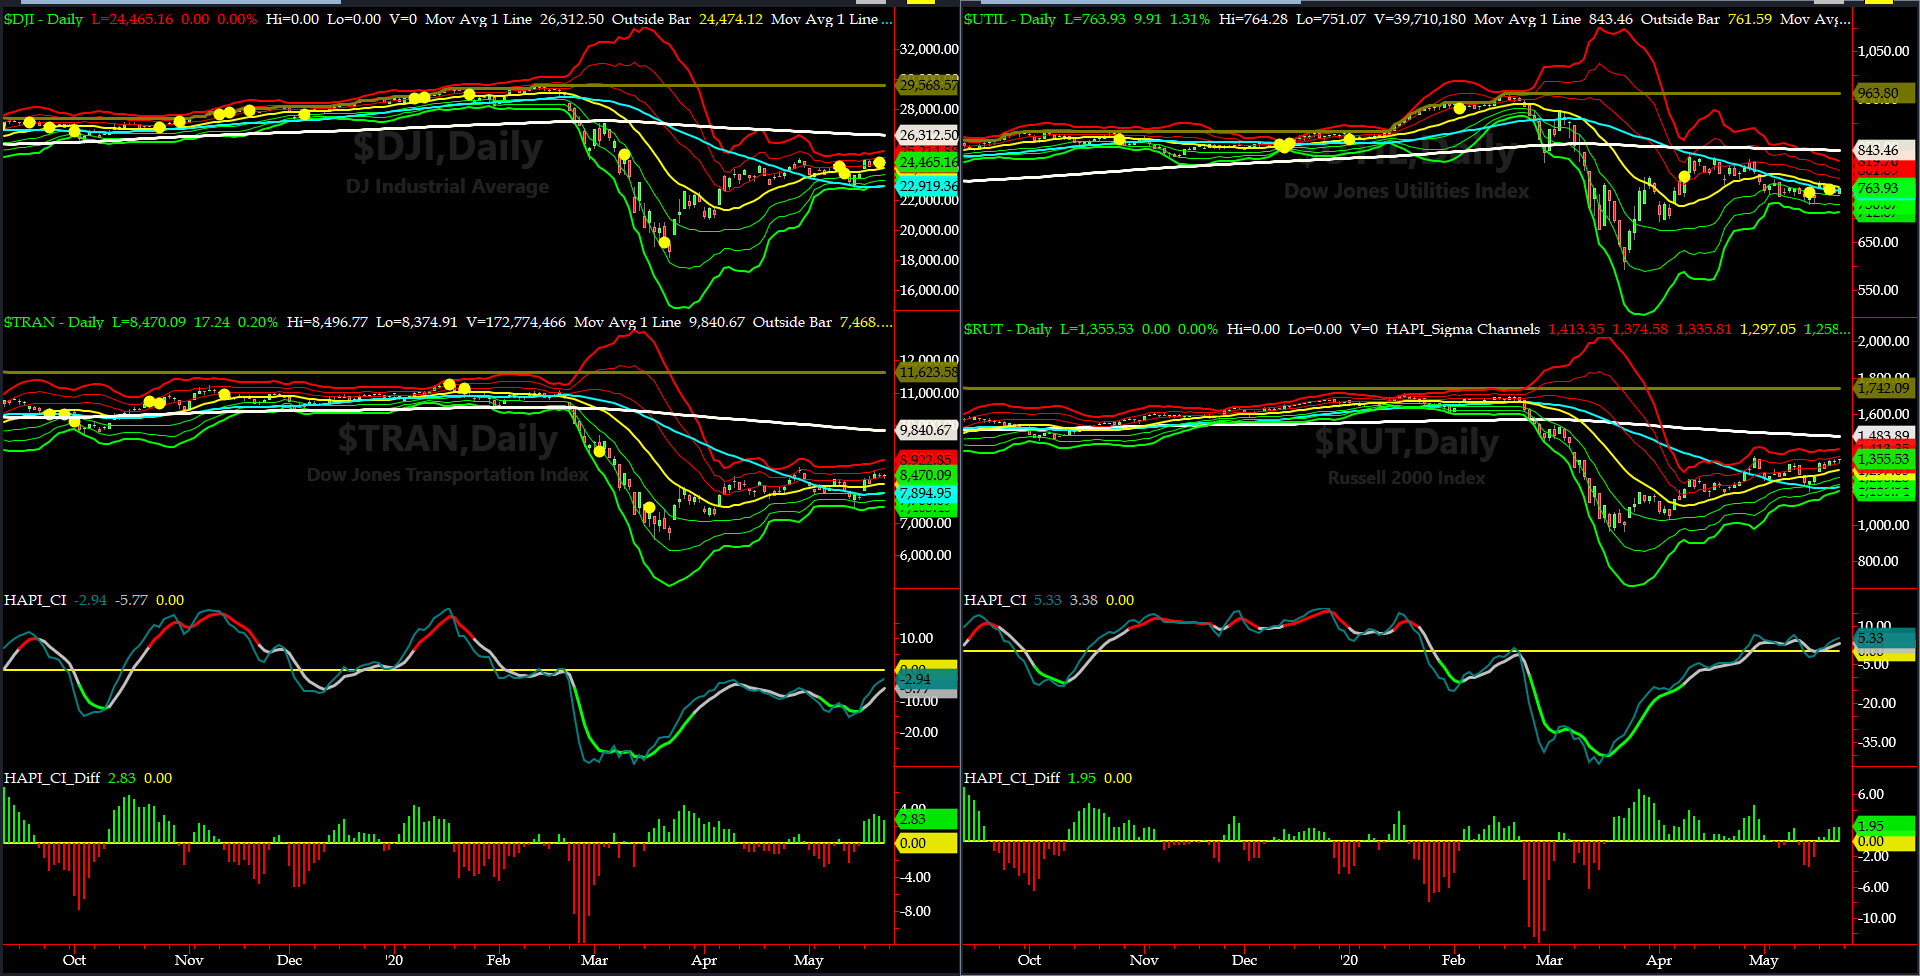
DeTrenders Charts for SPX, NDX, TRAN & RUT Indices

200-Day MA DJ TRAN = 9840 or 13.9% ABOVE the DJ TRAN (max observed in last 7 yrs = 20.2%, min = -20.3%)
200-Day MA RUT = 1484 or 8.7% ABOVE RUT (max observed in last 7 yrs = 21.3%, min = -22.6%)

50-Day MA SPX = 2725 or 8.2% BELOW SPX (max observed in last 7 yrs = +8.6%, min = -9.3%)
200-Day MA SPX = 3001 or 1.5% ABOVE SPX (max observed in last 7 yrs = 15.2%, min = -14%)

DJ Transportation Index (proxy for economic conditions 6 to 9 months hence) had a pretty decent run to the upside in the last 9 sessions.

Russell 2000 Small Caps Index (proxy for Risk ON/OFF) pretty much followed TRAN pattern here.

FIVE of our EIGHT DeTrenders are in the POSITIVE territory. The DeTrenders for DJ Tran & RUT will continue to be harbingers of future price behavior in broad indices.
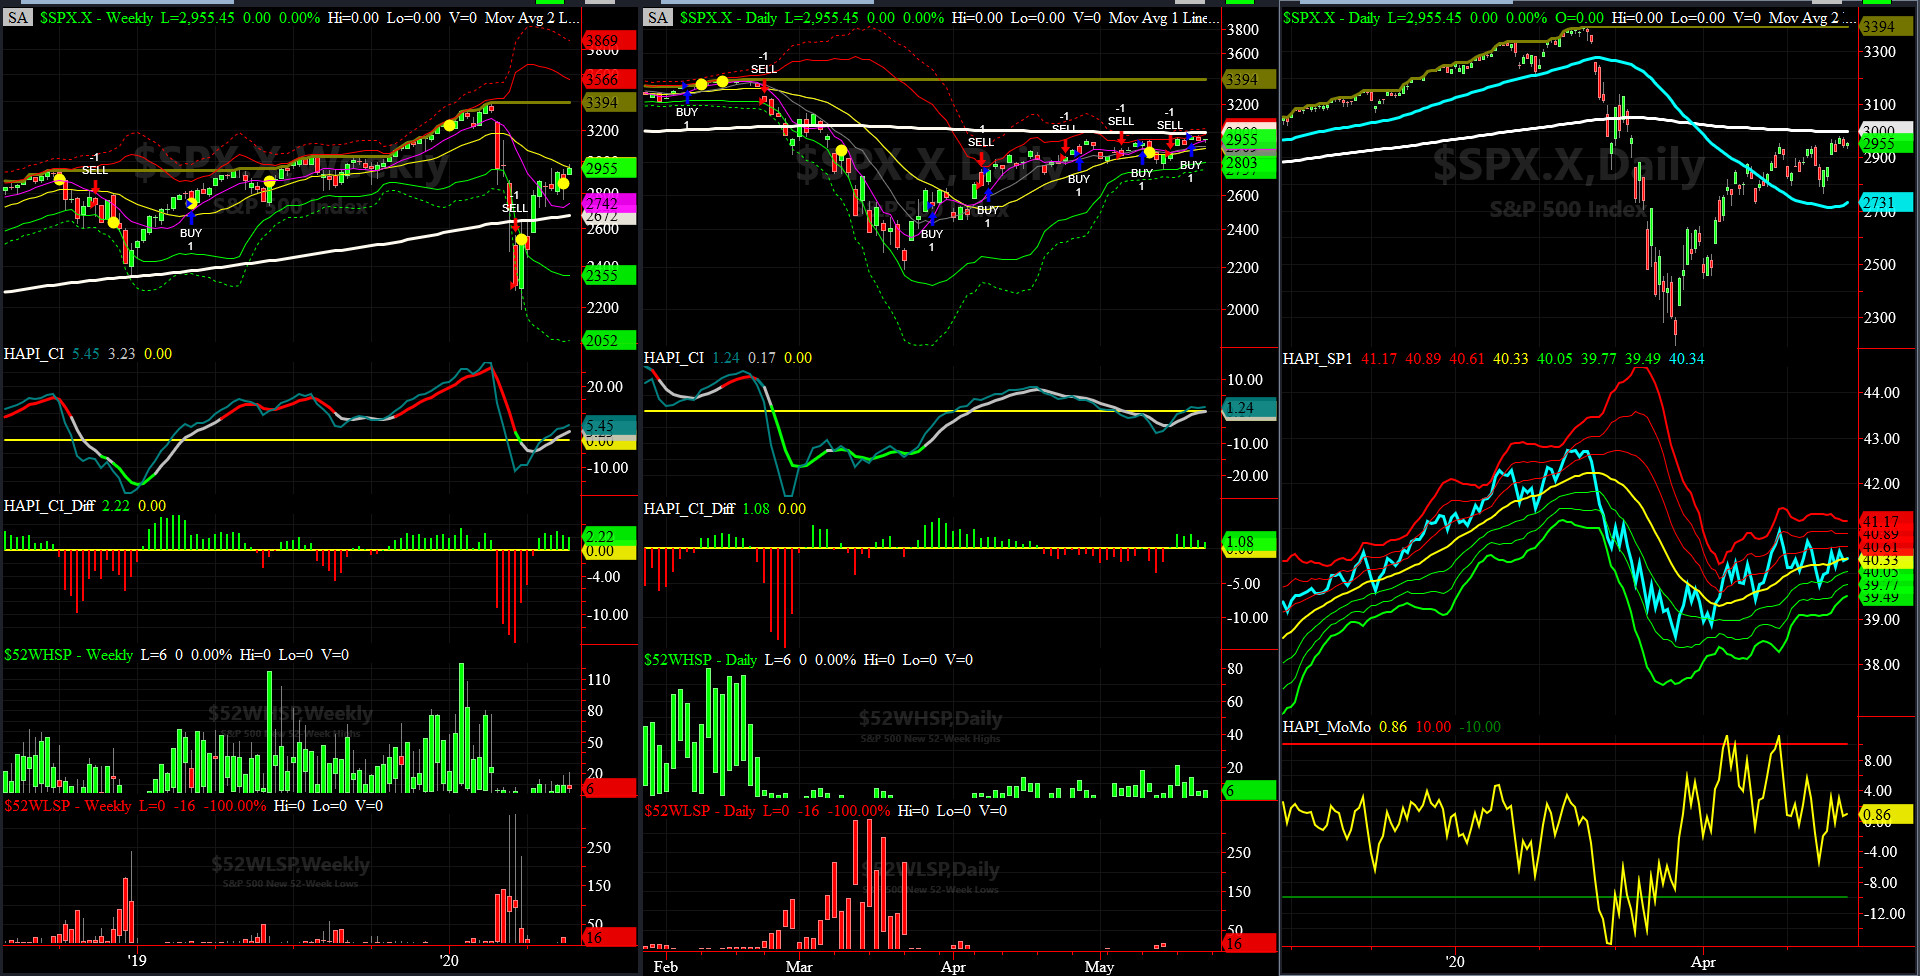


HA_SP1_Momo Chart

WEEKLY Timing Model = on a BUY Signal since Monday, May 11, 2020 CLOSE at 2930
DAILY Timing Model = on a BUY Signal since Wednesday, May 20, 2020 CLOSE at 2971
Max SPX 52wk-highs reading last week = 21 (over 120-140, the local maxima is in)
Max SPX 52wk-Lows reading last week = 1 (over 40-60, the local minima is in)
HA_SP1 again closed near its zero sigma channels
HA_Momo = +0.86 (reversals most likely occur above +10 or below -10)


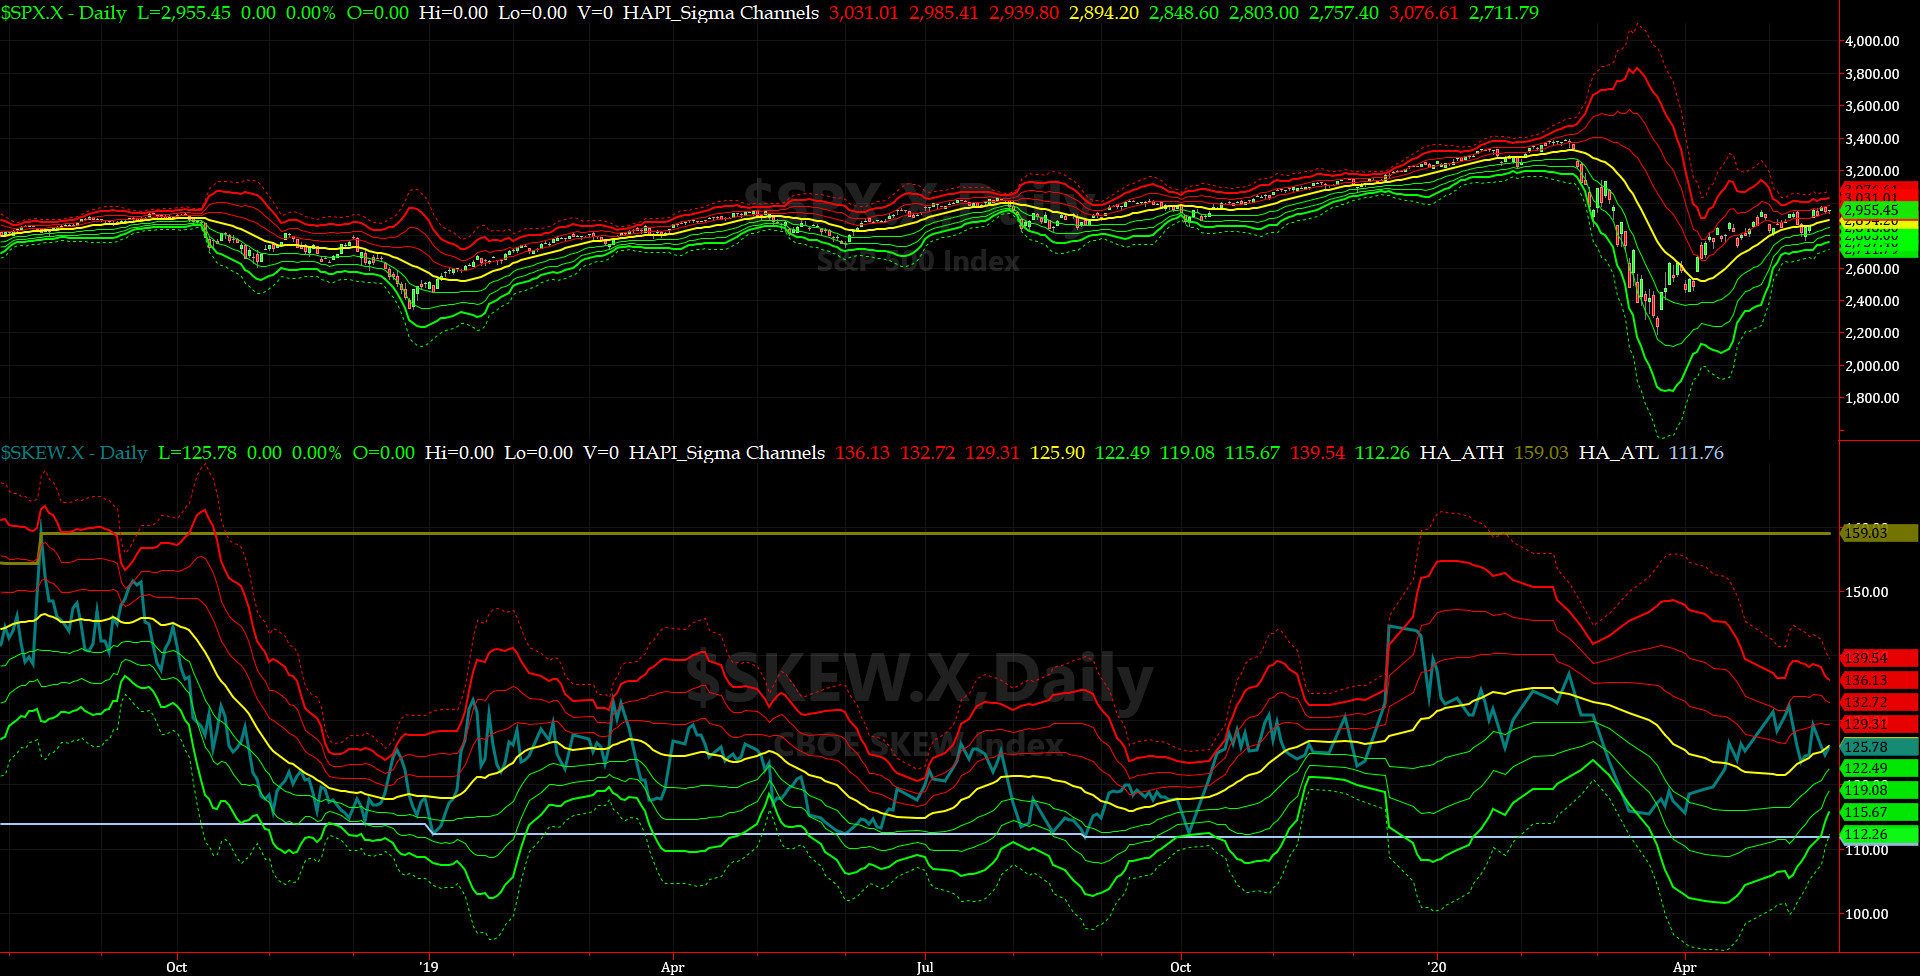
SPX SKEW (Downside Tail Risk) Chart

This week SPX SKEW (Downside Tail Risk) eased off on Thursday (SKEW is NOT computed every day any more) and closed at 125.8, now about its negative 0.5 sigma (normal = 115, range 100-150).

All quiet on the Eastern & Mid-Western Fronts? HRH Admiral Tiko, KCPE, says: ALL IS NOT WELL & he is not buying Jared's bravado!!


How to interpret the value of SPX SKEW? (from CBOE white paper on SKEW)


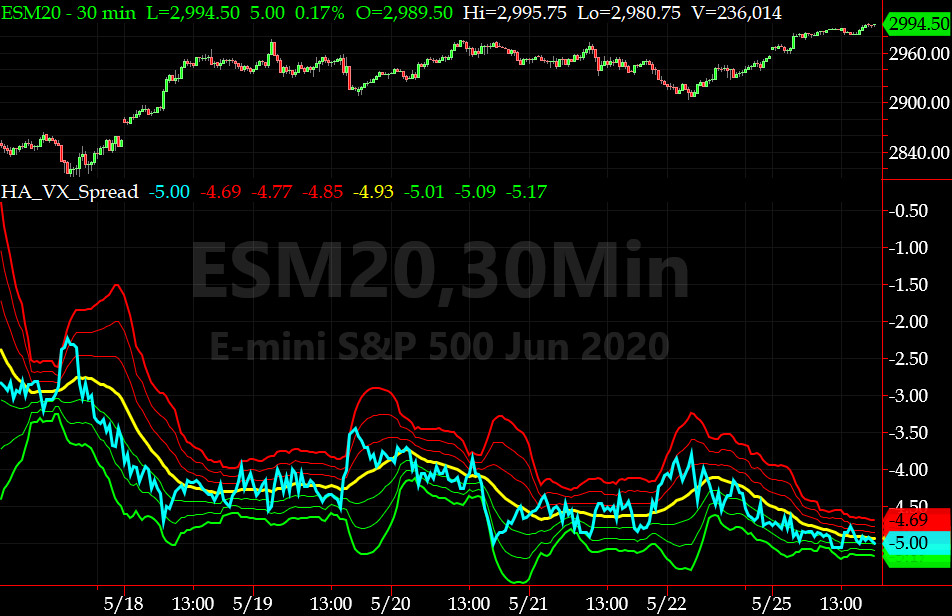
3-month VIX Futures Spread(VX) Chart

This shifted timing indicator for identifying tradable bottoms, (now long JUN20, & short SEP20 VIX Futures) hit -4.95 at the Close today. Once it hits zero, ceteris paribus, we are near the bottom.
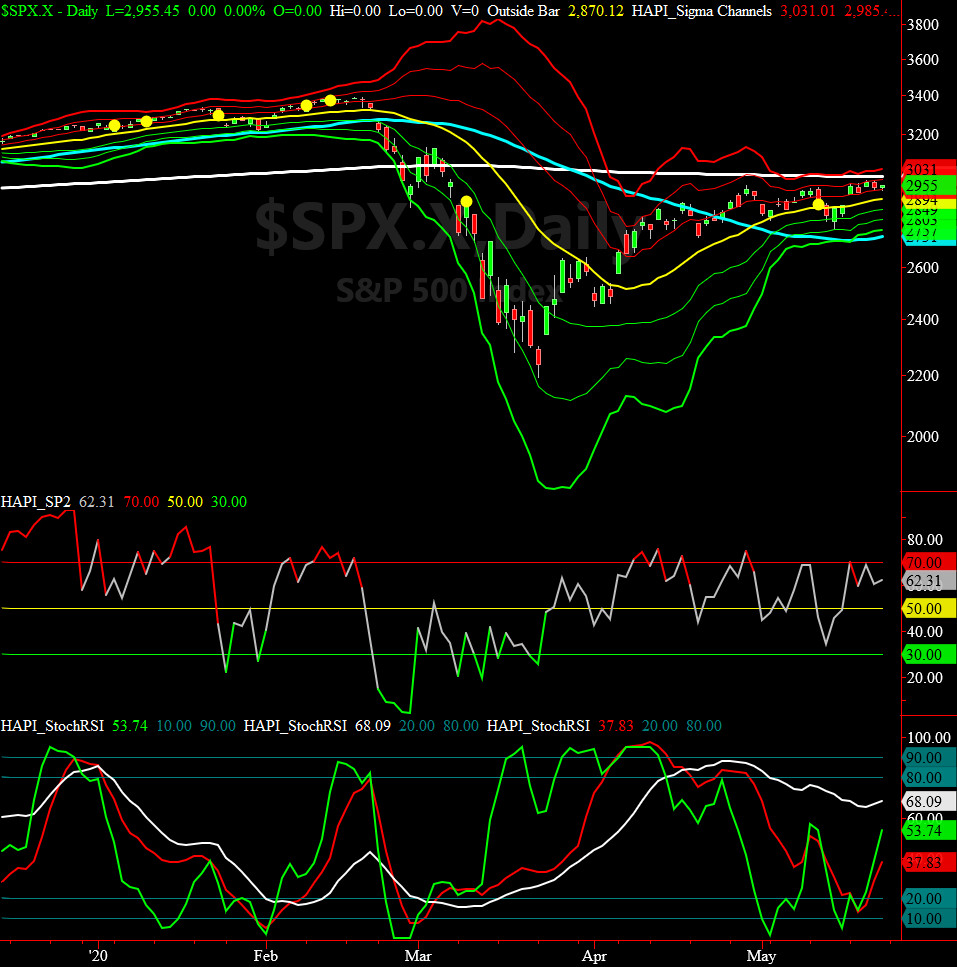


HA_SP2 Chart

HA_SP2 = 62.3 (Buy signal <= 30, Sell Signal >= 70)

This updated indicator says we are above neutral, and, we have a setup for testing the overbought region.

Fari Hamzei

Monday, May 25, 2020, 1602ET
Notice of Change of Market Bias with Timer Digest


Oh well – this past week was for the historians. Made us finally realize that we can’t fight Jay Powell…..lol

Getting LONG SPX till it is ready to roll over – probably we need another 2 to 3 weeks and lots of tea + Rumi
Be Safe………

Cheers………….

Fari Hamzei


Customer Care:


Chat with Fari on TradeStation.com Fari Hamzei writes for CBOE Options Hub on event-deriven basis       Futures & Options for Stock Indices
HA YouTube Channel  :::  HA Blog  :::  Testimonials  :::  Tutorials & FAQs  :::  Privacy Policy
(c) 1998-2024, Hamzei Analytics, LLC.   All Rights Reserved.