|
 |
 |
 |
 |
 |
 |
 |
 |
 Proactive Market Timing Proactive Market Timing
|
|
|
Most Recent PMT vs SPX Performance Chart

|
|
|
|
Thursday, June 11, 2020, 1520ET
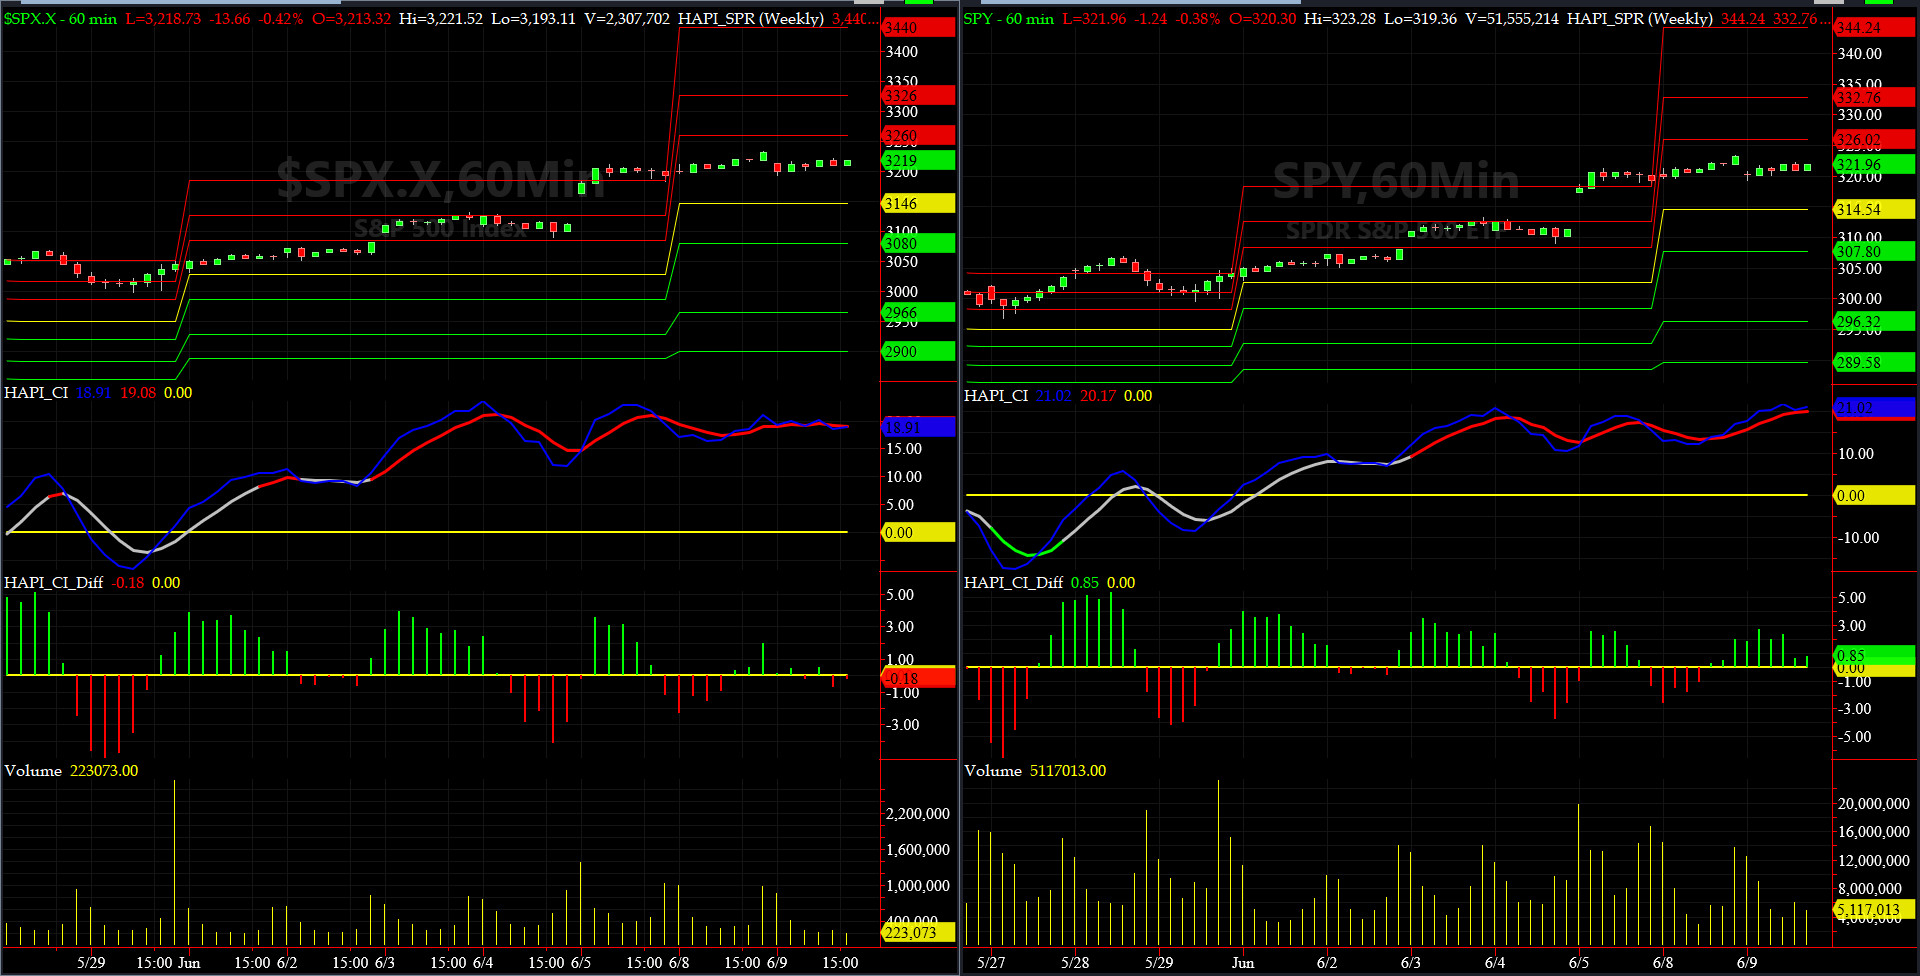
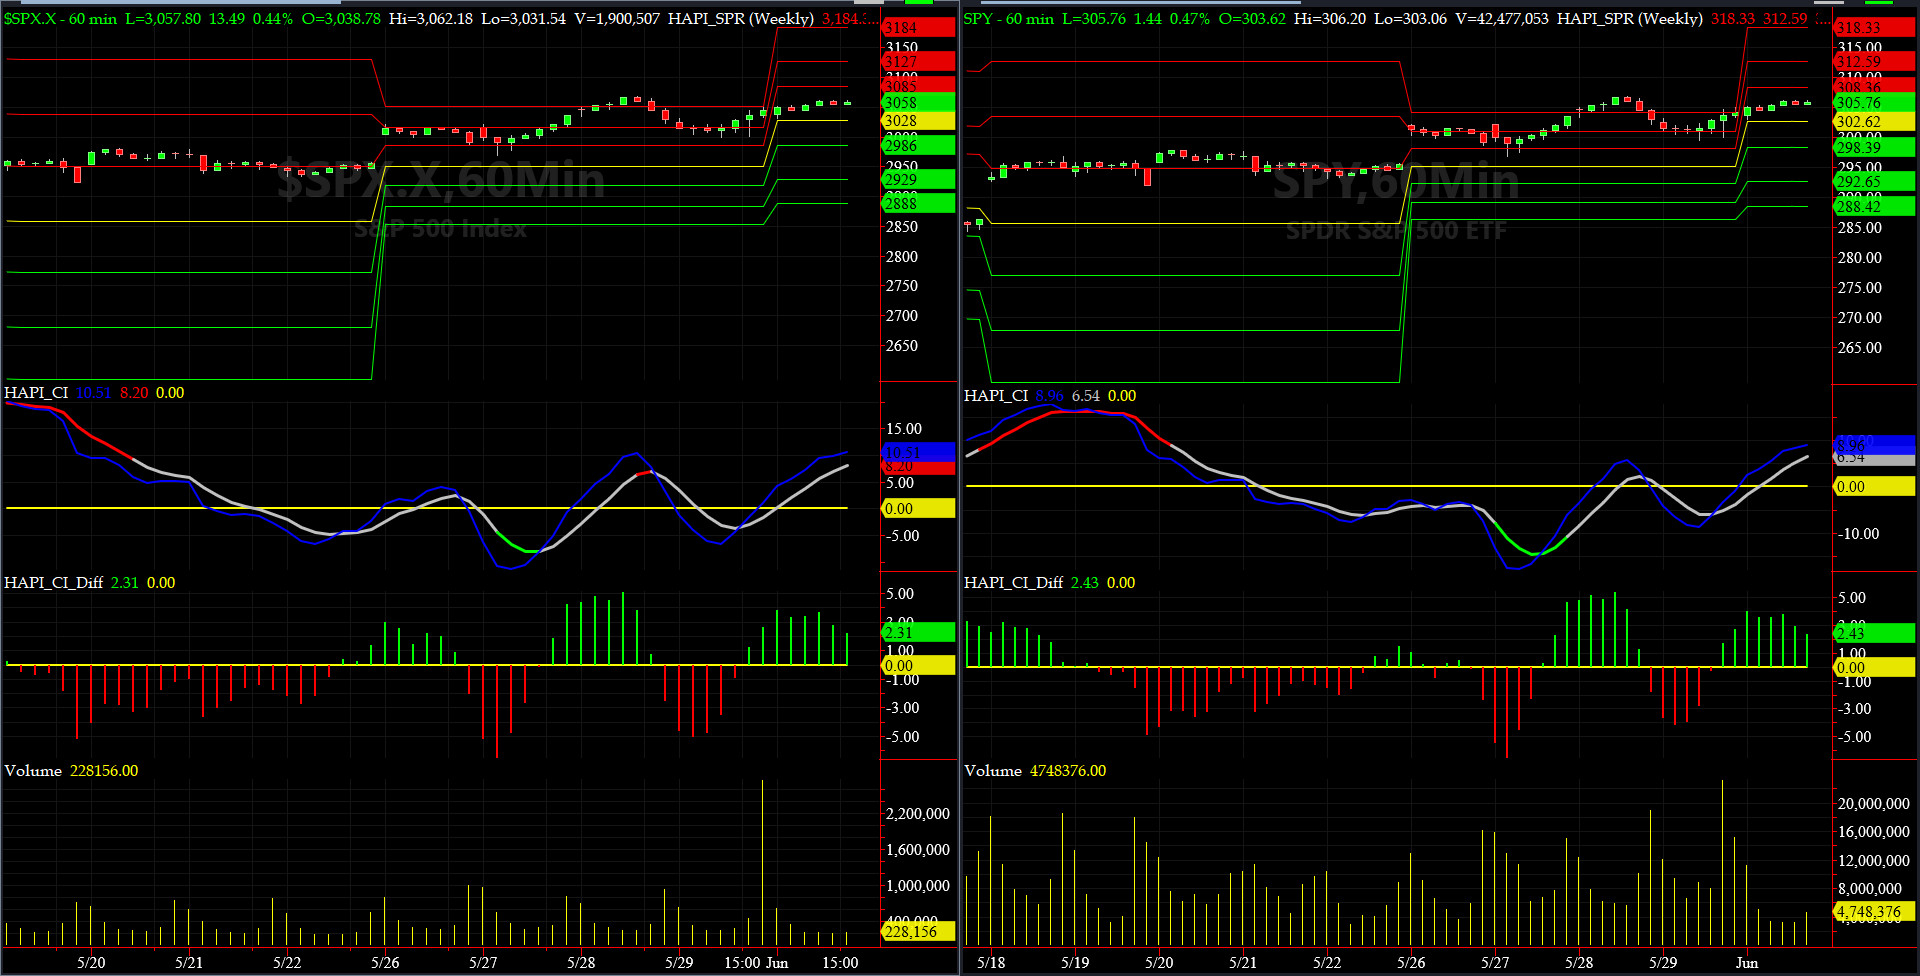
WEEKLY Support, Pivot & Resistance Levels Chart for Issue #330
|
|
|
|
|
|
Thursday, June 11, 2020, 1520ET
Market Bias for Issue #330
Our current Market Bias with Timer Digest is SHORT SPX since JUN 10 at 3190
Our previous Market Bias was LONG SPX since JUN 4 at 3112
Here are the trade parameters for this week:
SPX Money Management Stop for 100% of our position = 3080
SPX BreakEven Stop (Current Price) for last 20% of our position = 3016
SPX Primary Profit Target for first 80% of our position = 2930
SPX Secondary Profit Target for last 20% of our position = 2890
|
| Action |
Asset |
Expiration |
Strike |
Option |
Last |
Mid-Point |
| BUY |
SPY |
Friday JUL 10 |
303 |
Puts |
12.22 |
12.10 |
| SELL SHORT |
SPY |
Friday JUL 10 |
293 |
Puts |
8.69 |
8.99 |
| You need to execute both legs and hold it as a Put-Spread.
|
Note A:
Once the Primary Profit Target has been reached, traders are advised to close 80% of their position in order to lock in profits. The remaining balance can be carried over with a BreakEven STOP, based on the SPX level at the time of entry, in order to make the trade a zero-risk trade with the final position running to reach the Secondary Profit Target.
Once either Secondary Profit or Money Management (BreakEven STOP after the 80% peel-off) is hit, our Option/ETF trade for that week is over. Go to Cash and wait for the next PMT Issue.
Note B:
When we change our Market Bias with Timer Digest, You need to go FLAT asap. With PMT Pro, that is before the Close that day and with the basic PMT, at the open of the next day. The following trading day, we will issue new SPX targets and a new SPY options trade, as long as our new market bias with Timer Digest is NOT flat.
Fari Hamzei
|
|
|
|
|
|
Tuesday, June 9, 2020, 1550ET
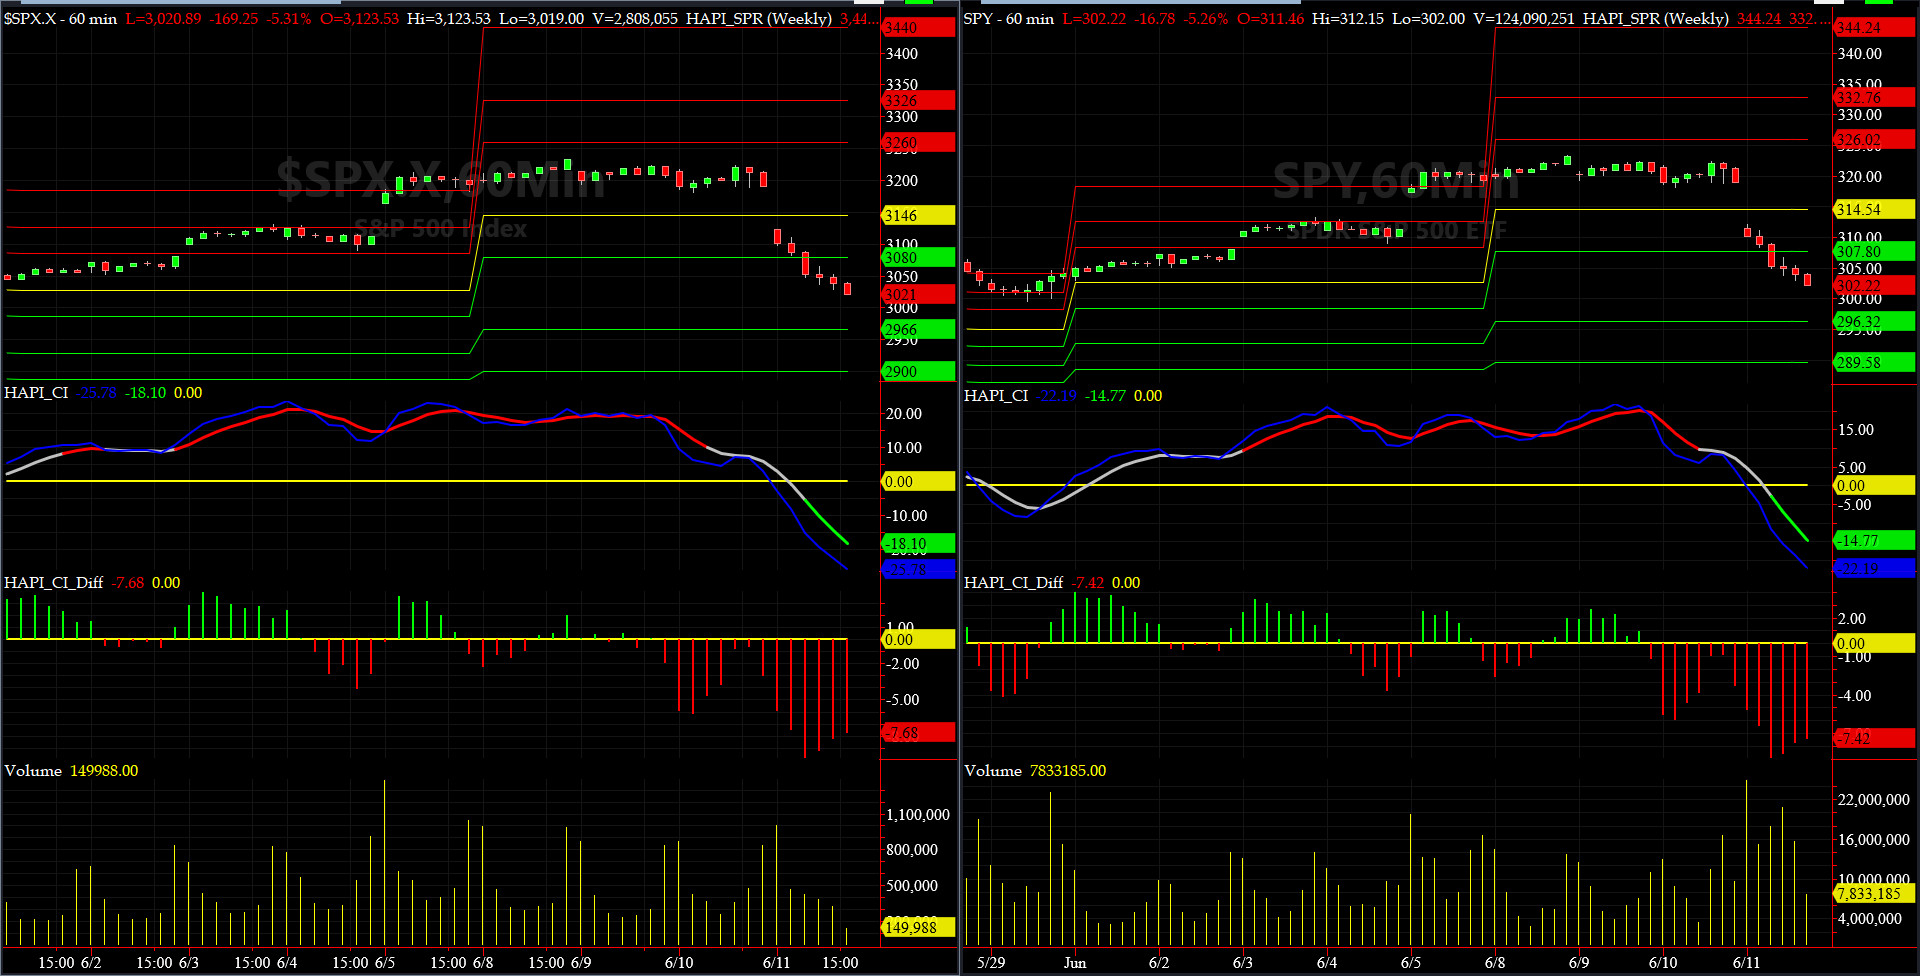
WEEKLY Support, Pivot & Resistance Levels Chart for Issue #329
|
|
|
|
|
|
Monday, June 9, 2020, 1545ET
Market Bias for Issue #329
Our current Market Bias with Timer Digest is LONG SPX as of JUN 4 at 3112
Our previous Market Bias was FLAT SPX as of JUN 3 at 3122
Here are the trade parameters for this week:
SPX Secondary Profit Target for last 20% of our position = 3325
SPX Primary Profit Target for first 80% of our position = 3265
SPX BreakEven Stop (Current Price) for last 20% of our position = 3216
SPX Money Management Stop for 100% of our position = 3135
|
| Action |
Asset |
Expiration |
Strike |
Option |
Last |
Mid-Point |
| BUY |
SPY |
Thursday JUL 2 |
320 |
Calls |
8.03 |
7.86 |
| SELL SHORT |
SPY |
Thursday JUL 2 |
327 |
Calls |
4.23 |
4.21 |
| You need to execute both legs and hold it as a Call-Spread.
|
Note A:
Once the Primary Profit Target has been reached, traders are advised to close 80% of their position in order to lock in profits. The remaining balance can be carried over with a BreakEven STOP, based on the SPX level at the time of entry, in order to make the trade a zero-risk trade with the final position running to reach the Secondary Profit Target.
Once either Secondary Profit or Money Management (BreakEven STOP after the 80% peel-off) is hit, our Option/ETF trade for that week is over. Go to Cash and wait for the next PMT Issue.
Note B:
When we change our Market Bias with Timer Digest, You need to go FLAT asap. With PMT Pro, that is before the Close that day and with the basic PMT, at the open of the next day. The following trading day, we will issue new SPX targets and a new SPY options trade, as long as our new market bias with Timer Digest is NOT flat.
Fari Hamzei
|
|
|
|
|
|
Tuesday, June 9, 2020, 1440ET
Market Timing Charts, Analysis & Commentary for Issue #329 in DRAFT MODE
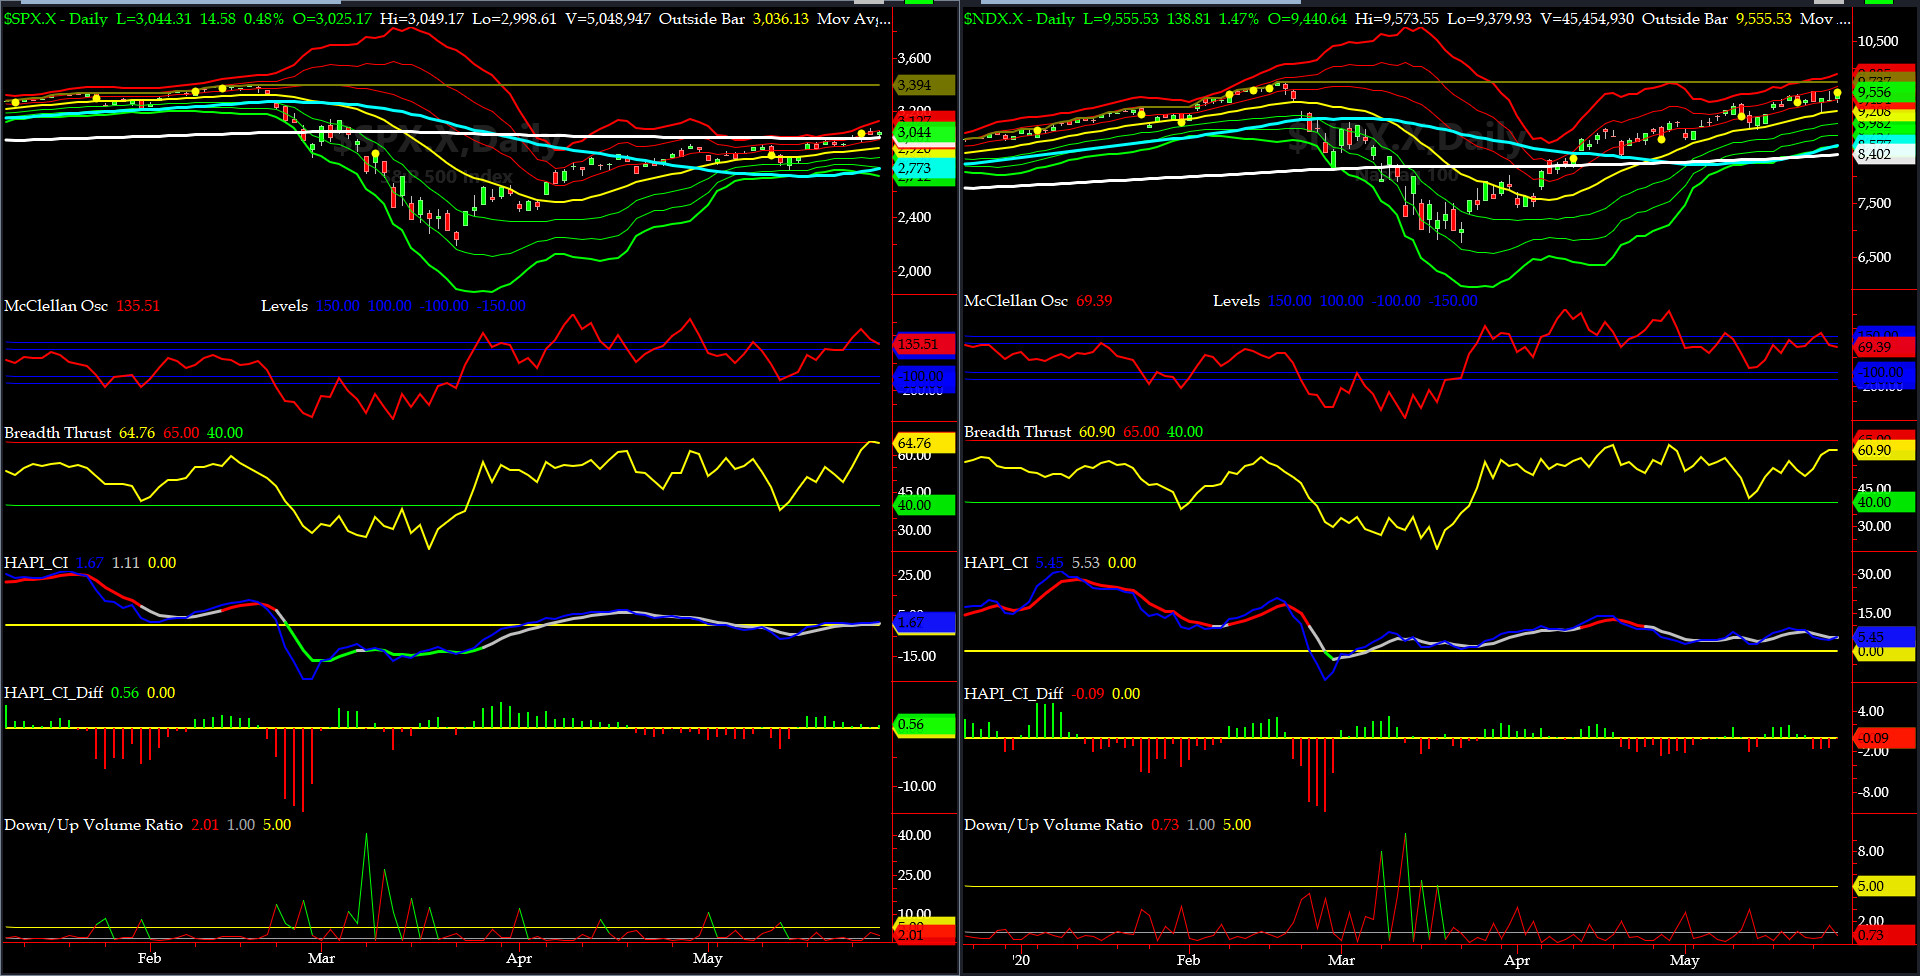
Timer Charts of S&P-500 Cash Index (SPX) + NASDAQ-100 Cash Index (NDX)
Most recent S&P-500 Cash Index (SPX) Close: 2870 up +40 (up +1.4%) for 9 days ending on Friday, May 29, 2020, which closed very near its +2 sigma.
DJIA ALL TIME INTRADAY HIGH = 29568 reached on Wednesday, February 12, 2020
DJT ALL TIME INTRADAY HIGH = 11623 reached on Friday, September 14, 2018
SPX ALL TIME INTRADAY HIGH = 3258 reached on Wednesday, February 19, 2020
NDX ALL TIME INTRADAY HIGH = 8873 reached on Wednesday, February 19, 2020
RUT ALL TIME INTRADAY HIGH = 1742 reached on Friday, August 31, 2018
Current DAILY +2 Sigma SPX = 3058 with WEEKLY +2 Sigma = 3541
Current DAILY 0 Sigma SPX = 2920 with WEEKLY 0 Sigma = 2950
Current DAILY -2 Sigma SPX = 2781 with WEEKLY -2 Sigma = 2359
NYSE McClellan Oscillator = +135 (-150 is start of the O/S area; around -275 to -300 area or lower, we go into the �launch-pad� mode; over +150, we are in O/B area)
NYSE Breadth Thrust = 64.8 (40 is considered as oversold and 65 as overbought)
This week SPX finally tested its 200-day MA (3002) (since the rally that began on Spring Equinox) and managed to close above it. But if history is any guide, we know first or second attempts are normally futile. Keep an eye on 200-day MA Level going forward.
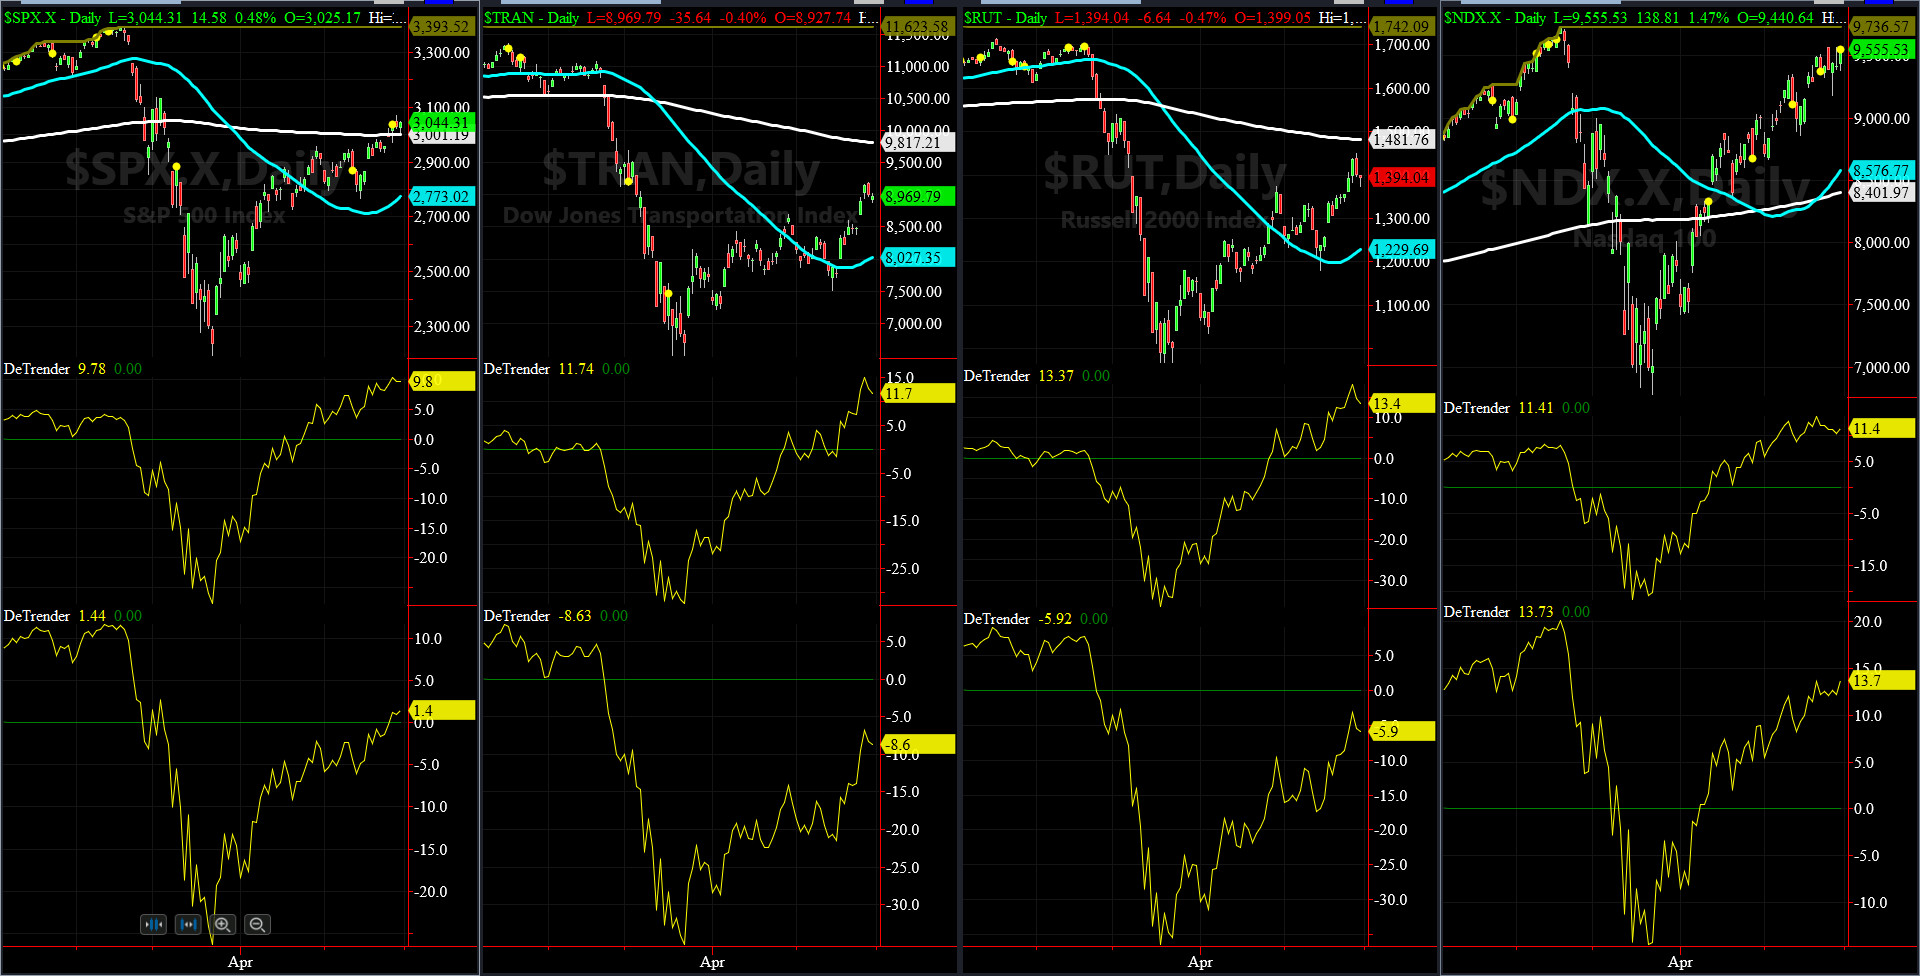
DeTrenders Charts for SPX, NDX, TRAN & RUT Indices
200-Day MA DJ TRAN = 9817 or 8.6% ABOVE the DJ TRAN (max observed in last 7 yrs = 20.2%, min = -20.3%)
200-Day MA RUT = 1482 or 5.9% ABOVE RUT (max observed in last 7 yrs = 21.3%, min = -22.6%)
50-Day MA SPX = 2773 or 9.8% BELOW SPX (max observed in last 7 yrs = +8.6%, min = -9.3%)
200-Day MA SPX = 3002 or 1.4% BELOW SPX (max observed in last 7 yrs = 15.2%, min = -14%)
DJ Transportation Index (proxy for economic conditions 6 to 9 months hence) had an excellent week.
Russell 2000 Small Caps Index (proxy for Risk ON/OFF) also put in a great week following DJ TRAN pattern.
SIX of our EIGHT DeTrenders are in the POSITIVE territory. The DeTrenders for DJ Tran & RUT will continue to be harbingers of future price behavior in broad indices.
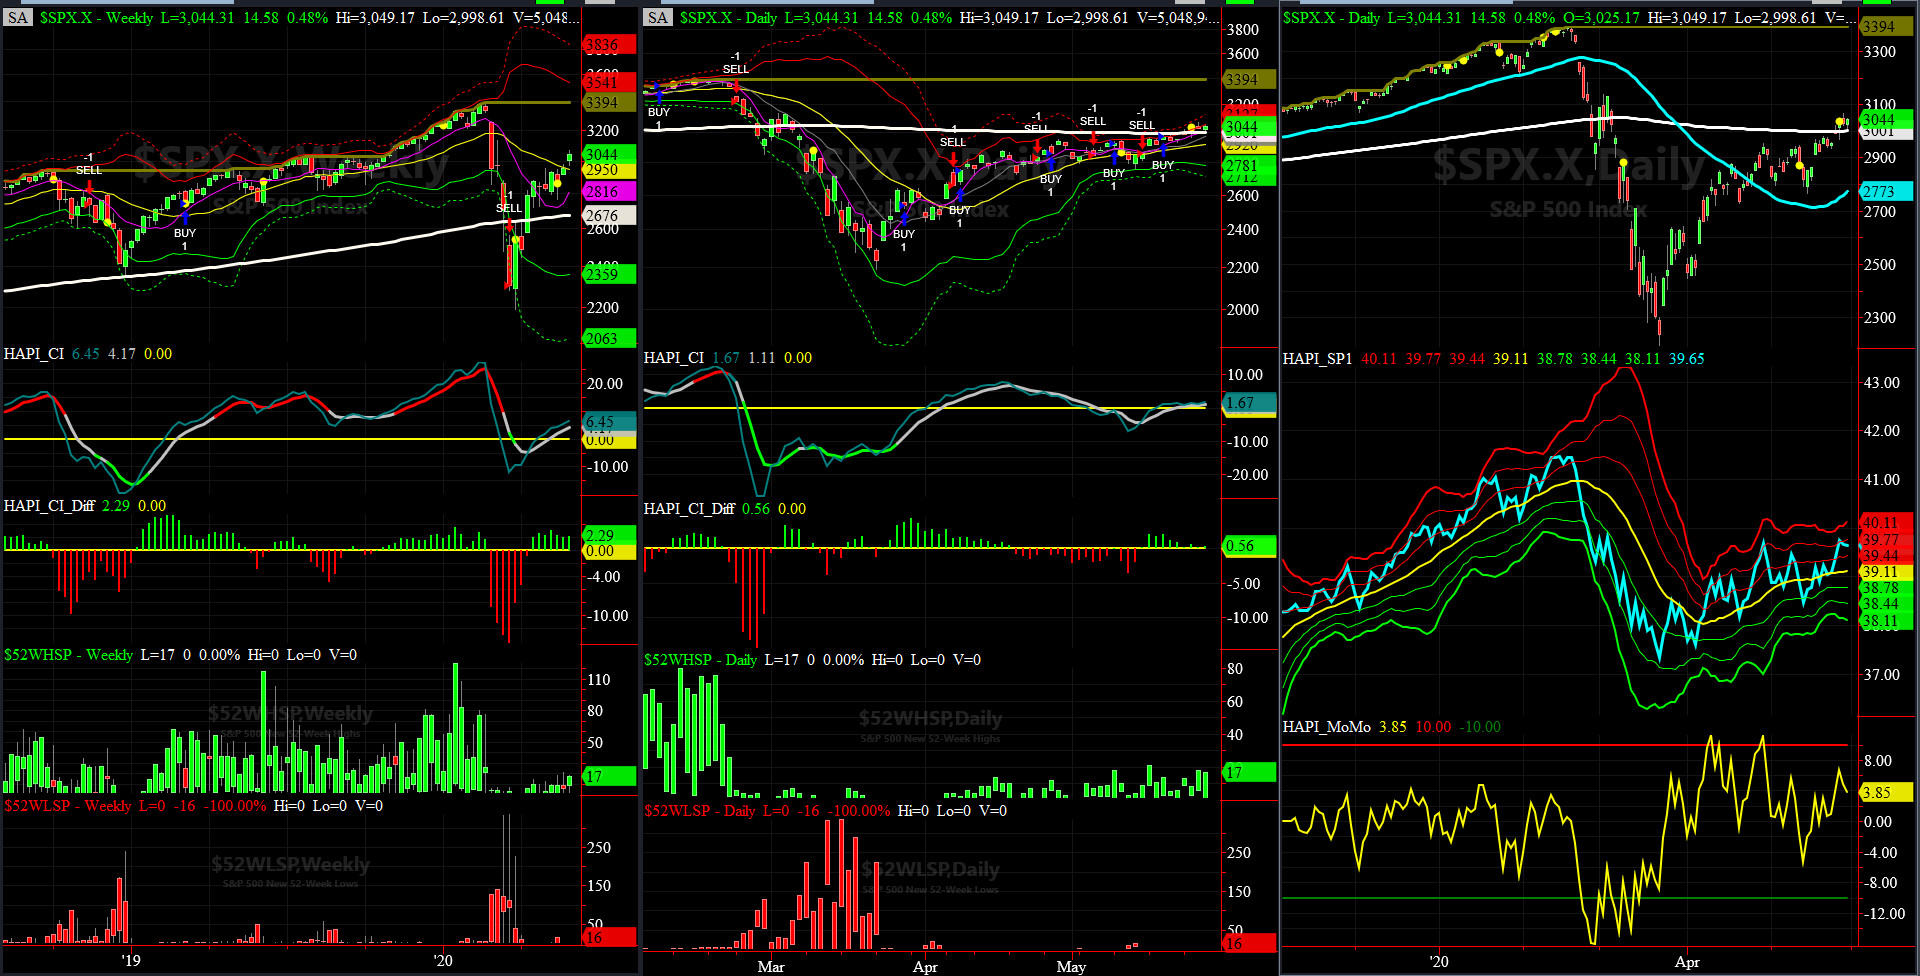
HA_SP1_Momo Chart
WEEKLY Timing Model = on a BUY Signal since Monday, May 11, 2020 CLOSE at 2930
DAILY Timing Model = on a BUY Signal since Wednesday, May 20, 2020 CLOSE at 2971
Max SPX 52wk-highs reading last week = 18 (over 120-140, the local maxima is in)
Max SPX 52wk-Lows reading last week = 0 (over 40-60, the local minima is in)
HA_SP1 again closed near its +1.5 sigma channels
HA_Momo = +3.85 (reversals most likely occur above +10 or below -10)
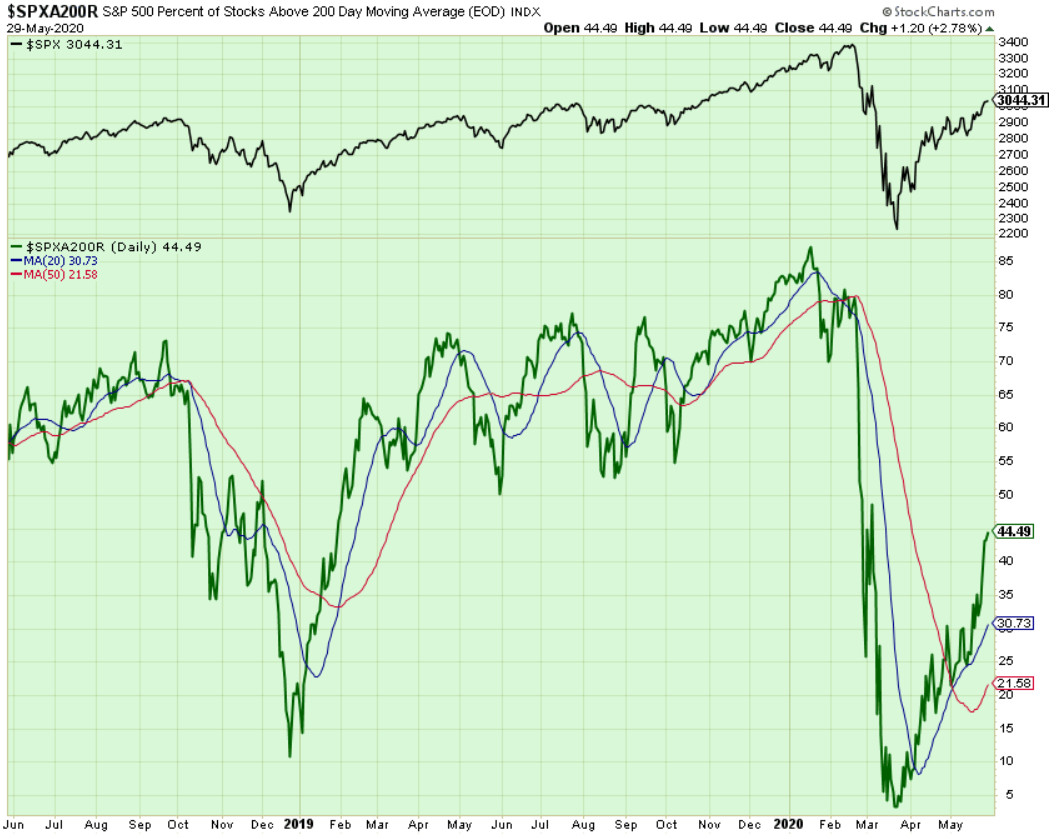
Components of SPX above their respective 200-day MA Chart
This scoring indicator finally reached 45%. Note how behind this indicator vs SPX Price in relative performance (basically says Big Caps dominate the holdings of big players).
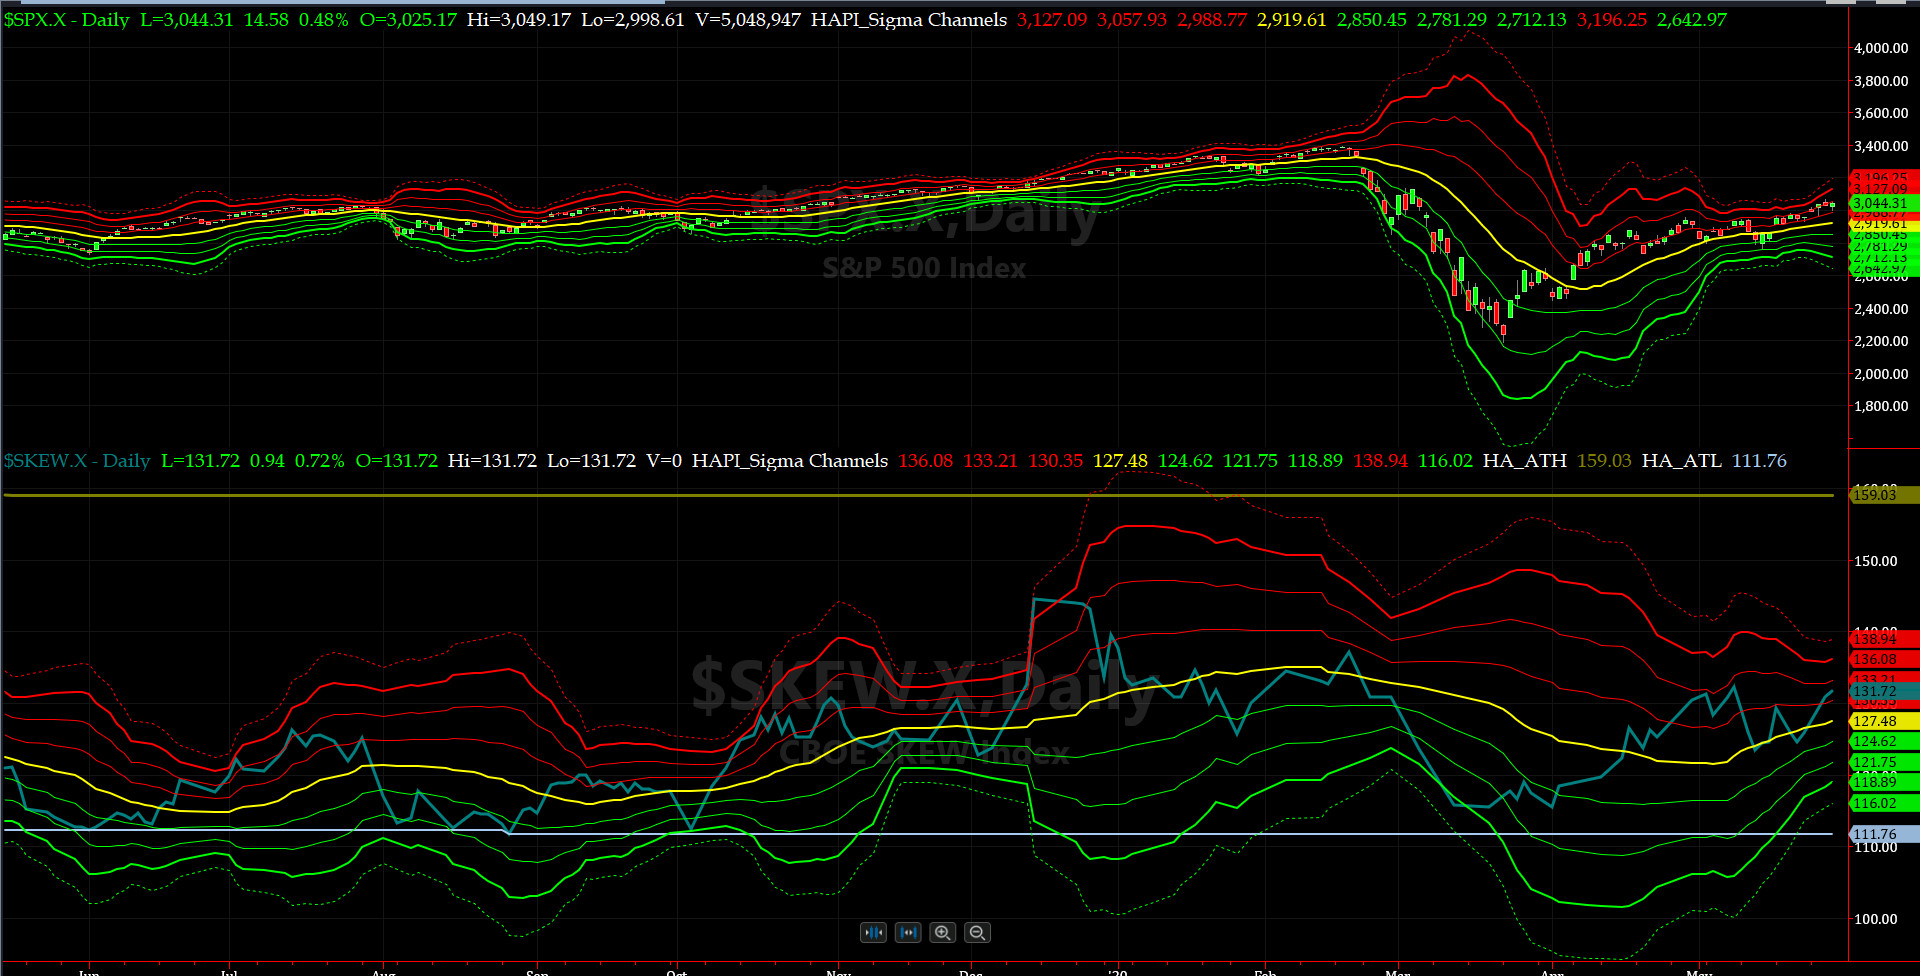
SPX SKEW (Downside Tail Risk) Chart
This week SPX SKEW (Downside Tail Risk) eased off on Thursday (SKEW is NOT computed every day any more) and closed at 132, now about its plus 1.5 sigma (normal = 115, range 100-150).
We wrote this on Twitter Friday night
All quiet on the Eastern & Mid-Western Fronts? HRH Admiral Tiko, KCPE, is still not buying Jared's bravado!!
How to interpret the value of SPX SKEW? (from CBOE white paper on SKEW)

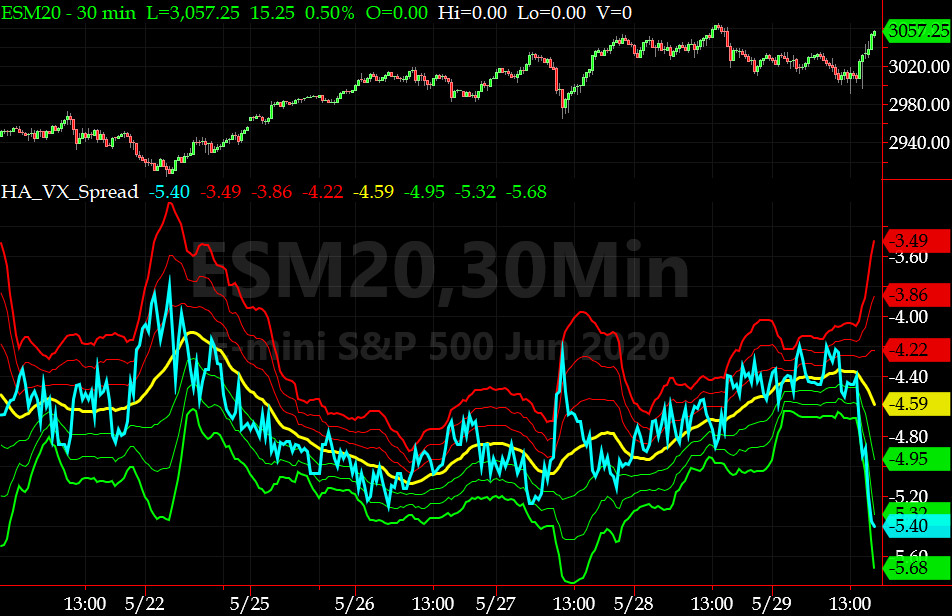
3-month VIX Futures Spread(VX) Chart
This shifted timing indicator for identifying tradable bottoms, (now long JUN20, & short SEP20 VIX Futures) hit -5.4 at the Close on Friday. That was a very bullish reading, almost too much.
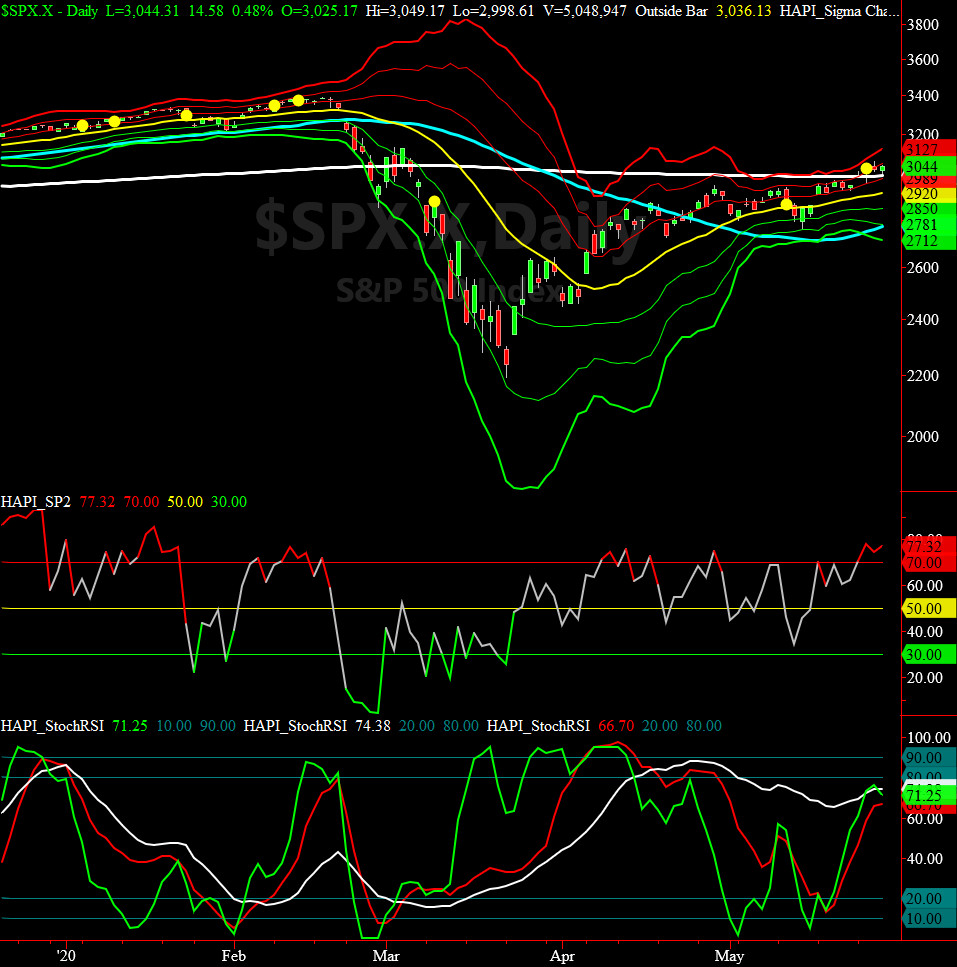
HA_SP2 Chart
HA_SP2 = 77.3 (Buy signal <= 30, Sell Signal >= 70)
This updated indicator says we are clearly overbought here.
Fari Hamzei
|
|
|
|
|
|
Friday, June 5, 2020, 0155ET
Notice of Change of Market Bias with Timer Digest
Dear Jim,
Jubert (of Three Days of Condor fame) taught us not to take any sides and just rely on your own precision.
We are getting LONG SPX today.
Cheers����.
Fari Hamzei
|
|
|
|
|
|
Customer Care:
|
|
|
|
|
|
|
 |
 |
|
 |
|
 |
 |
 |
HA YouTube Channel ::: HA Blog ::: Testimonials ::: Tutorials & FAQs ::: Privacy Policy
|
Trading Derivatives (Options & Futures) contains substantial risk and is not for every investor. An investor could potentially lose all or more than his/her initial investment.
Only risk capital should be used for trading and only those with sufficient risk capital should consider trading derivatives. Past performance is not
necessarily indicative of future results. Testimonials appearing on this website may not be representative of other clients or customers
and are not a guarantee of future performance or success.
|
| (c) 1998-2025, Hamzei Analytics, LLC.® All Rights Reserved. |
|
|