|
Thursday, October 29, 2020, 1330ET
Market Timing Charts, Analysis & Commentary for Issue #339

Timer Charts of S&P-500 Cash Index (SPX) + NASDAQ-100 Cash Index (NDX)
Most recent S&P-500 Cash Index (SPX) Close: 3218 down -6 (down -0.2%) for the seven trading days ending on Tuesday, July 28, 2020, which closed very near its plus 0.5 sigma.
DJIA ALL TIME INTRADAY HIGH = 29568 reached on Wednesday, February 12, 2020
DJT ALL TIME INTRADAY HIGH = 11945 reached on Monday, October 12, 2020
SPX ALL TIME INTRADAY HIGH = 3588 reached on Wednesday, September 2, 2020
NDX ALL TIME INTRADAY HIGH = 8873 reached on Wednesday, September 2, 2020
RUT ALL TIME INTRADAY HIGH = 1742 reached on Friday, August 31, 2018
Current DAILY +2 Sigma SPX = 3507 with WEEKLY +2 Sigma = 3578
Current DAILY 0 Sigma SPX = 3363 with WEEKLY 0 Sigma = 3287
Current DAILY -2 Sigma SPX = 3220 with WEEKLY -2 Sigma = 2996
NYSE McClellan Oscillator = +177 (-150 is start of the O/S area; around -275 to -300 area or lower, we go into the �launch-pad� mode; over +150, we are in O/B area)
NYSE Breadth Thrust = 61.3(40 is considered as oversold and 65 as overbought)
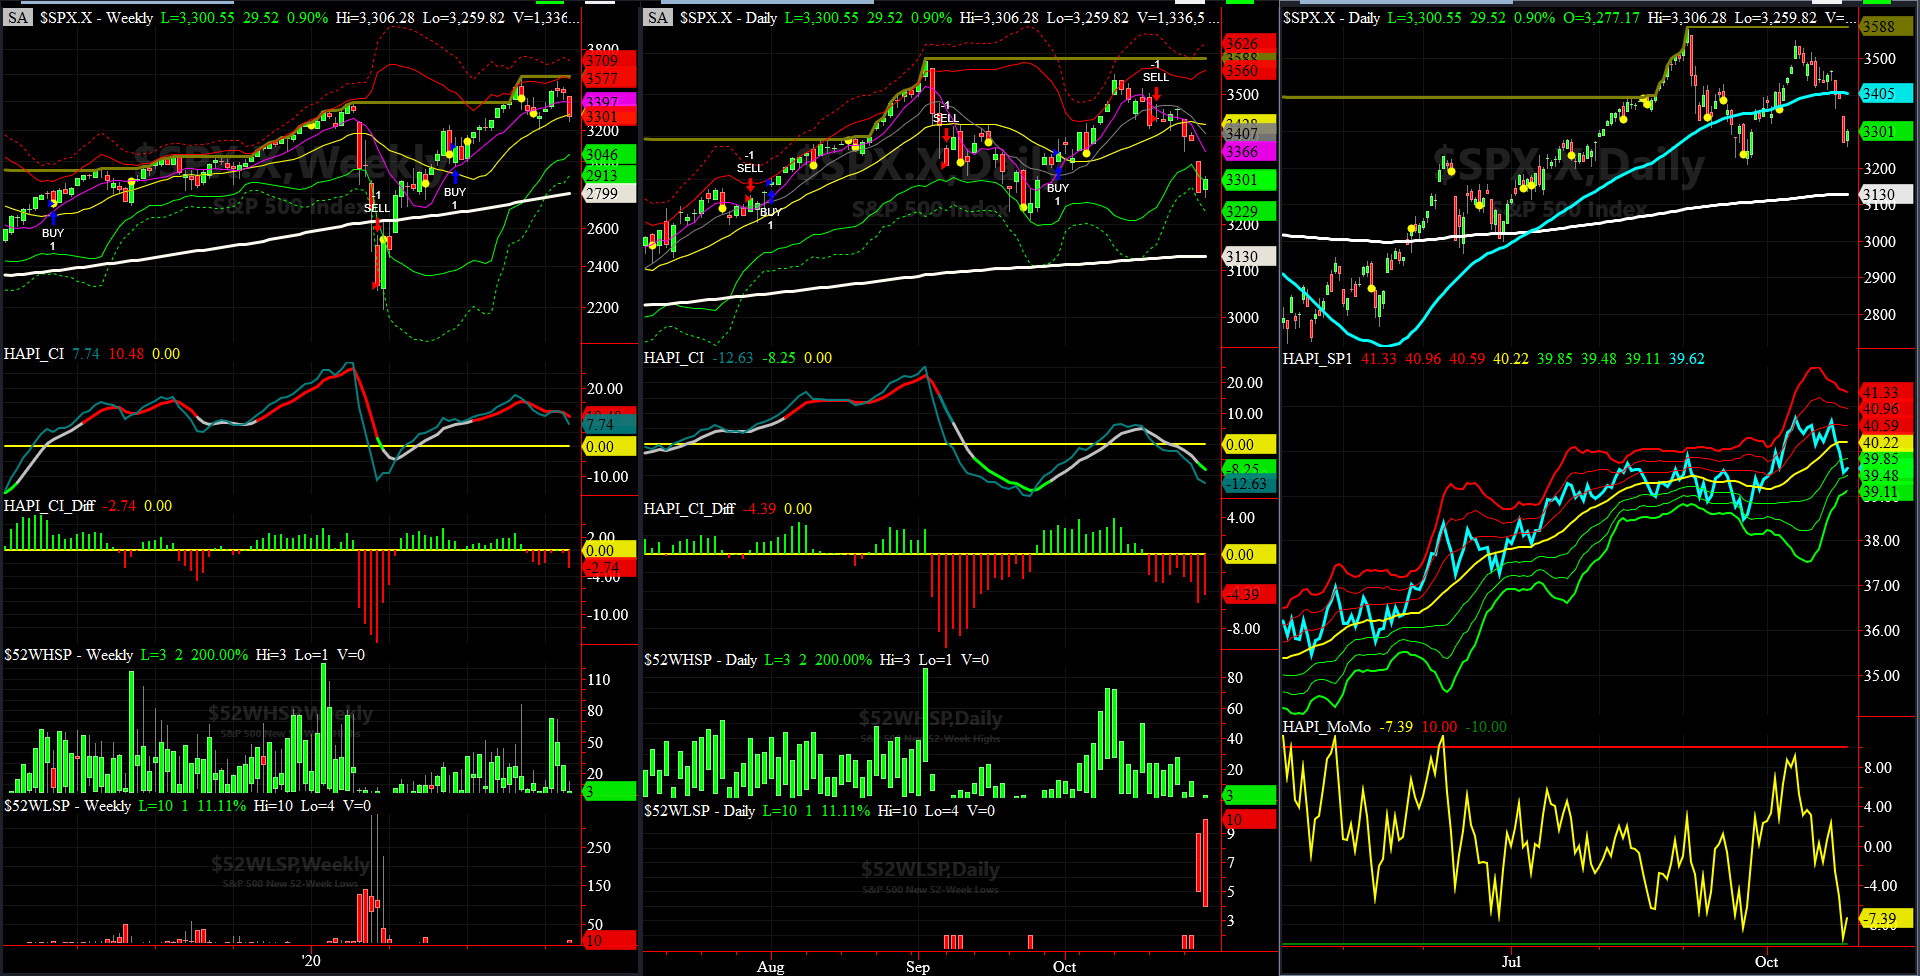
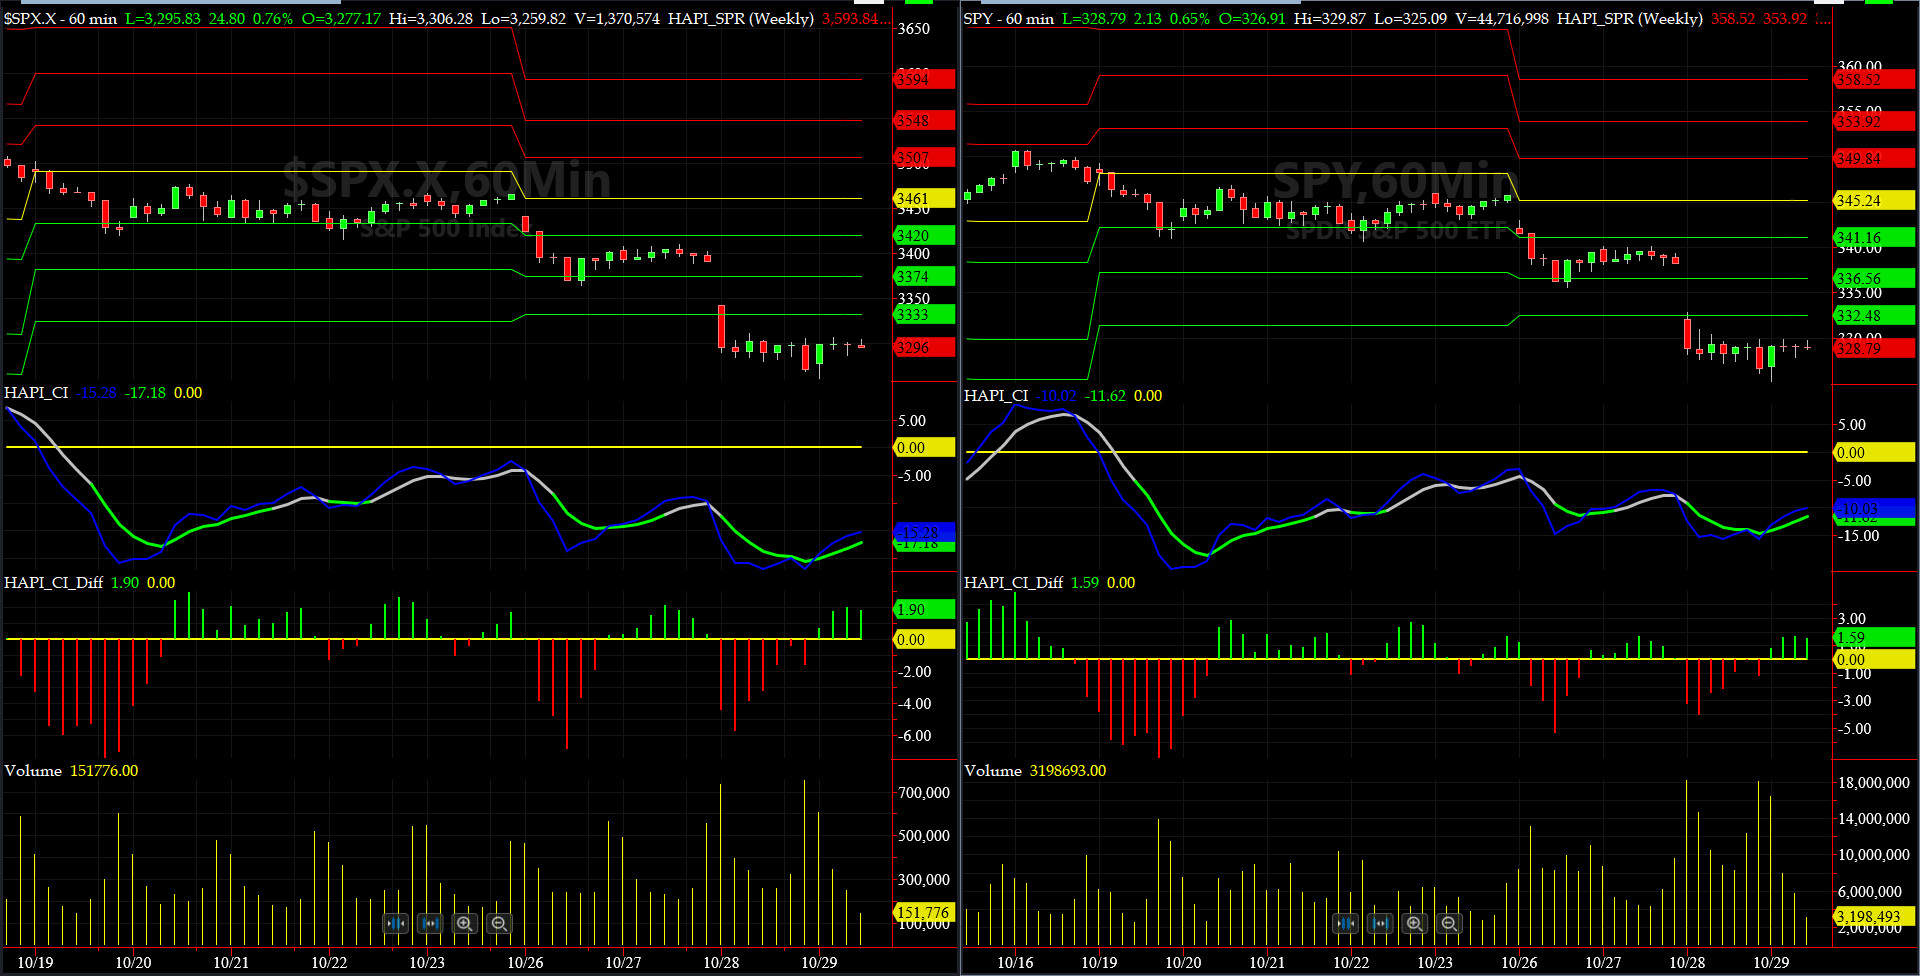
HA_SP1_Momo Chart
WEEKLY Timing Model = on a BUY Signal since Friday, June 19, 2020 CLOSE at 3097
DAILY Timing Model = on a BUY Signal since Wednesday, Sept 30, 2020 CLOSE at 3363
Max SPX 52wk-highs reading last week = 70 (over 120-140, the local maxima is in)
Max SPX 52wk-Lows reading last week = 1 (over 40-60, the local minima is in)
HA_SP1 again closed near its plus 2 sigma channels
HA_Momo = +9.1 (reversals most likely occur above +10 or below -10)
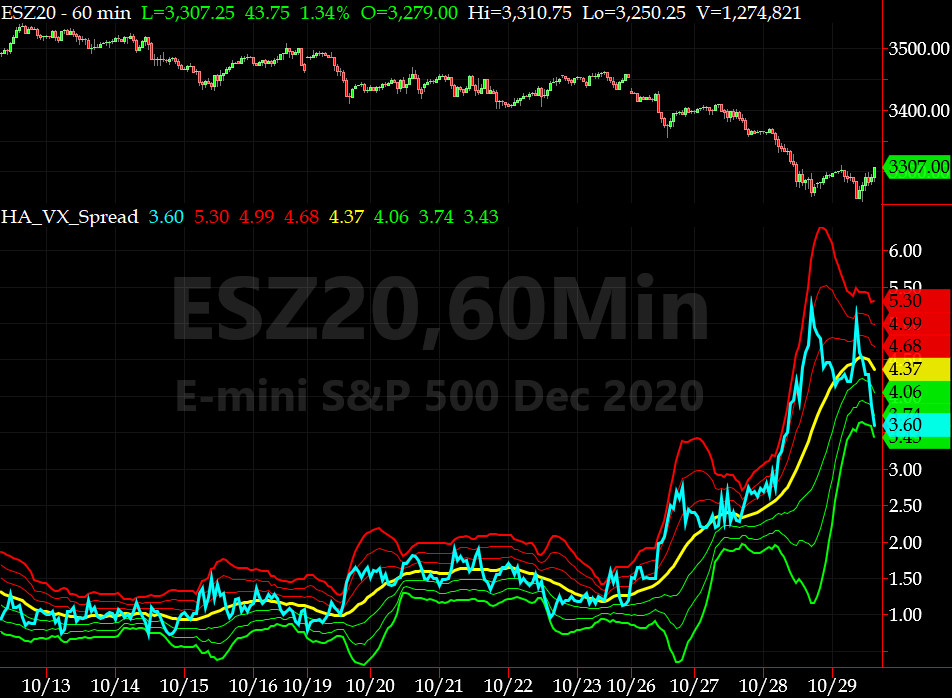
3-month VIX Futures Spread(VX) Chart
This shifted timing indicator for identifying tradable bottoms, (now long AUG20, & short NOV20 VIX Futures) hit -1.26 at the Close on Monday. This is another near overbought reading.
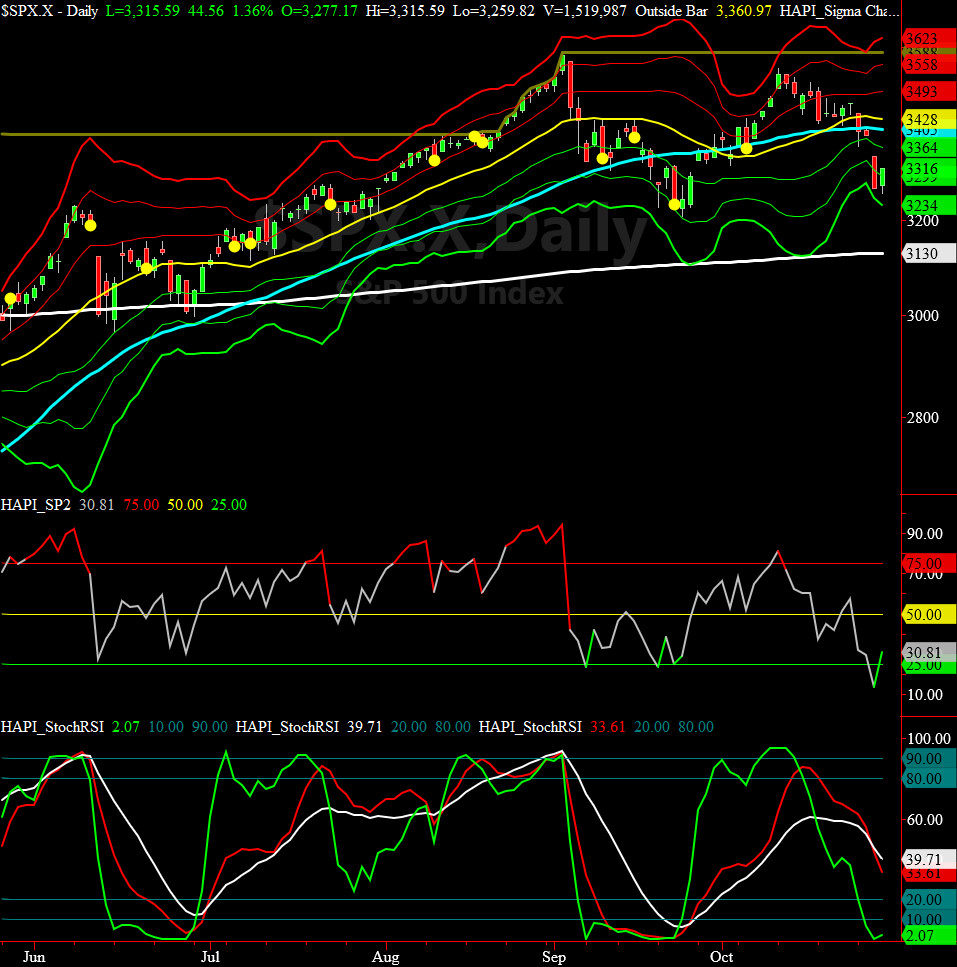
HA_SP2 Chart
HA_SP2 = 81.3 (Buy signal <= 30, Sell Signal >= 70)
This fantastic timing indicator says we are slightly overbought here.
Fari Hamzei
|


 Proactive Market Timing