|
Wednesday, December 16, 2020, 2345ET
Market Timing Charts, Analysis & Commentary for Issue #342
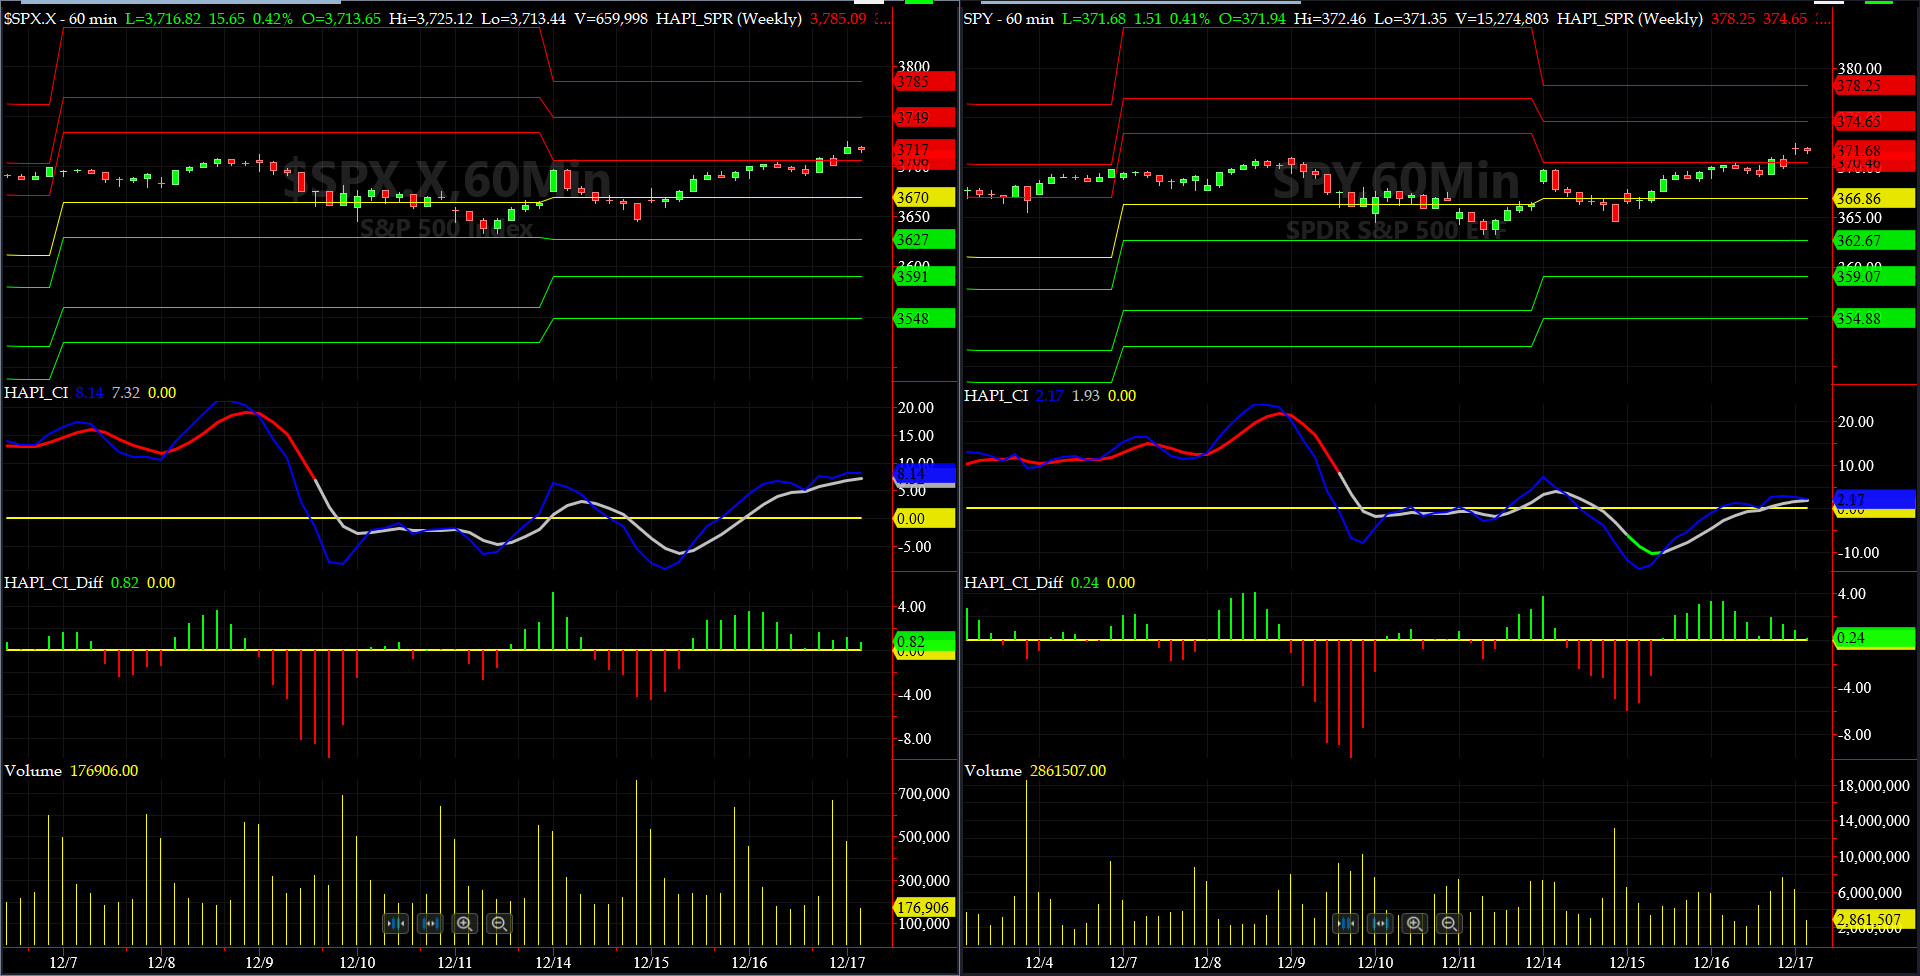
Timer Charts of S&P-500 Cash Index (SPX) + NASDAQ-100 Cash Index (NDX)
Most recent S&P-500 Cash Index (SPX) Close: 3701 up +29 (up +0.78%) for one week ending on Wednesday, December 16, 2020, which closed very near its +1.5 sigma.
DJIA ALL TIME INTRADAY HIGH = 30326 reached on Monday, December 14, 2020
DJT ALL TIME INTRADAY HIGH = 12918 reached on Wednesday, December 9, 2020
SPX ALL TIME INTRADAY HIGH = 3712 reached on Wednesday, December 9, 2020
NDX ALL TIME INTRADAY HIGH = 12698 reached on Wednesday, December 16, 2020
RUT ALL TIME INTRADAY HIGH = 1960 reached on Wednesday, December 16, 2020
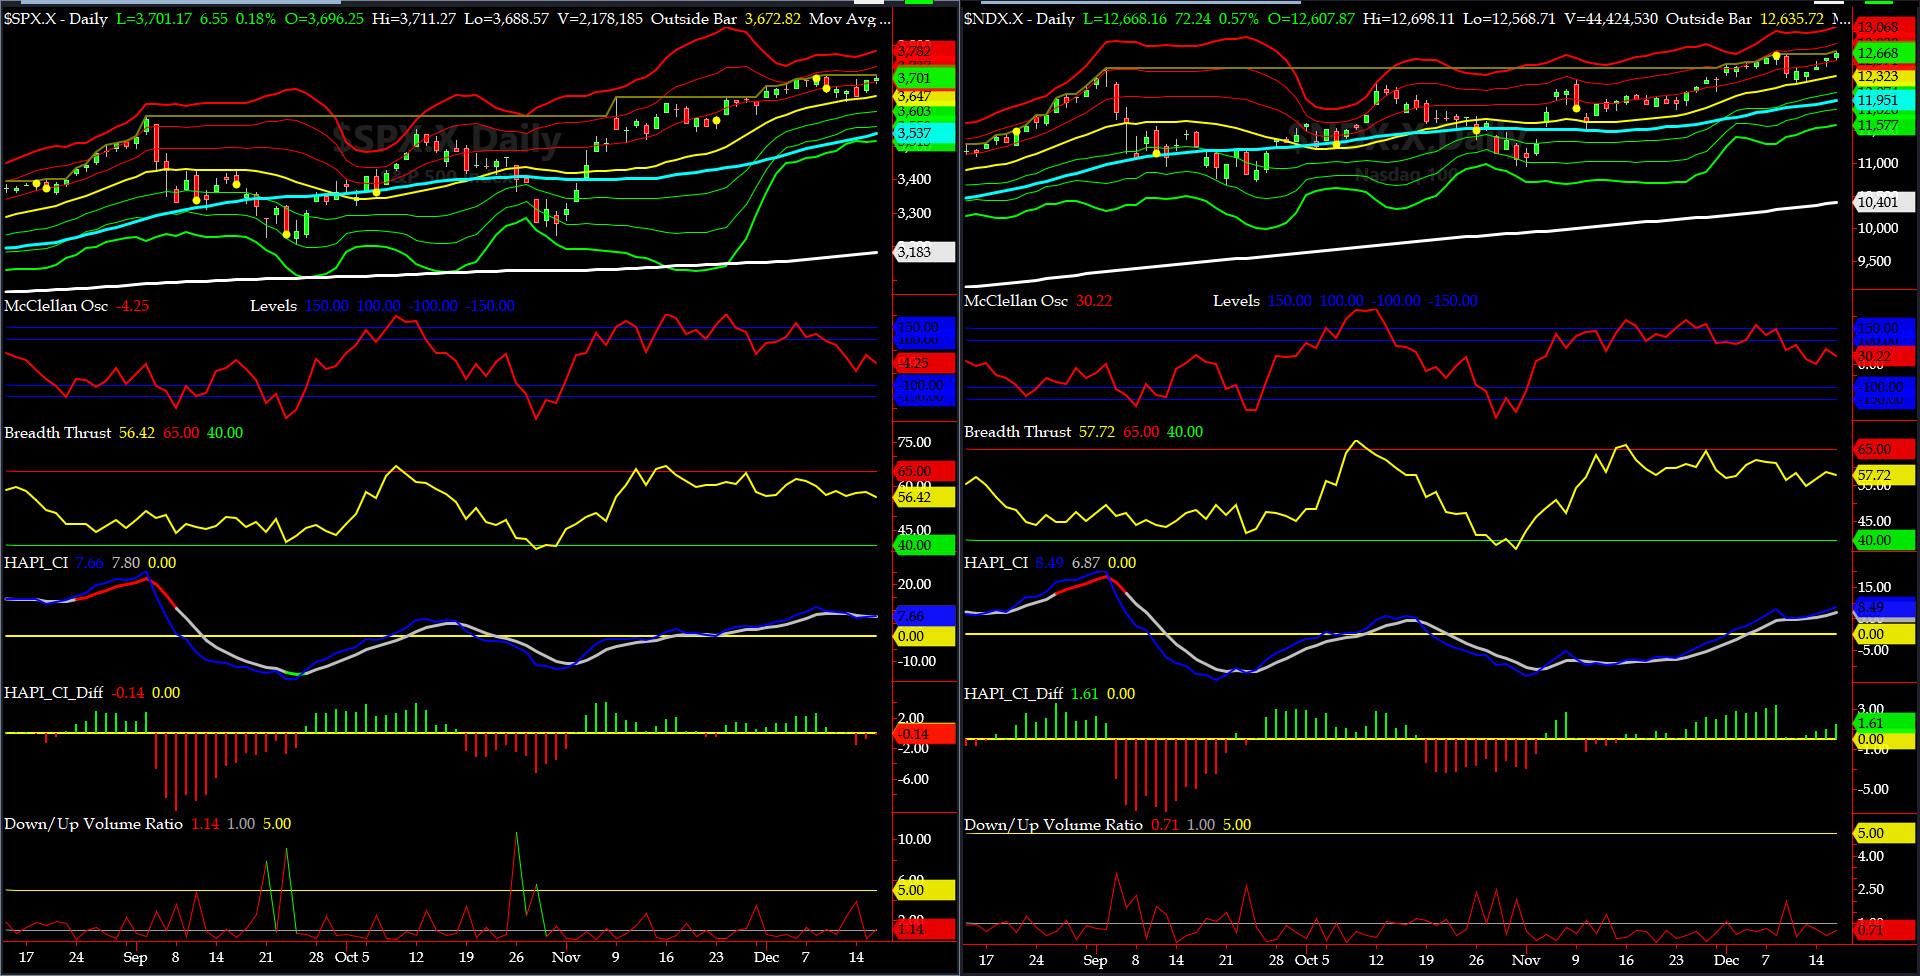
Current DAILY +2 Sigma SPX = 3737 with WEEKLY +2 Sigma = 3735
Current DAILY 0 Sigma SPX = 3647 with WEEKLY 0 Sigma = 3471
Current DAILY -2 Sigma SPX = 3558 with WEEKLY -2 Sigma = 3206
NYSE McClellan Oscillator = -4 (-150 is start of the O/S area; around -275 to -300 area or lower, we go into the �launch-pad� mode; over +150, we are in O/B area)
NYSE Breadth Thrust = 56.4 (40 is considered as oversold and 65 as overbought)
DJIA, SPX, NDX, DJT & RUT have been on a tear, since October 30th. So much for a Biden Crash.
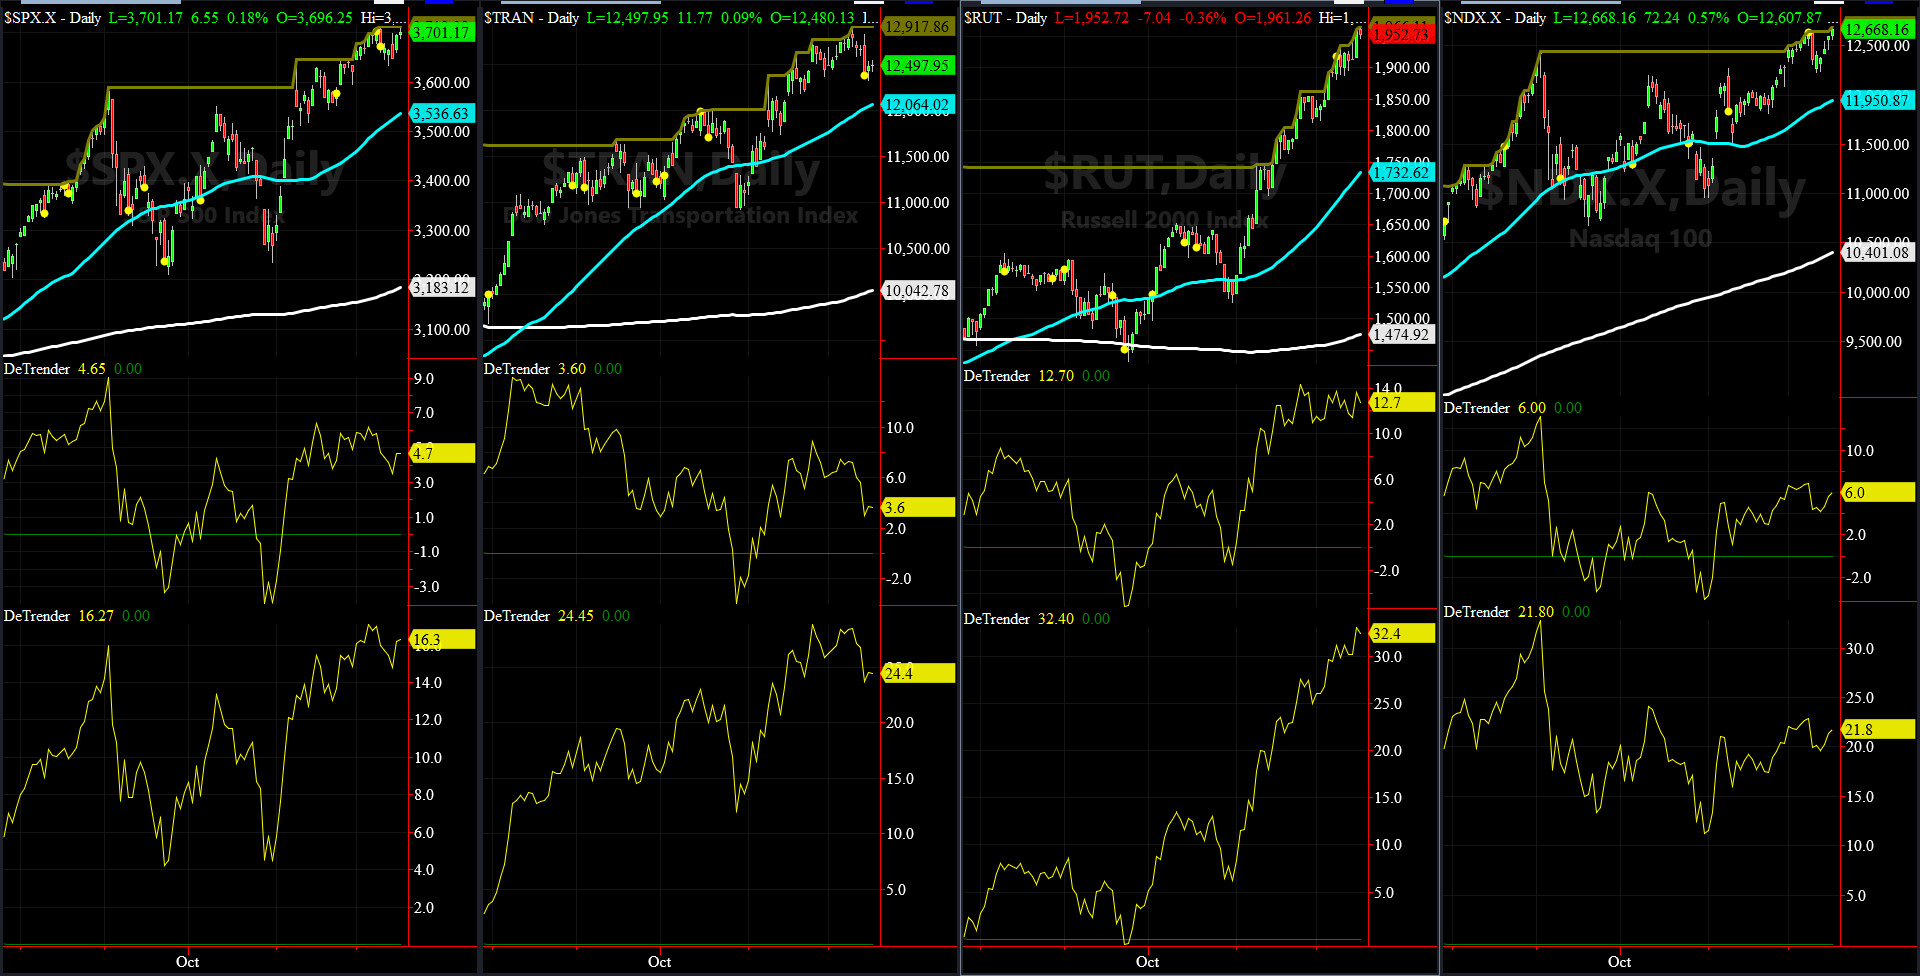
DeTrenders Charts for SPX, NDX, TRAN & RUT Indices
200-Day MA DJ TRAN = 10043 or 24.4% ABOVE the DJ TRAN (max observed in last 7 yrs = 20.2%, min = -20.3%)
200-Day MA RUT = 1472 or 33.1% ABOVE RUT (max observed in last 7 yrs = 21.3%, min = -22.6%)
50-Day MA SPX = 3580 or 4.7% BELOW SPX (max observed in last 7 yrs = +8.6%, min = -9.3%)
200-Day MA SPX = 3180 or 16.2% BELOW SPX (max observed in last 7 yrs = 15.2%, min = -14%)
DJ Transportation Index (proxy for economic conditions 6 to 9 months hence) has had a horrible drop last month, after registering another ATH last Wednesday.
Russell 2000 Small Caps Index (proxy for Risk ON/OFF) has been launched to stratosphere back in late October.
ALL of our EIGHT DeTrenders are in the POSITIVE territory. The DeTrenders for DJ Tran & RUT will continue to be harbingers of future price behavior in broad indices.
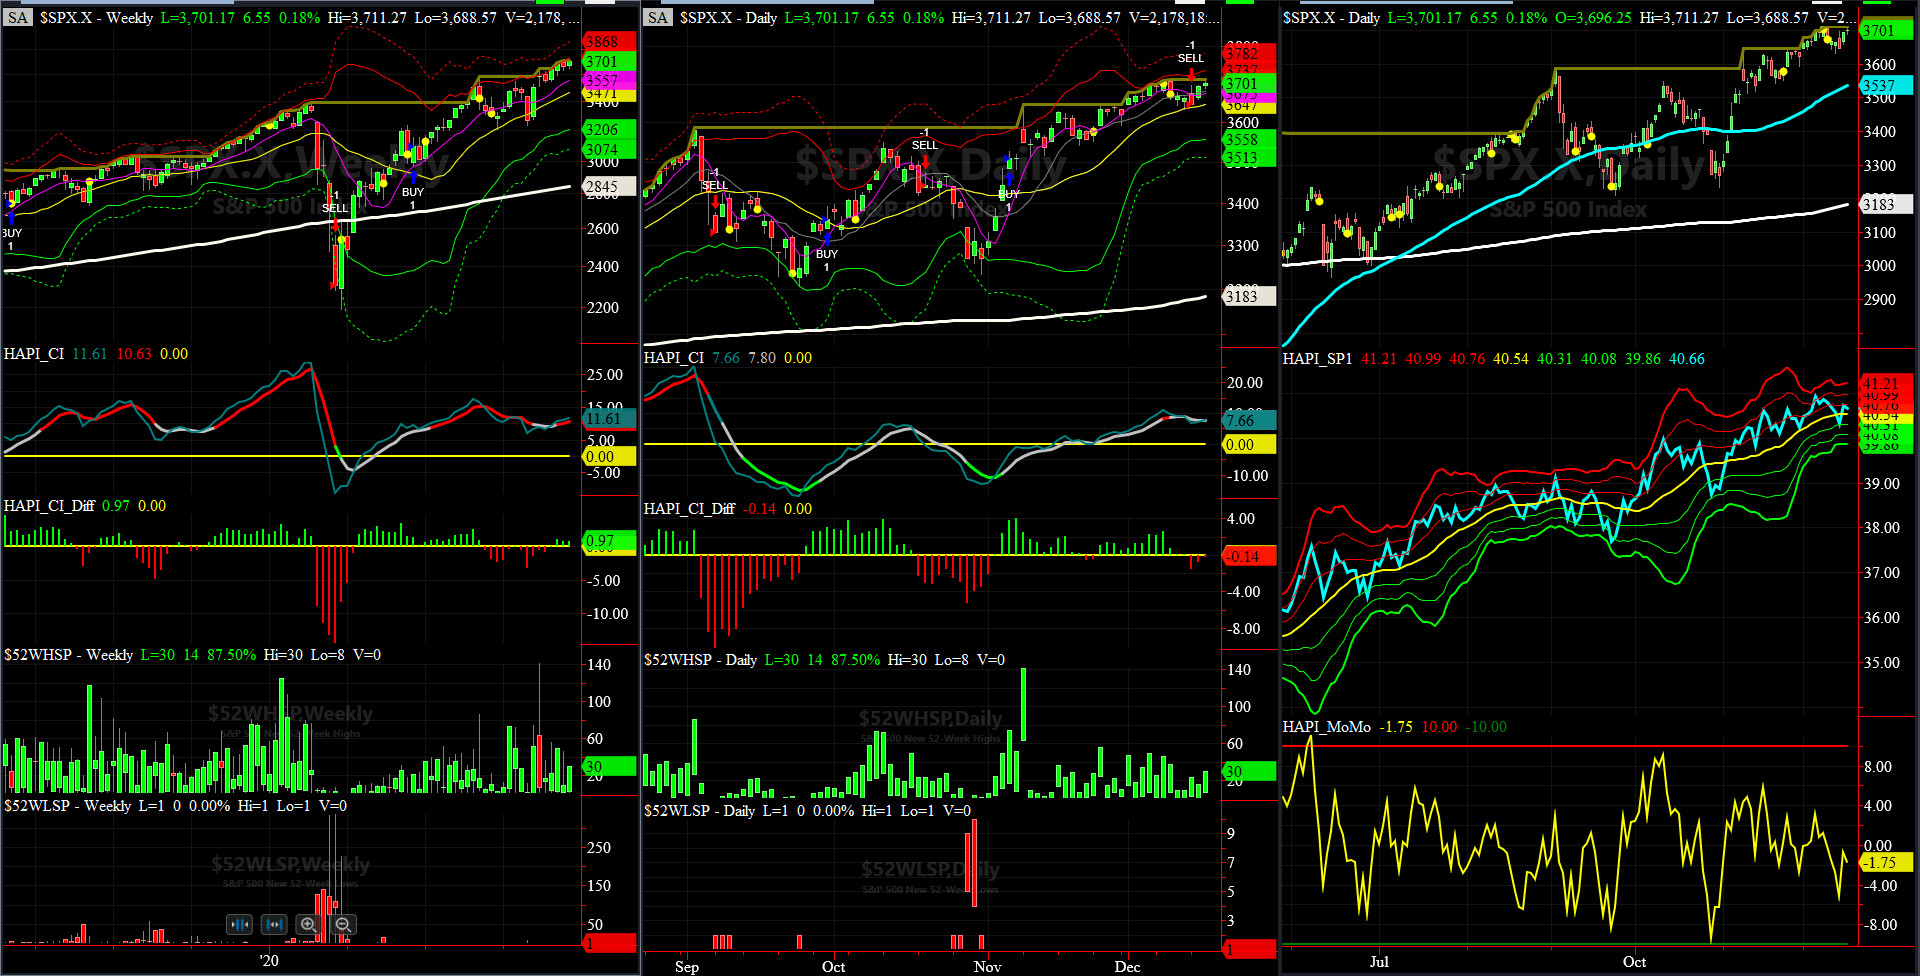
HA_SP1_Momo Chart
WEEKLY Timing Model = on a BUY Signal since Friday, June 19, 2020 CLOSE at 3098
DAILY Timing Model = on a SELL Signal since Monday, June 14, 2020 CLOSE at 3647
Max SPX 52wk-highs reading last week = 30 (over 120-140, the local maxima is in)
Max SPX 52wk-Lows reading last week = 1 (over 40-60, the local minima is in)
HA_SP1 closed near its +0.5 sigma channels
HA_Momo = -1.74 (reversals most likely occur above +10 or below -10)
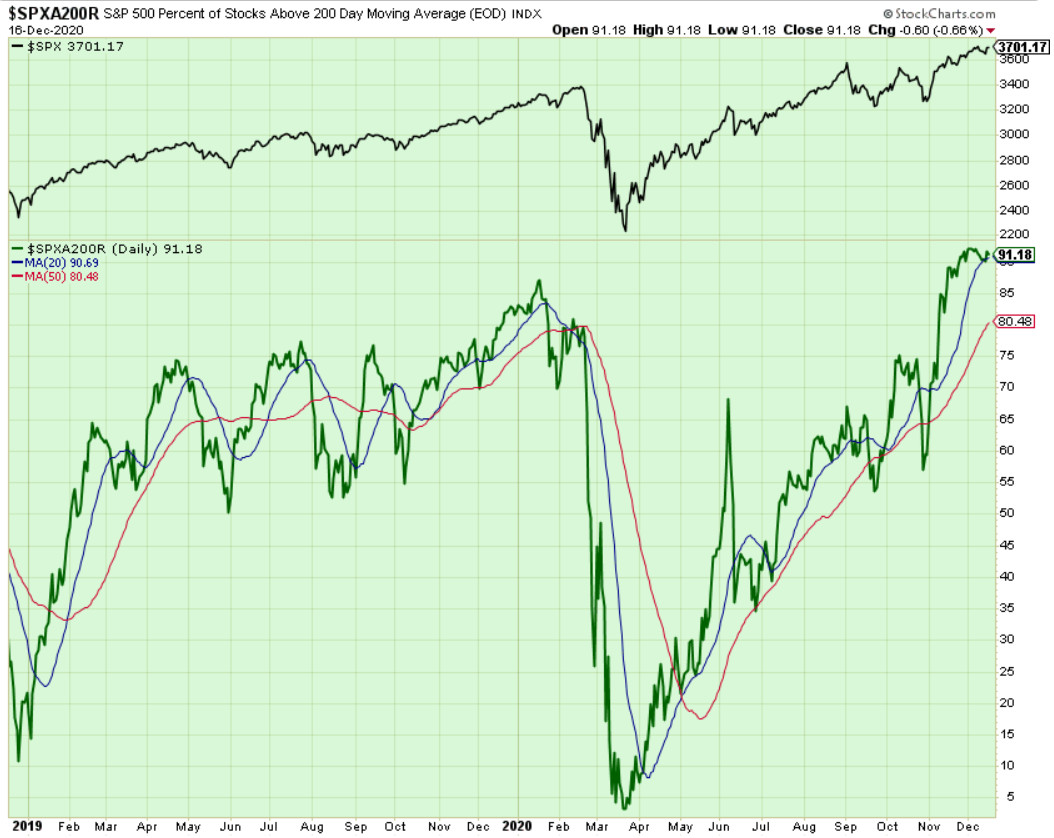
Components of SPX above their respective 200-day MA Chart
This scoring indicator closed at 91% after a run-up to 93-94 area, which we had never observed before in the last 12 years we have monitored this index.
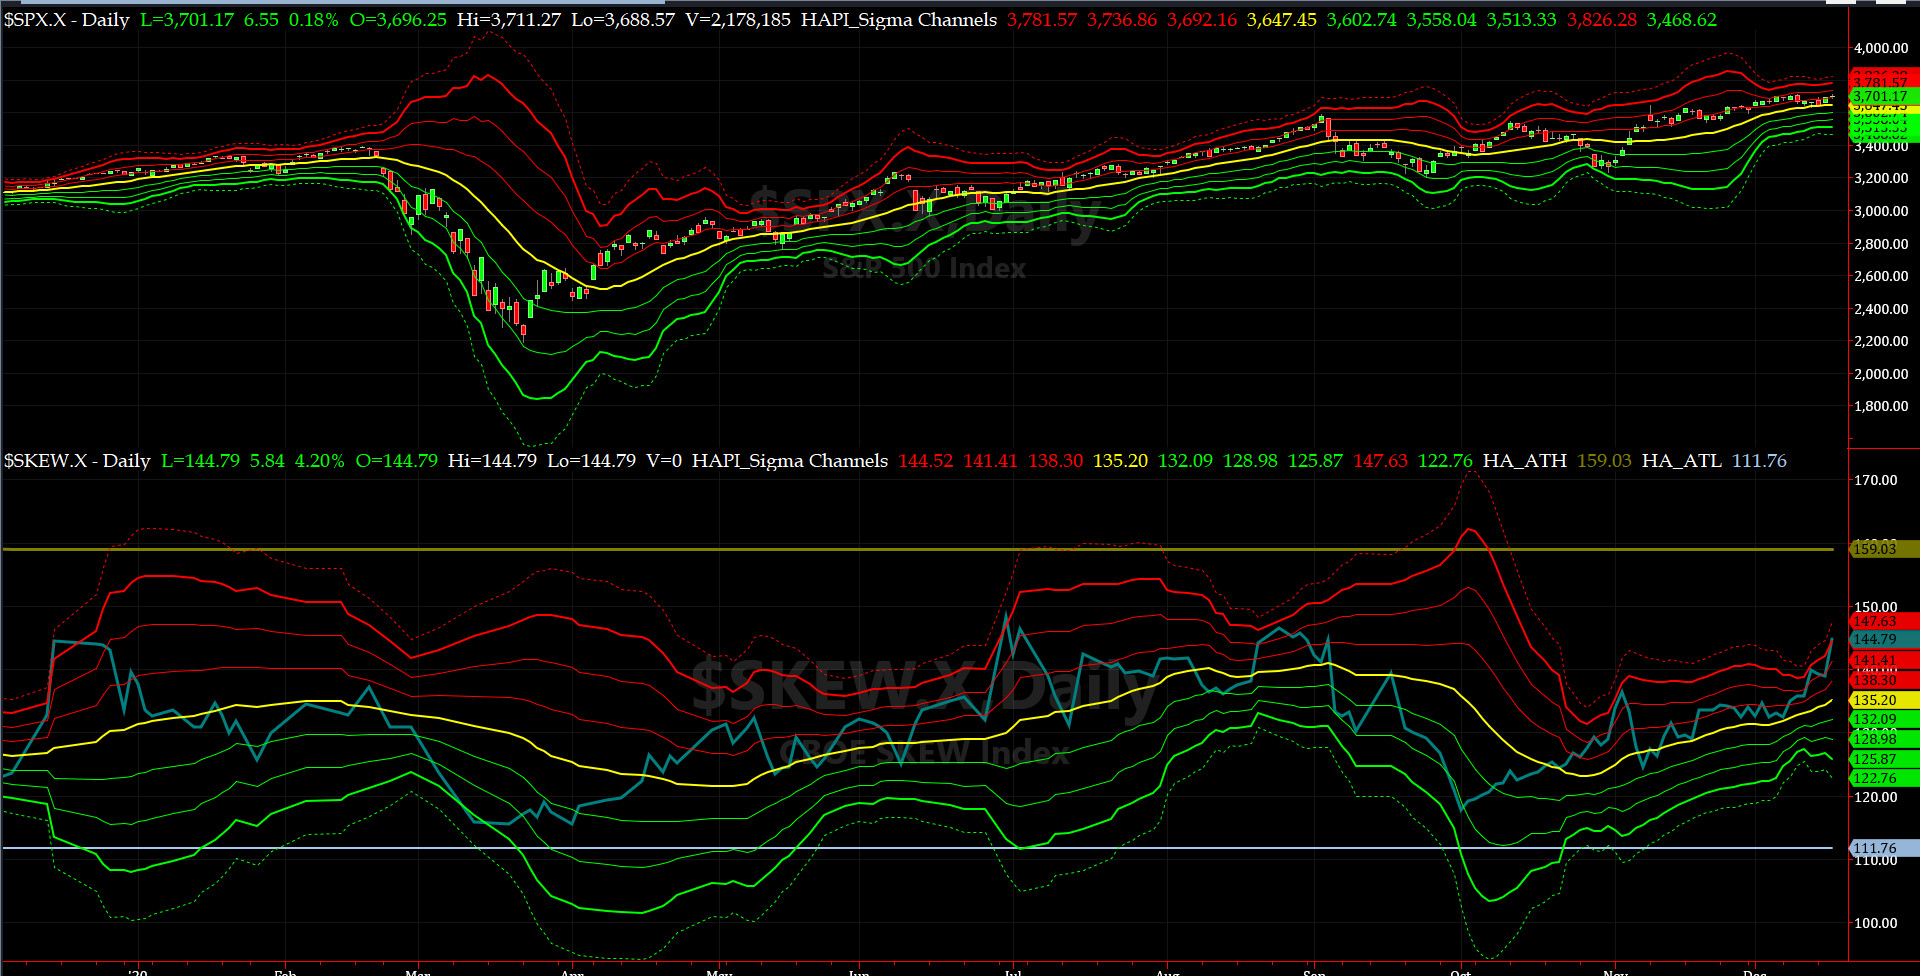
SPX SKEW (Downside Tail Risk) Chart
This week SPX SKEW (Downside Tail Risk) has been hiking up since Nov 1st and closed today at 145, now about its +3 sigma (normal = 115, range 100-150).
All quiet on the Eastern & Mid-Western Fronts? HRH Admiral Tiko, KCPE, says he is cautiously bullish here.....
How to interpret the value of SPX SKEW? (from CBOE white paper on SKEW)

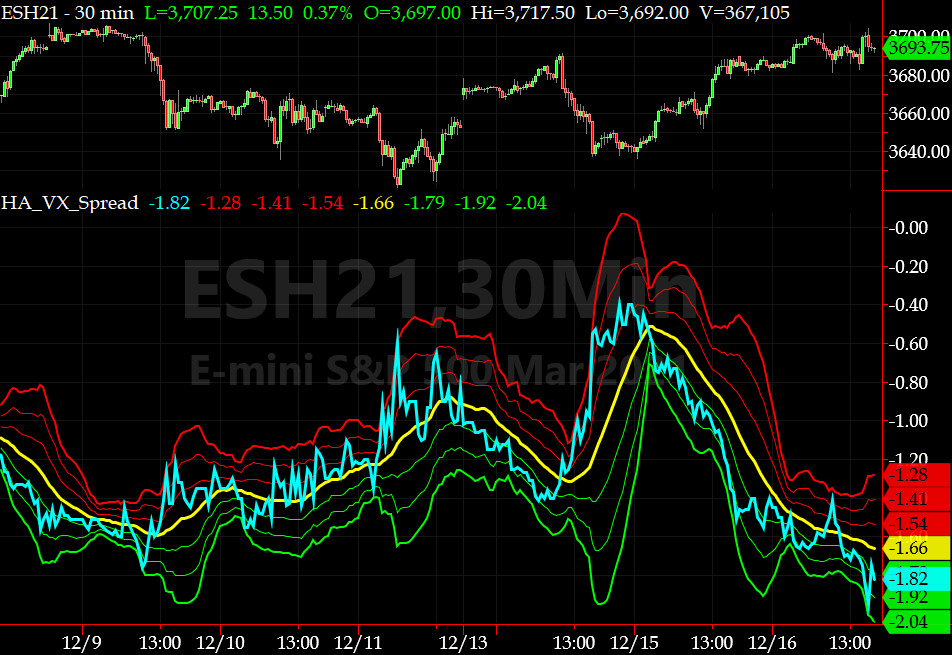
3-month VIX Futures Spread(VX) Chart
This popular timing indicator for identifying tradable bottoms, (now long JAN21, & short APR21 VIX Futures) hit -1.82 after the Close. This is too bullish.
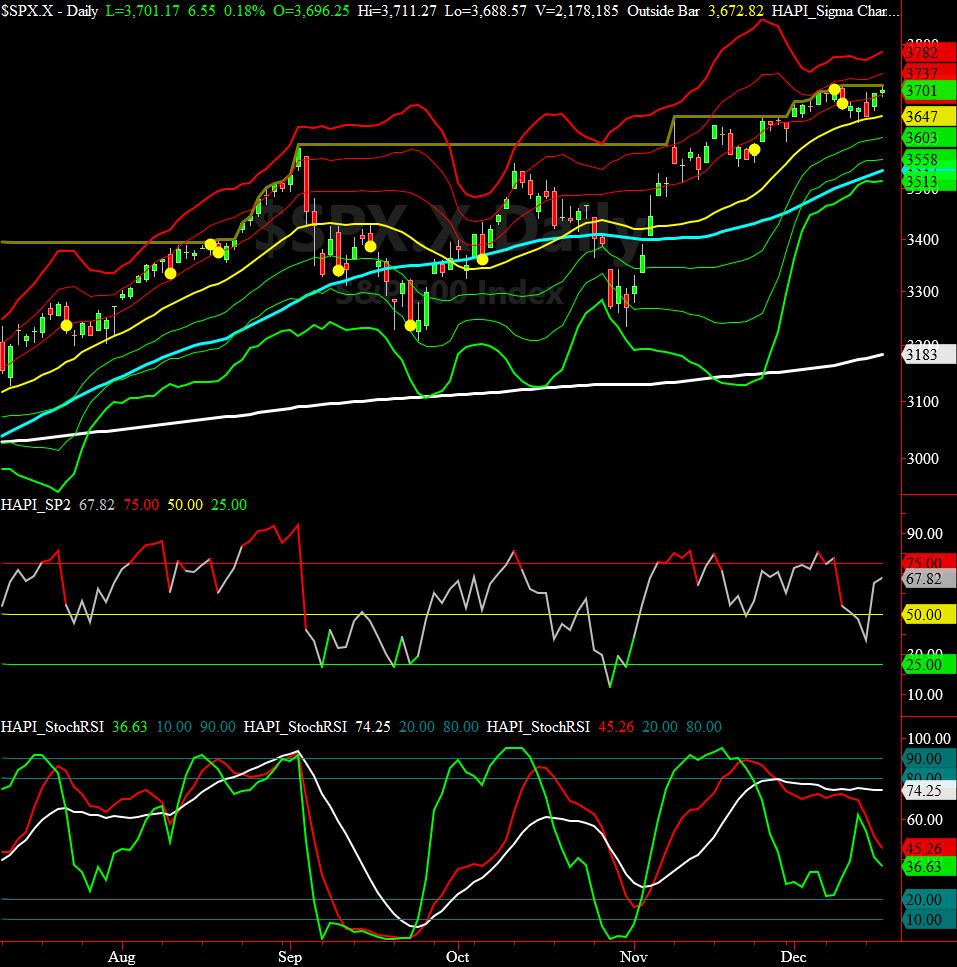
HA_SP2 Chart
HA_SP2 = 67.8 (Buy signal <= 30, Sell Signal >= 70)
This indicator says we are at NEUTRAL right now but heading south, most likely.
Fari Hamzei
|


 Proactive Market Timing